삼성 960 EVO SSD 1TB 리뷰 (48층 TLC)

상위 모델인 960PRO에 이어 메인스트림급 신형 960EVO SSD 성능 확인
| Samsung 960 EVO Specifications Comparison | ||||||
| 960 EVO 1TB | 960 EVO 500GB | 960 EVO 250GB | 950 PRO 512GB | 950 PRO 256GB | ||
| Form Factor | single-sided M.2 2280 | single-sided M.2 2280 | ||||
| Controller | Samsung Polaris | Samsung UBX | ||||
| Interface | PCIe 3.0 x4 | |||||
| NAND | Samsung 48-layer 256Gb TLC V-NAND | Samsung 32-layer 128Gbit MLC V-NAND | ||||
| SLC Cache Size | 42GB | 22 GB | 13GB | N/A | ||
| Sequential Read | 3200 MB/s | 3200 MB/s | 3200 MB/s | 2500 MB/s | 2200 MB/s | |
| Sequential Write (SLC Cache) | 1900 MB/s | 1800 MB/s | 1500 MB/s | 1500 MB/s | 900 MB/s | |
| Sequential Write (sustained) | 1200 MB/s | 600 MB/s | 300 MB/s | N/A | N/A | |
| 4KB Random Read (QD32) | 380k IOPS | 330k IOPS | 330k IOPS | 300k IOPS | 270k IOPS | |
| 4KB Random Write (QD32) | 360k IOPS | 330k IOPS | 300k IOPS | 110k IOPS | 85k IOPS | |
| Power | 5.7W (average) | 5.4W (average) | 5.3W (average) | 7.0W (burst) 5.7W (average) 1.7W (idle) | 6.4W (burst) 5.1 (average) 1.7W (idle) | |
| Endurance | 400TB | 200TB | 100TB | 400TB | 200TB | |
| Warranty | 3 Year | 5 Year | ||||
| Launch MSRP | $479.99 | $249.99 | $129.88 | $350 | $200 | |
- 삼성 960 EVO SSD 스펙
폼팩터 : single-sided M.2 2280
컨트롤러 : 삼성 폴라리스
인터페이스 : PCIe 3.0 x4
낸드 : 48층 256Gb TLC V-NAND
캐시 : 13GB ~ 42GB
시퀀셜 읽기 : 3200 MB/s
시퀀셜 쓰기 : 1500 MB/s ~ 1900 MB/s
랜덤 읽기 : 330k IOPS ~ 380k IOPS
랜덤 쓰기 : 300k IOPS ~ 360k IOPS
전력소모 : 5.3W ~ 5.7W
보증기간 : 3년
%20Review&txt=%3Cimg%20alt%3D%22%22%20src%3D%22http%3A%2F%2Fimages.anandtech.com%2Fdoci%2F10833%2FIMGP3590_01_575px.jpg%22%3E)
스티커 쪽에 히트 스프레더 기능
- 테스트 시스템
| AnandTech 2015 SSD Test System | |
| CPU | Intel Core i7-4770K running at 3.5GHz (Turbo & EIST enabled, C-states disabled) |
| Motherboard | ASUS Z97 Pro (BIOS 2701) |
| Chipset | Intel Z97 |
| Memory | Corsair Vengeance DDR3-1866 2x8GB (9-10-9-27 2T) |
| Graphics | Intel HD Graphics 4600 |
| Desktop Resolution | 1920 x 1200 |
| OS | Windows 8.1 x64 |
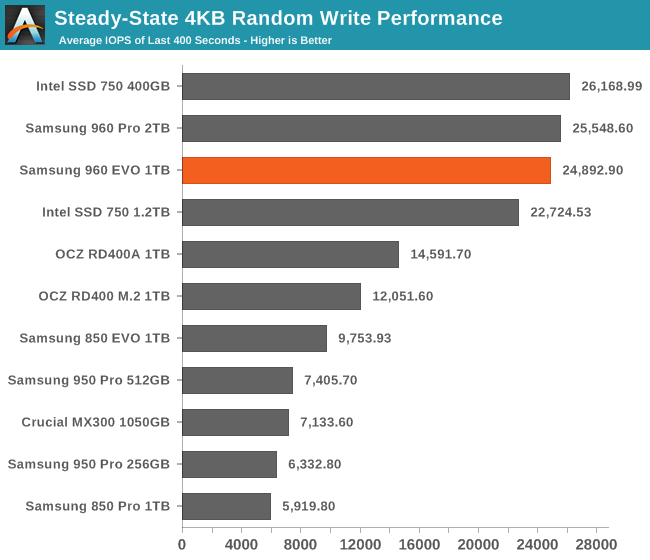
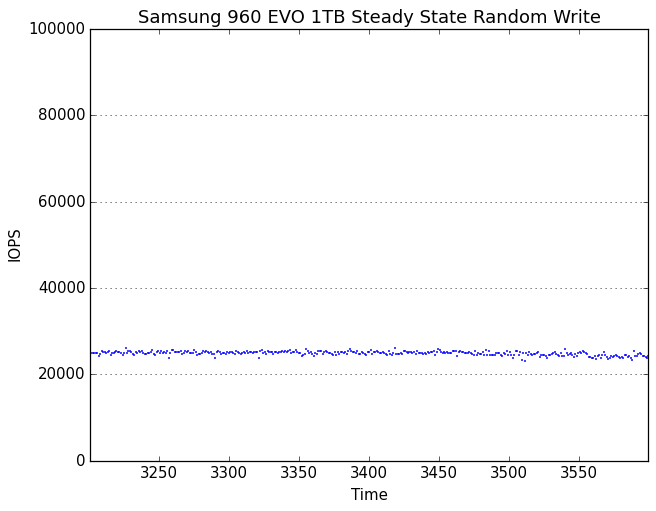
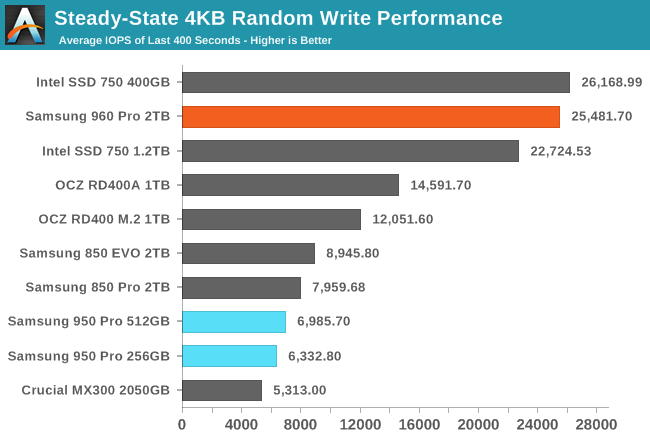
The 960 EVO's steady state random write speed is not quite as fast as the 960 Pro, but it's in the same league and much faster than most consumer SSDs.
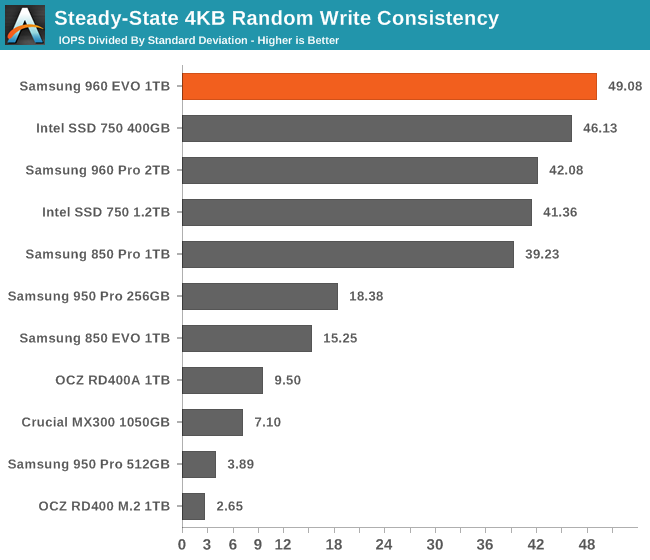
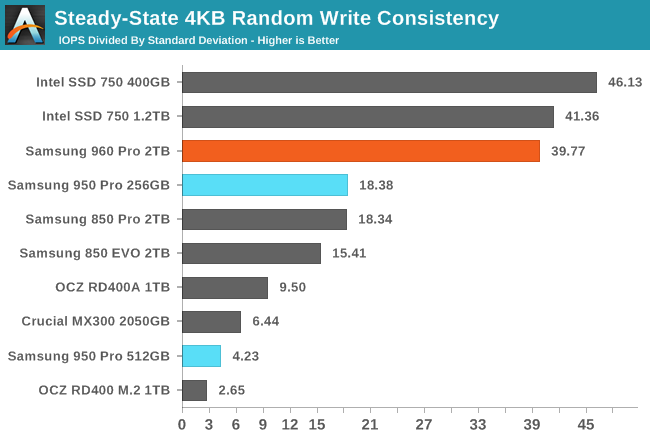
The 960 EVO sets a new record for combining high performance with consistency. It's a bit slower than the 960 Pro, but less variable.
 | |||||||||
| Default | Samsung 960 EVO 1TBCrucial MX300 1050GBOCZ RD400 1TB (M.2)OCZ RD400A 1TBSamsung 850 EVO 1TBSamsung 850 Pro 1TBSamsung 950 Pro 256GBSamsung 950 Pro 512GBSamsung 960 Pro 2TBIntel SSD 750 1.2TB (PCIe 3.0 x4 - NVMe)Samsung SM951 512GB (PCIe 3.0 x4 - AHCI)Samsung XP941 512GB (PCIe 2.0 x4 - AHCI) | ||||||||
| 25% Over-Provisioning | Samsung 960 EVO 1TBCrucial MX300 1050GBOCZ RD400 1TB (M.2)OCZ RD400A 1TBSamsung 850 EVO 1TBSamsung 850 Pro 1TBSamsung 950 Pro 256GBSamsung 950 Pro 512GBSamsung 960 Pro 2TB | ||||||||
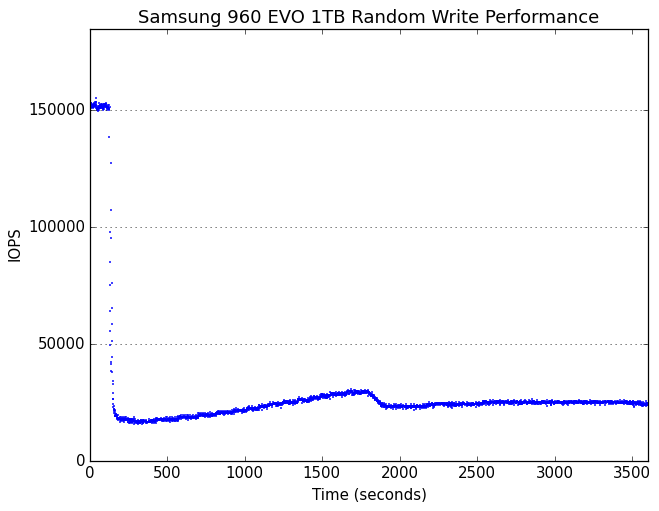
Highly consistent performance is a good thing, but it makes for a boring graph. The transitions from peak to sustained performance modes look the same for both the 960 Pro and the 960 EVO.
 | |||||||||
| Default | Samsung 960 EVO 1TBCrucial MX300 1050GBOCZ RD400 1TB (M.2)OCZ RD400A 1TBSamsung 850 EVO 1TBSamsung 850 Pro 1TBSamsung 950 Pro 256GBSamsung 950 Pro 512GBSamsung 960 Pro 2TBIntel SSD 750 1.2TB (PCIe 3.0 x4 - NVMe)Samsung SM951 512GB (PCIe 3.0 x4 - AHCI)Samsung XP941 512GB (PCIe 2.0 x4 - AHCI) | ||||||||
| 25% Over-Provisioning | Samsung 960 EVO 1TBCrucial MX300 1050GBOCZ RD400 1TB (M.2)OCZ RD400A 1TBSamsung 850 EVO 1TBSamsung 850 Pro 1TBSamsung 950 Pro 256GBSamsung 950 Pro 512GBSamsung 960 Pro 2TB | ||||||||
The 960 EVO responds to extra overprovisioning with even more consistent (and high) performance.
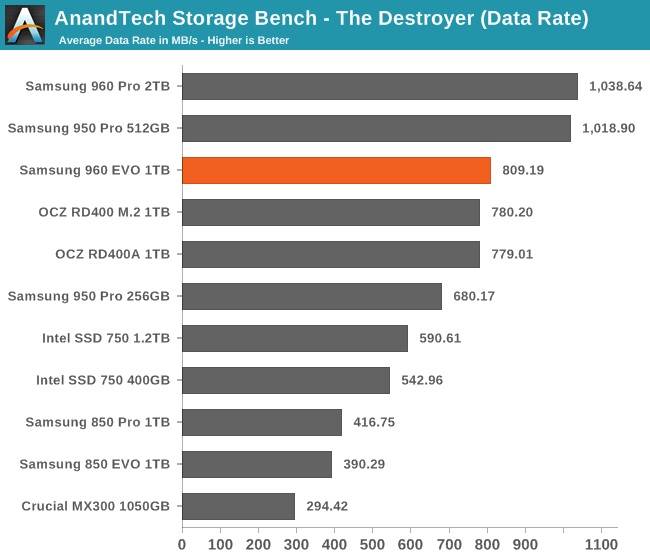
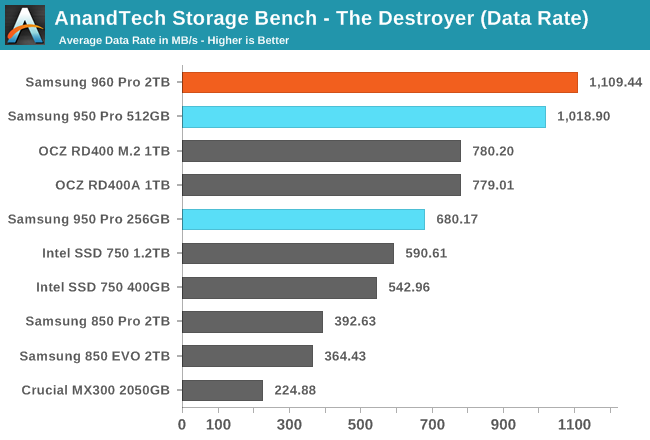
The 960 EVO is substantially slower than both the 950 Pro and 960 Pro, but the 960 EVO is faster than the flagship SSDs from Toshiba and Intel.
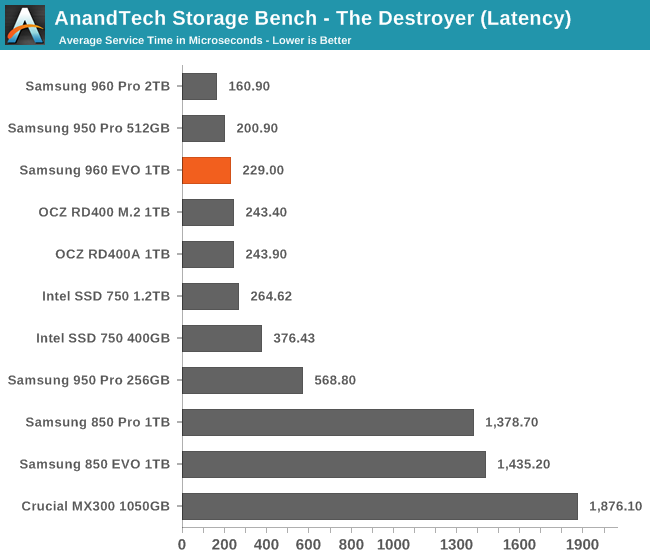
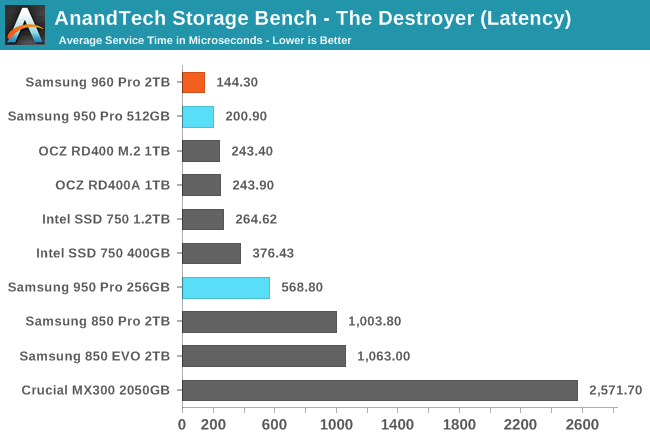
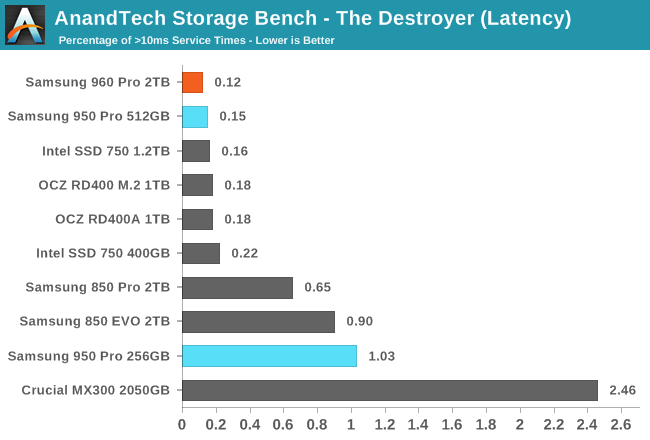
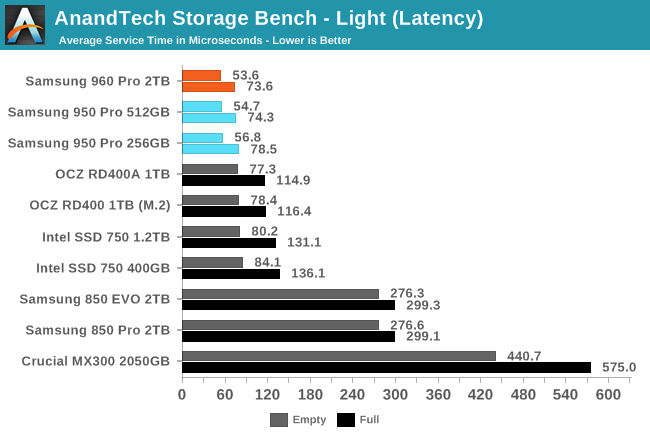
The 960 EVO delivers average service times on par with other high-end PCIe SSDs, and is still slightly faster than any non-Samsung drive.
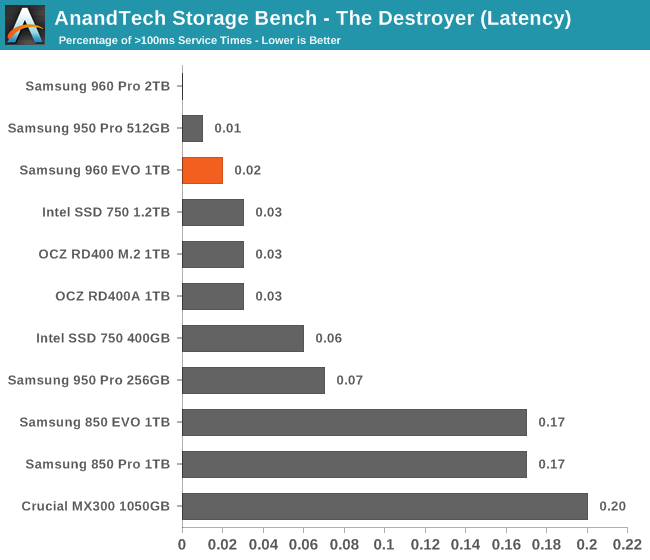
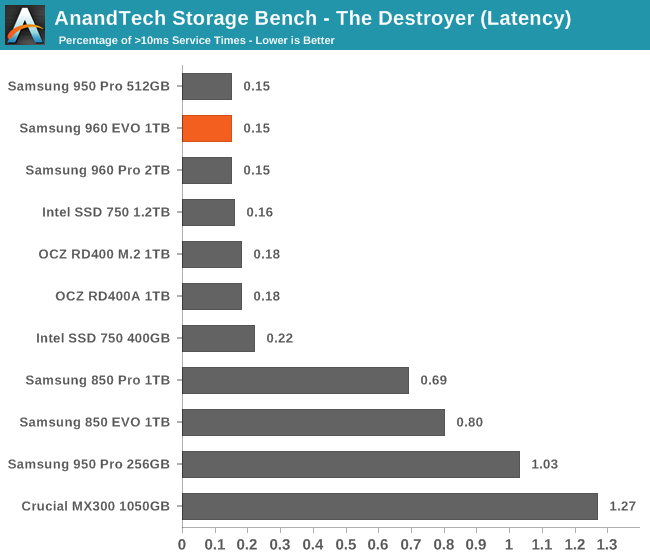
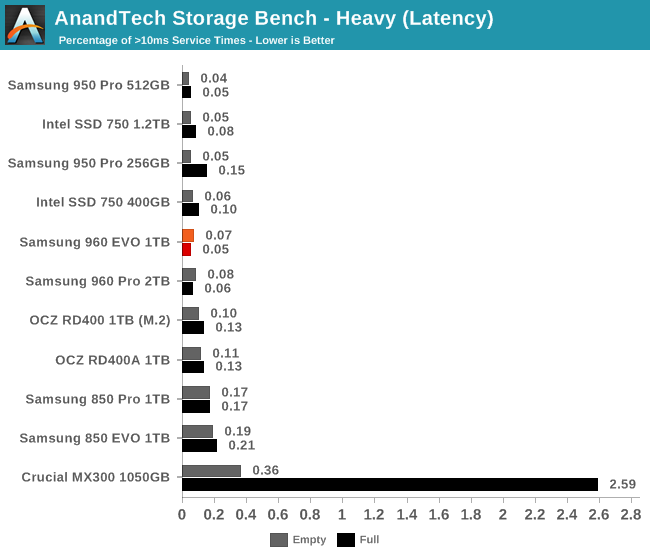
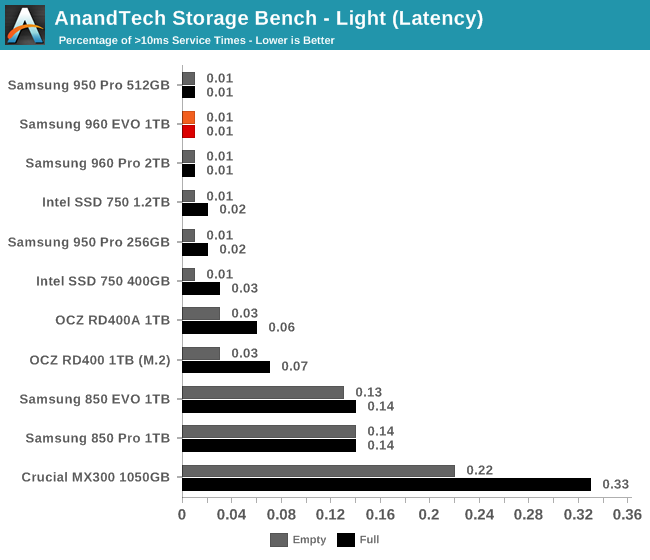
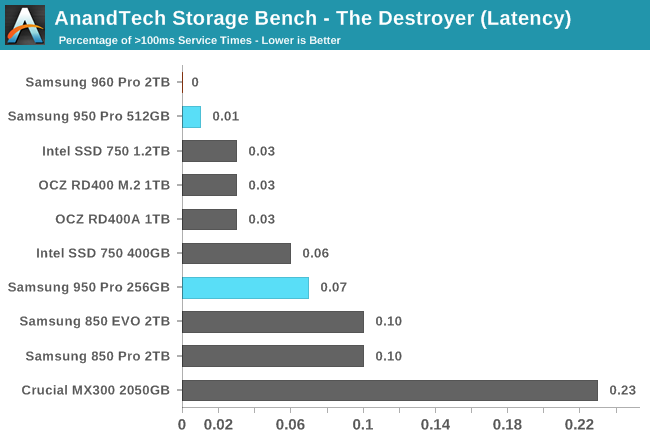
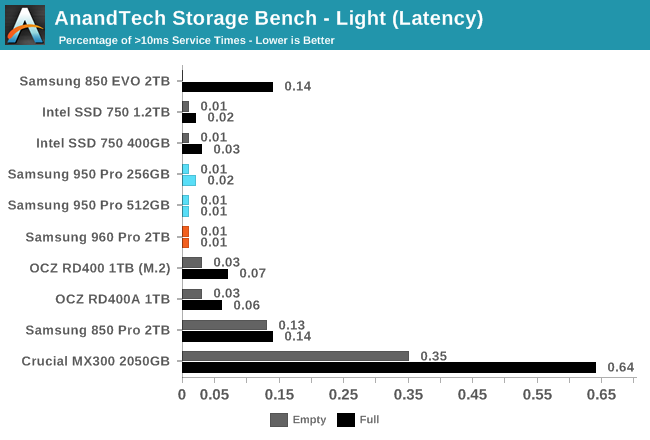
In the frequency of high-latency outliers, the 960 EVO is surpassed only by Samsung's 950 Pro and 960 Pro.
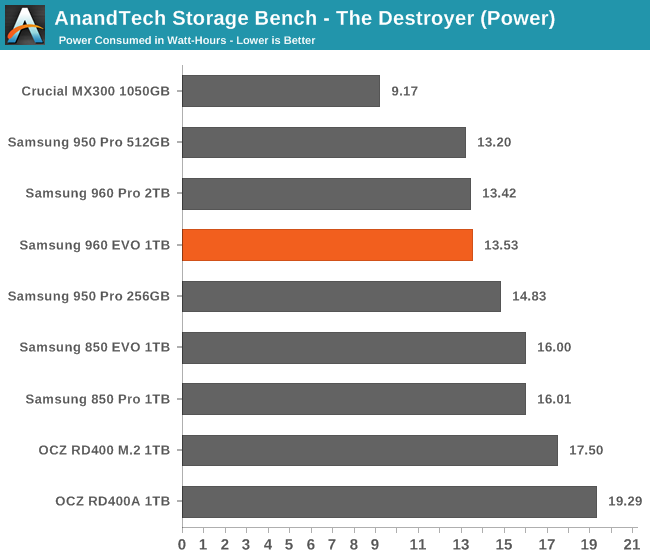
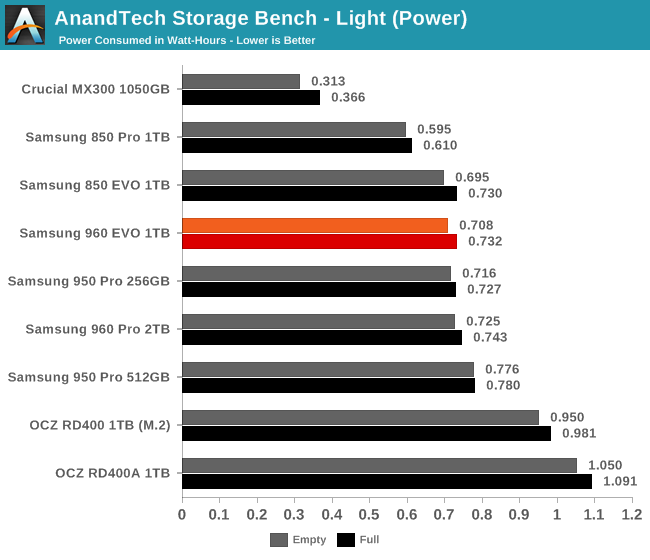
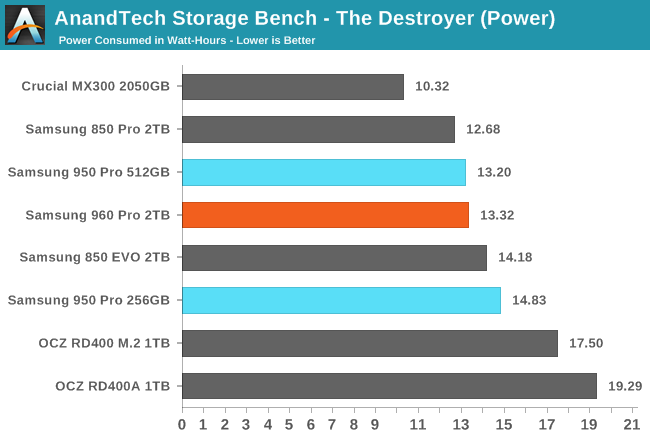
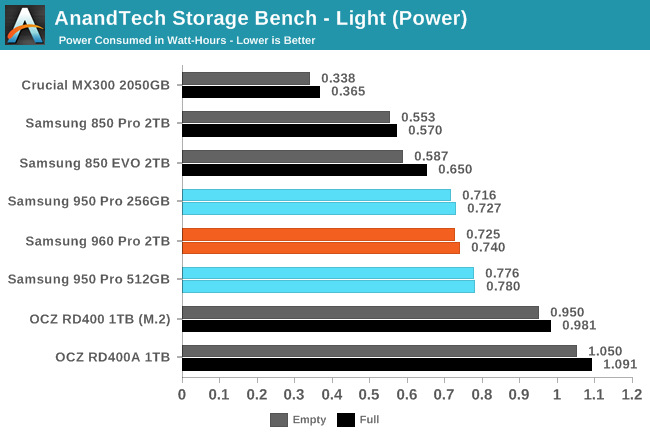
Despite using TLC NAND, the 960 EVO manages comparable power efficiency to the 960 Pro, putting it ahead of the fastest SATA drives but still drawing substantially more power than the most efficient SATA SSDs.
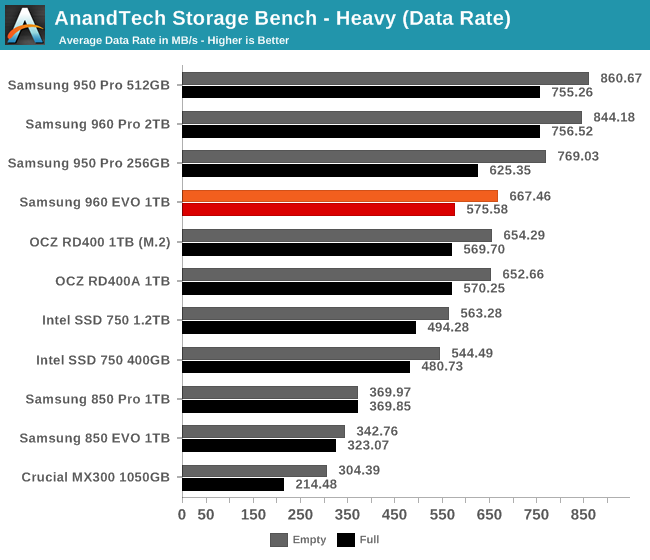
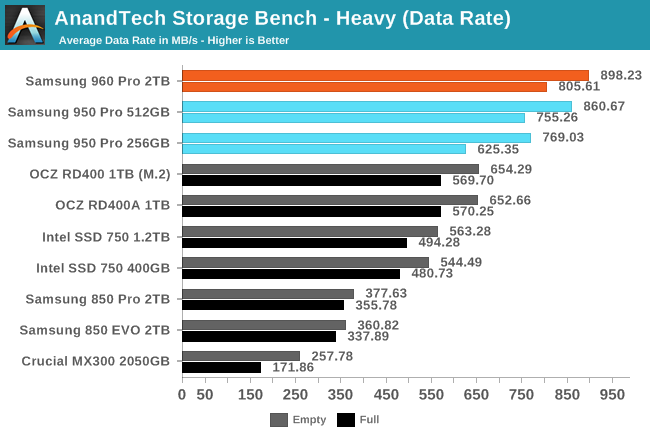
The 960 EVO's average data rates on the Heavy test are slower than the 950 Pro and 960 Pro, but on par with the OCZ RD400 and faster than the Intel 750.
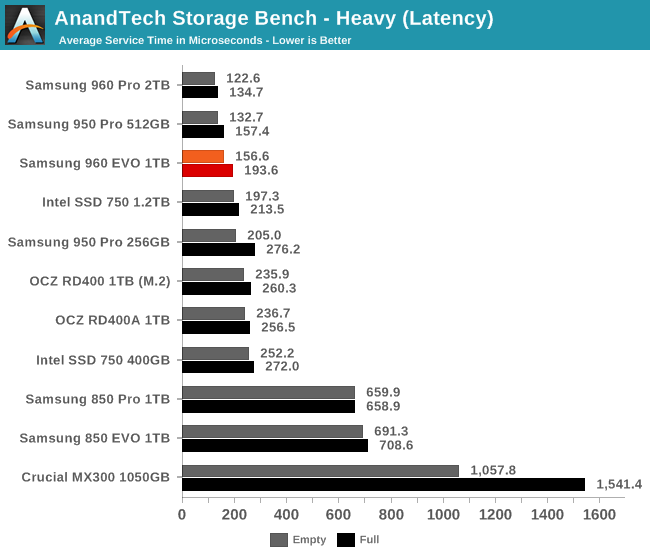
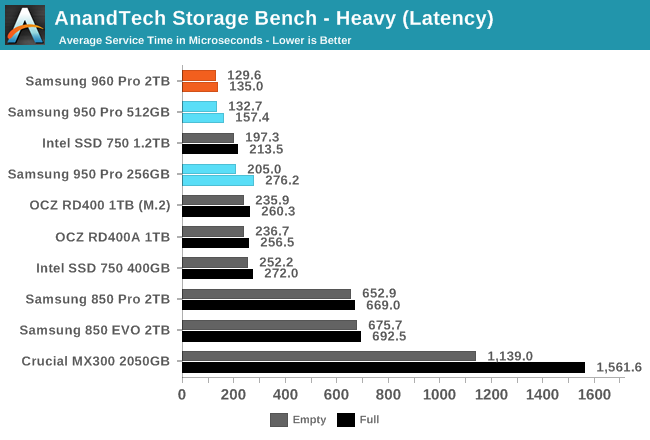
The 960 EVO takes third place for average service times, providing lower latency than the smallest 950 Pro despite slower overall data rates. In comparison to SATA SSDs, the latency differences are all pretty minor.
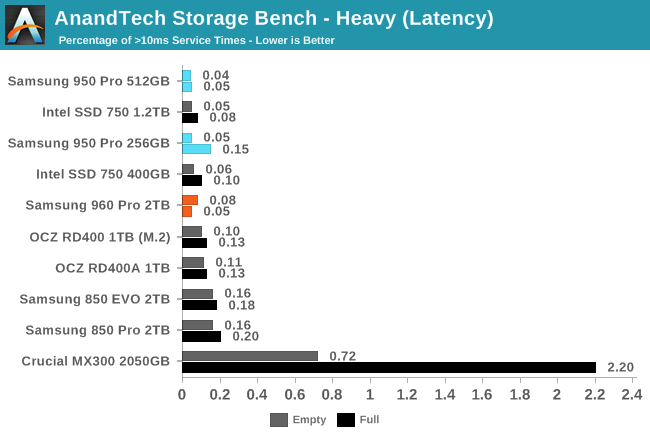
Like the 960 Pro, the 960 EVO oddly has slightly fewer high-latency outliers when this test is run on a full drive instead of a freshly-erased drive. In spite of this quirk of the drive's garbage collection routines, both drives have well-controlled latency.
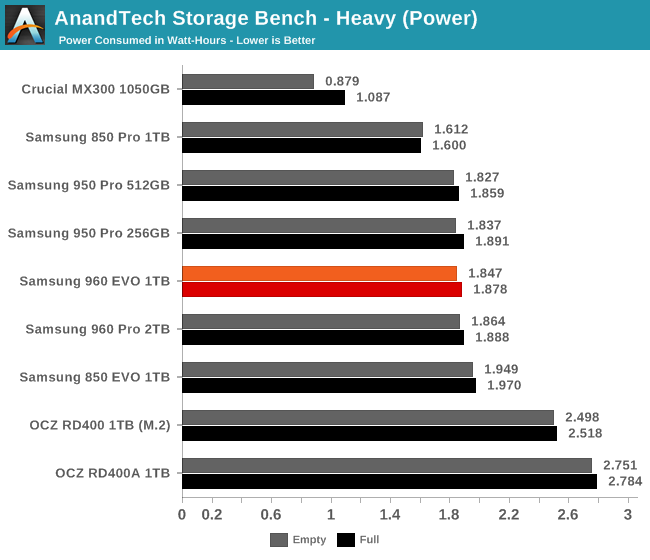
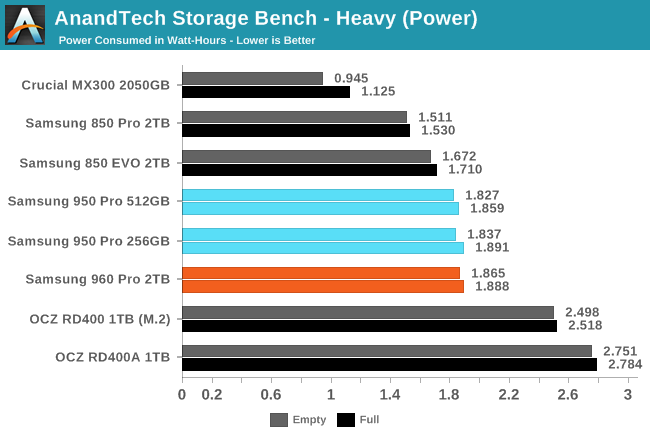
The 960 EVO's power efficiency on the Heavy test is virtually the same as the 960 Pro and the 950 Pro, and not significantly worse than the fastest SATA drives.
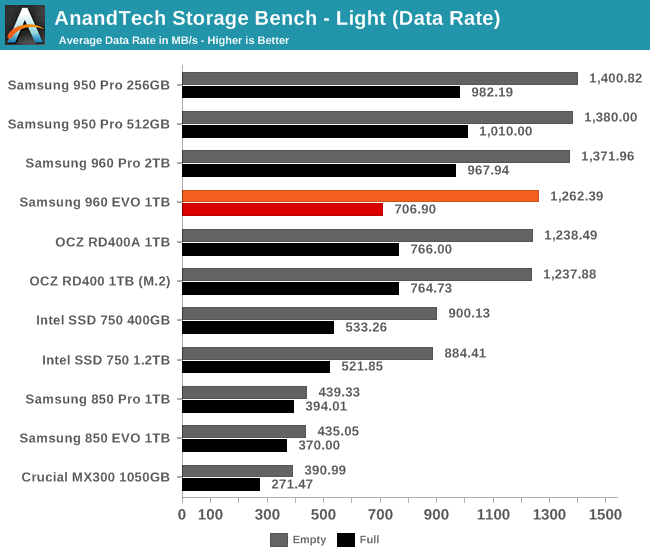
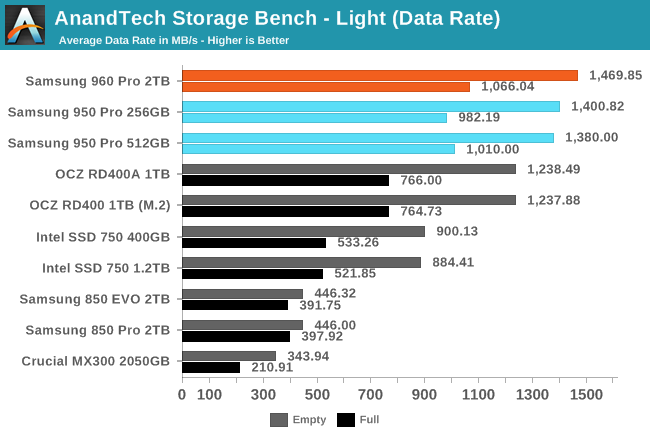
As with the previous ATSB tests, the 960 EVO can't quite keep pace with Samsung's MLC-based 950 Pro and 960 Pro SSDs, but it is slightly faster than the OCZ RD400. On this test the 960 EVO suffers relatively more from a full drive, where it falls behind the RD400.
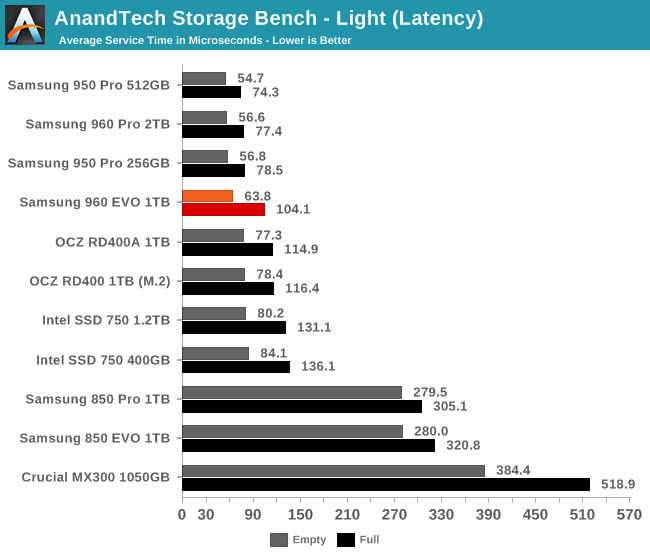
Average service times are slightly slower for the 960 EVO than Samsung's other PCIe SSDs, and the competing PCIe SSDs are a step further behind.
The 960 EVO is tied for first place with minimal high-latency outliers, but all of the PCIe SSDs are much better than the SATA drives.
Once again the 960 EVO's power efficiency is about the same as Samsung's other drives, showing that its higher instantaneous power draw than SATA drives is compensated by it completing the test quicker.
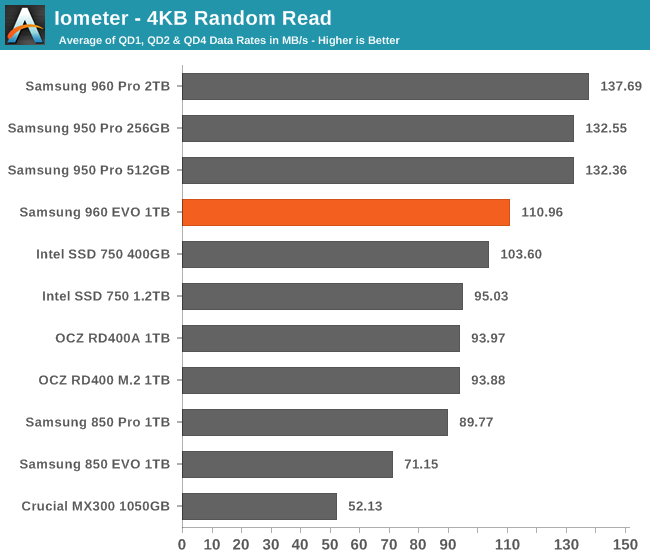
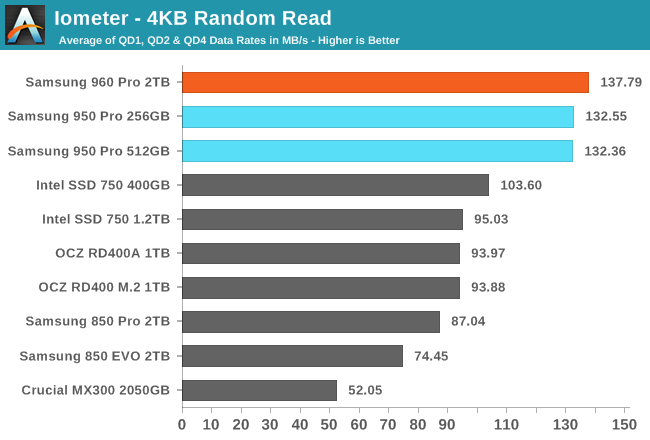
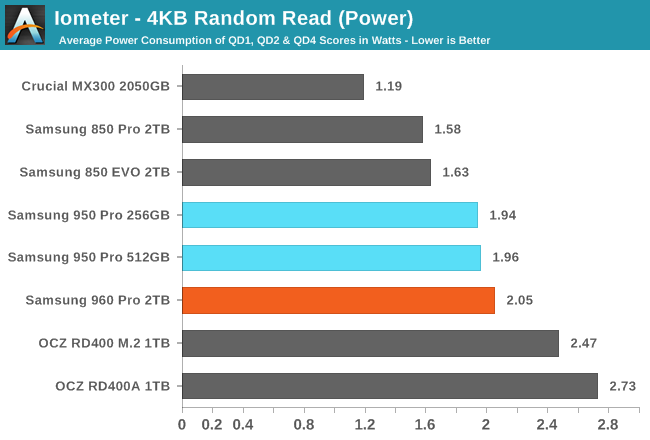
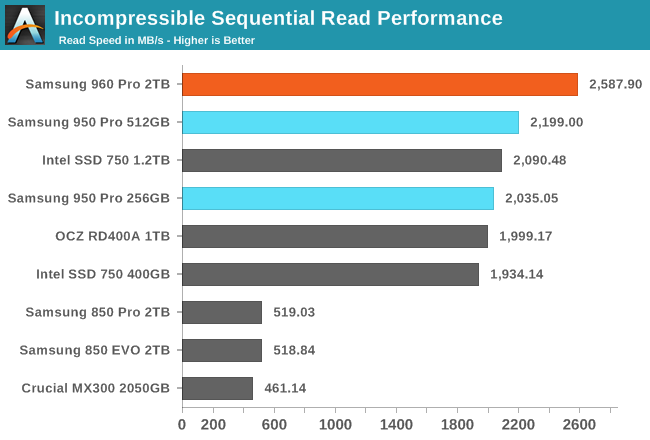
It is unsurprising to see that the TLC-based 960 EVO has slower random read speeds than the MLC-based 950 Pro and 960 Pro, but the 960 EVO still manages to be faster than all the non-Samsung drives.
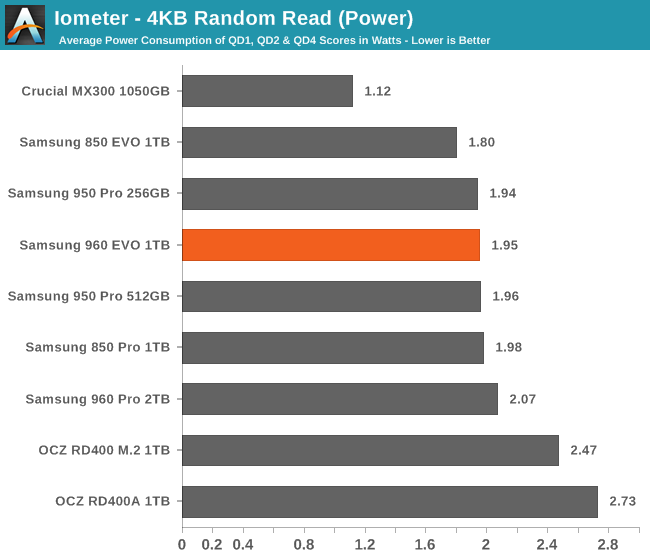
The 960 EVO's power consumption is essentially the same as Samsung's other drives, which puts it at an efficiency disadvantage to their MLC PCIe SSDs but more efficient than all the lower-performing drives.
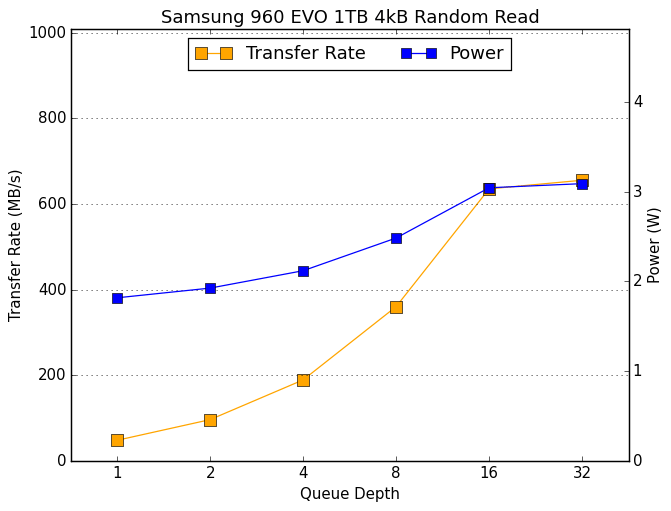 | |||||||||
| Samsung 960 EVO 1TBCrucial MX300 1050GBIntel SSD 750 1.2TBIntel SSD 750 400GBOCZ RD400 1TB (M.2)OCZ RD400A 1TBSamsung 850 EVO 1TBSamsung 850 Pro 1TBSamsung 950 Pro 256GBSamsung 950 Pro 512GBSamsung 960 Pro 2TB | |||||||||
As with Samsung's other SSDs, random read speed scales with queue depth until hitting a limit at QD16.
Random Write Performance
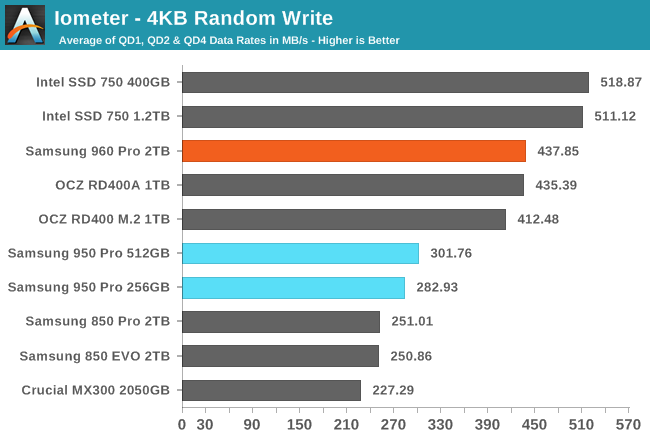
The random write test writes 4kB blocks and tests queue depths ranging from 1 to 32. The queue depth is doubled every three minutes, for a total test duration of 18 minutes. The test is limited to a 16GB portion of the drive, and the drive is empty save for the 16GB test file. The primary score we report is an average of performances at queue depths 1, 2 and 4, as client usage typically consists mostly of low queue depth operations.
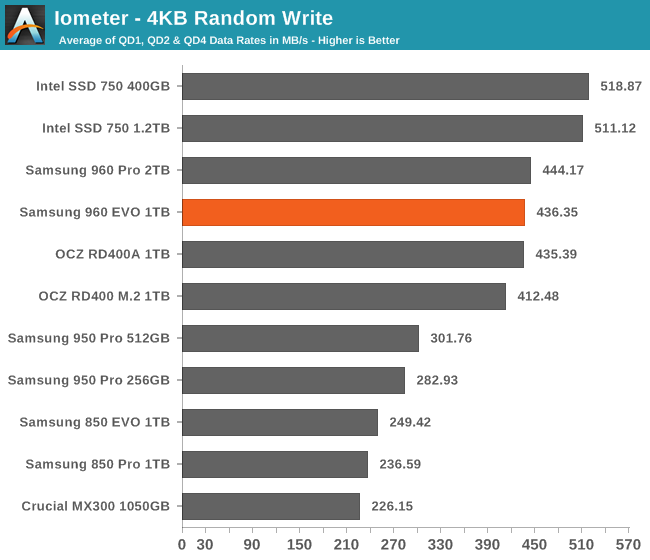
The Samsung 960 EVO's random write speed is essentially tied with the 960 Pro and the OCZ RD400A, while the Intel 750 holds on to a comfortable lead.
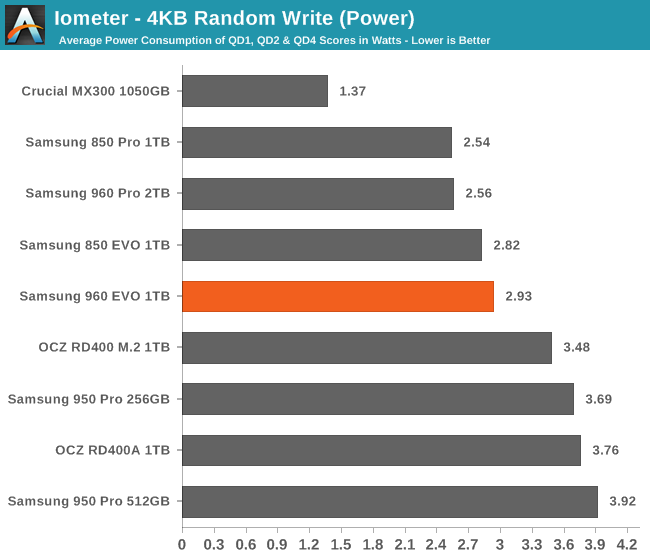
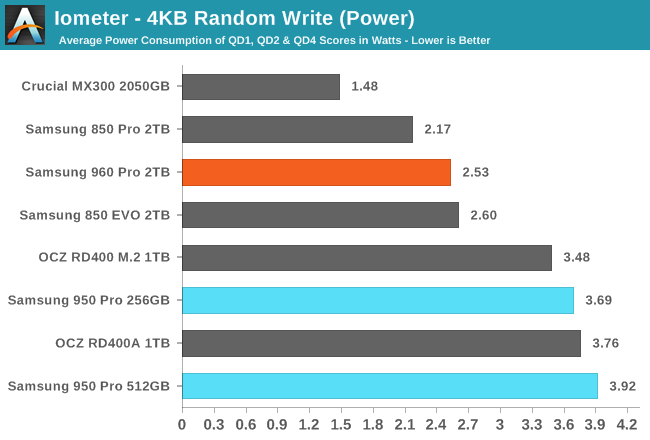
The 960 EVO is not as power efficient as the 960 Pro, but it is still far better than everything else.
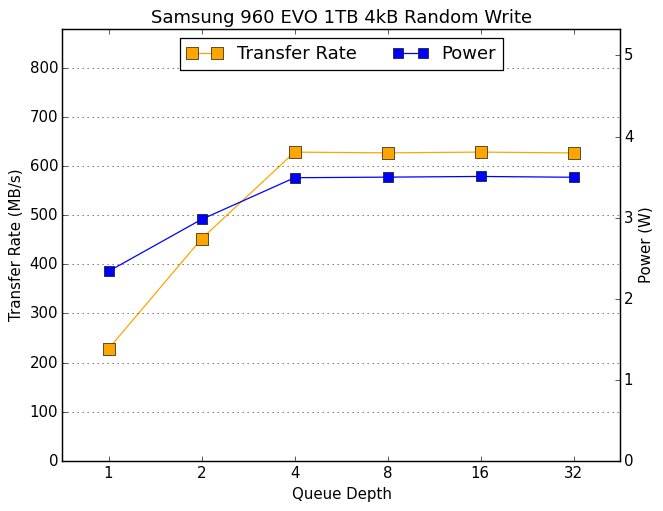 | |||||||||
| Samsung 960 EVO 1TBCrucial MX300 1050GBIntel SSD 750 1.2TBIntel SSD 750 400GBOCZ RD400 1TB (M.2)OCZ RD400A 1TBSamsung 850 EVO 1TBSamsung 850 Pro 1TBSamsung 950 Pro 256GBSamsung 950 Pro 512GBSamsung 960 Pro 2TB | |||||||||
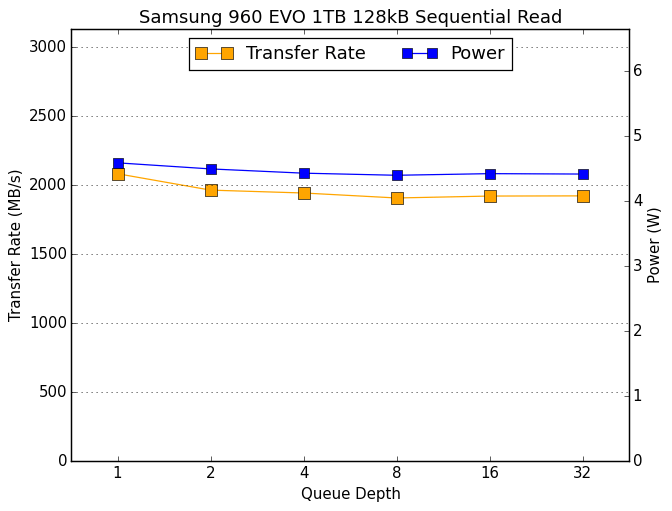
The scaling behavior of the 960 EVO is essentially the same as the 960 Pro: full performance is reached at QD4, and there's no indication of any severe thermal throttling.
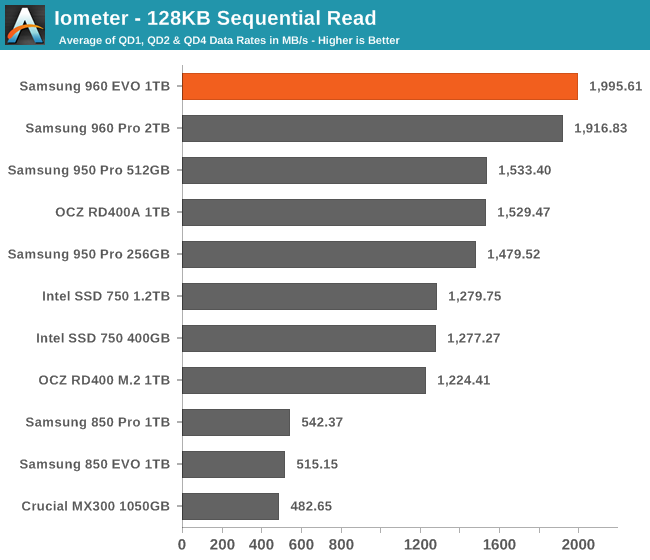
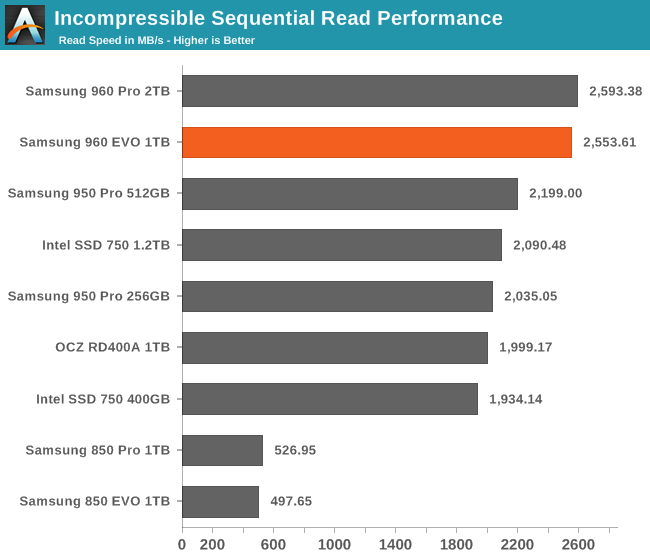
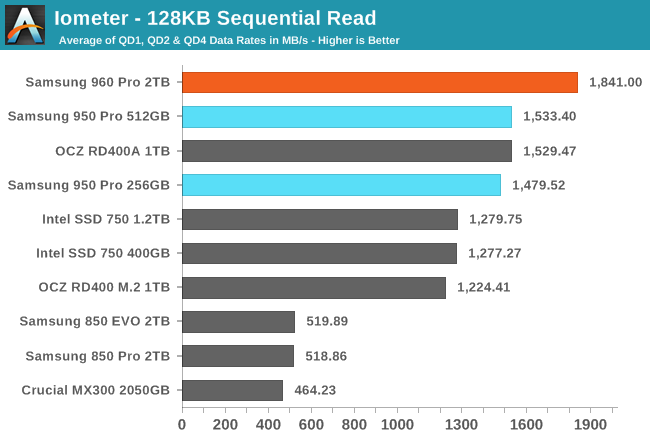
The 960 EVO provides slightly higher sustained sequential read speeds than the 960 Pro in a test where both are largely thermally limited. No other SSD comes close to offering this level of performance at low queue depths.
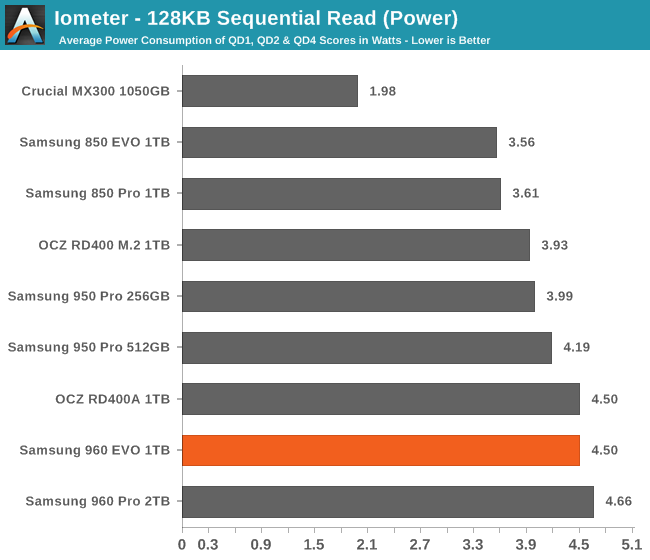
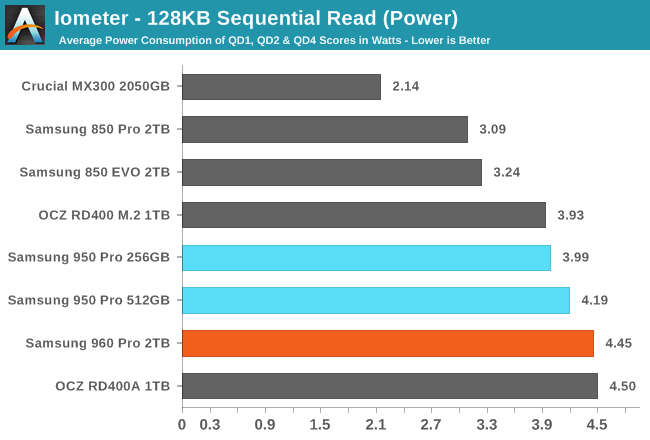
With power consumption slightly lower than the 960 Pro, the 960 EVO actually manages to set an efficiency record.
 | |||||||||
| Samsung 960 EVO 1TBCrucial MX300 1050GBIntel SSD 750 1.2TBIntel SSD 750 400GBOCZ RD400 1TB (M.2)OCZ RD400A 1TBSamsung 850 EVO 1TBSamsung 850 Pro 1TBSamsung 950 Pro 256GBSamsung 950 Pro 512GBSamsung 960 Pro 2TB | |||||||||
The competing drives that have large heatsinks can provide better performance at higher queue depths, but within the constraints of the M.2 form factor Samsung has a huge advantage.
Sequential Write Performance
The sequential write test writes 128kB blocks and tests queue depths ranging from 1 to 32. The queue depth is doubled every three minutes, for a total test duration of 18 minutes. The test spans the entire drive, and the drive is filled before the test begins. The primary score we report is an average of performances at queue depths 1, 2 and 4, as client usage typically consists mostly of low queue depth operations.
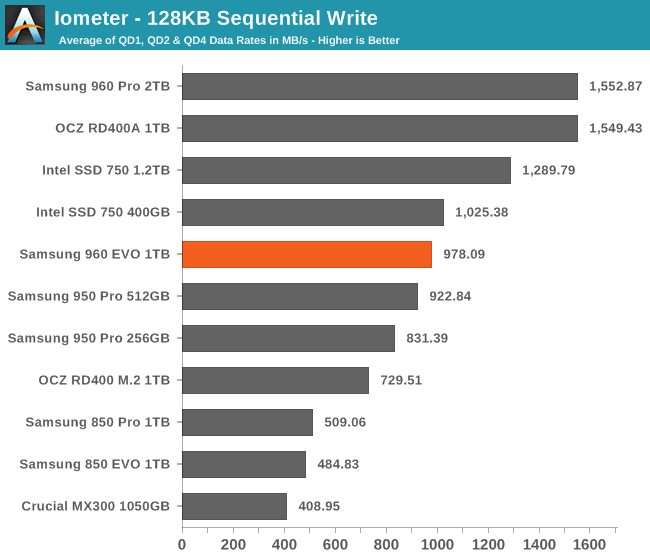
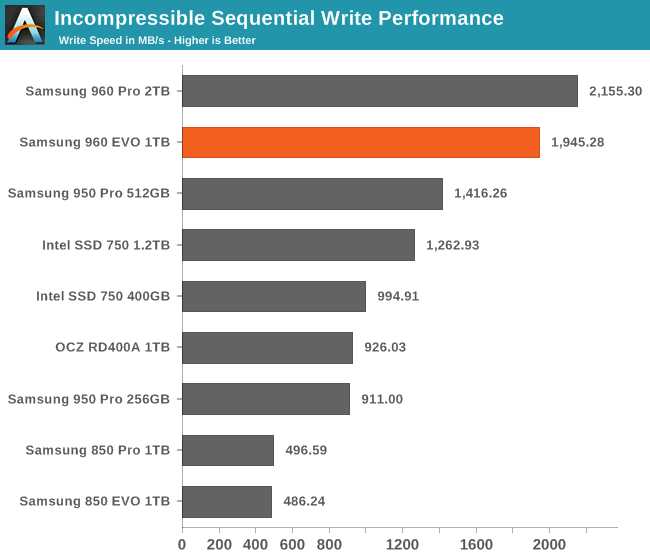
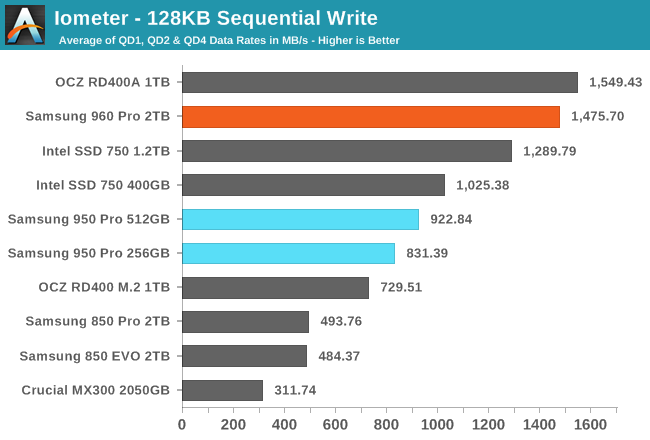
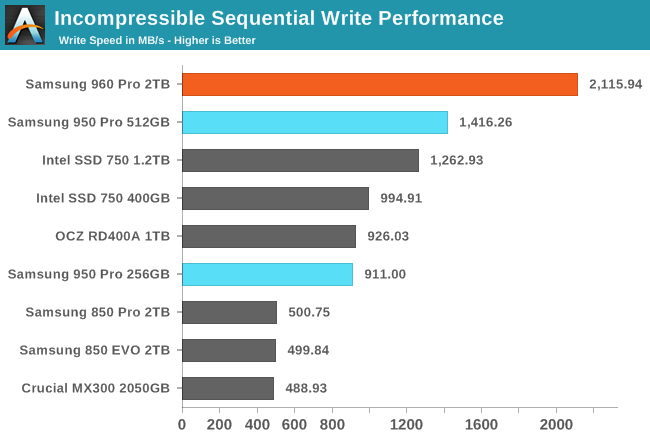
The sustained sequential write speed of the 960 EVO is far slower than the 960 Pro and several of the better-cooled competitors, but the 960 EVO is actually slightly faster than last year's 950 Pro.
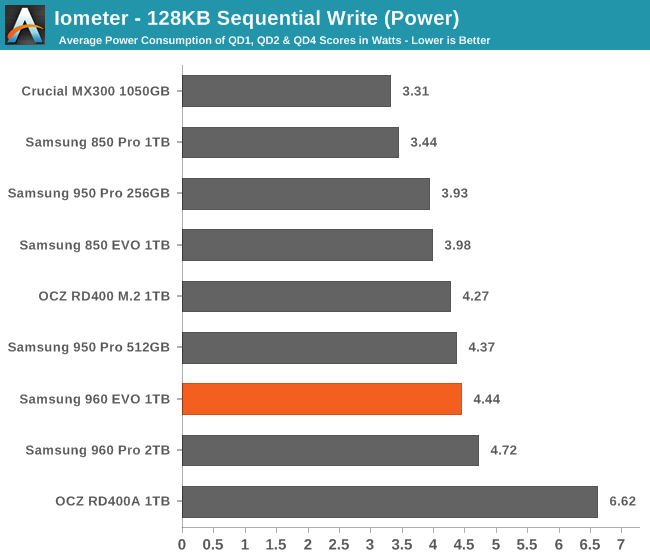
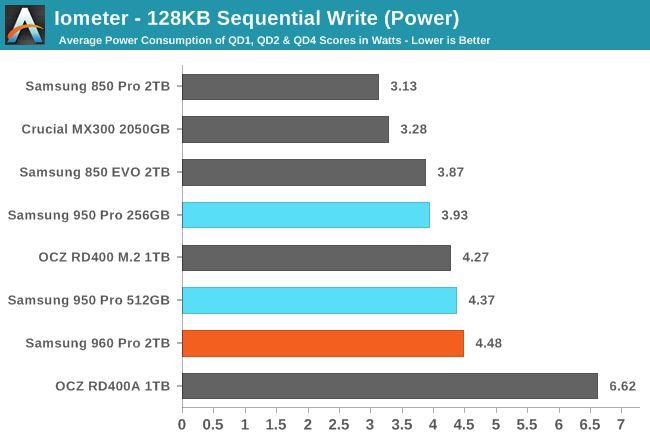
The 960 EVO doesn't break any records for power efficiency, but only because the 960 Pro exists. The MLC-based competition is less efficient than the TLC-based 960 EVO.
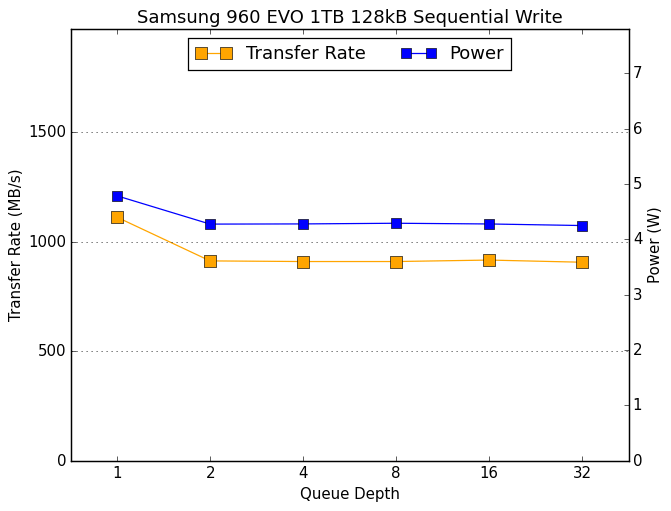 | |||||||||
| Samsung 960 EVO 1TBCrucial MX300 1050GBIntel SSD 750 1.2TBIntel SSD 750 400GBOCZ RD400 1TB (M.2)OCZ RD400A 1TBSamsung 850 EVO 1TBSamsung 850 Pro 1TBSamsung 950 Pro 256GBSamsung 950 Pro 512GBSamsung 960 Pro 2TB | |||||||||
For almost all of the sequential write speed test, the 960 EVO is thermally limited, but it is clearly able to do much more within that limit than the 950 Pro or OCZ RD400 could.
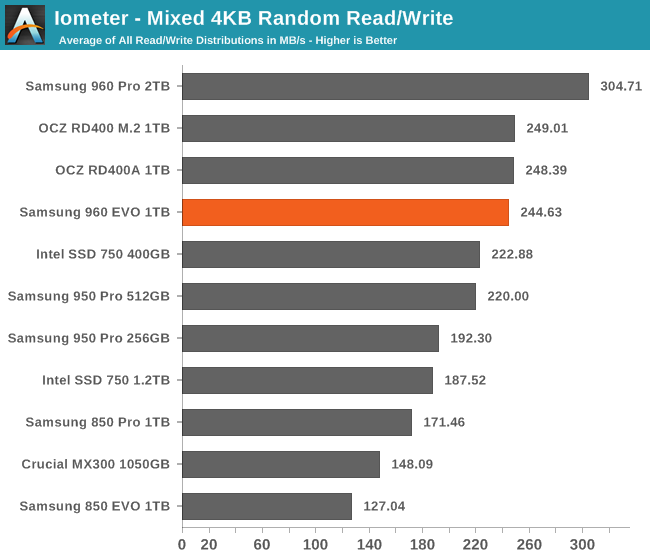
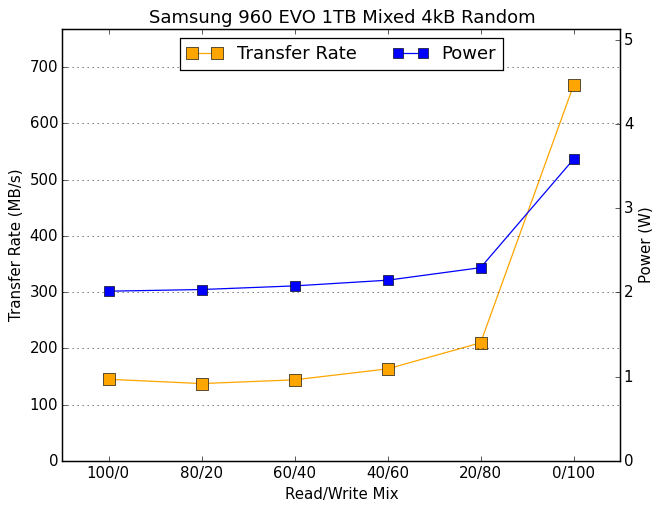
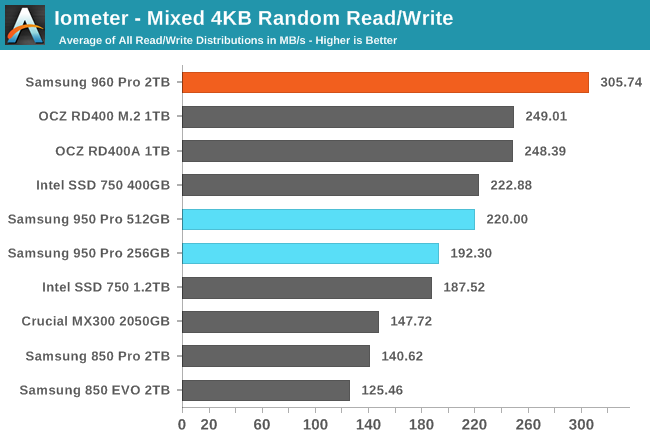
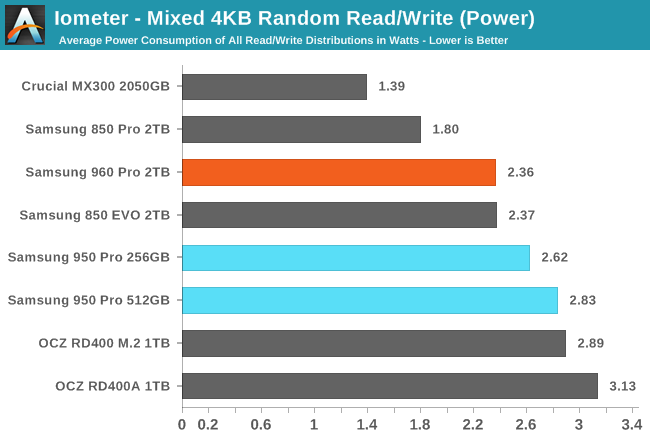
The 960 EVO is essentially tied for second place with the OCZ RD400 and significantly behind the 960 Pro in overall performance on mixed random I/O.
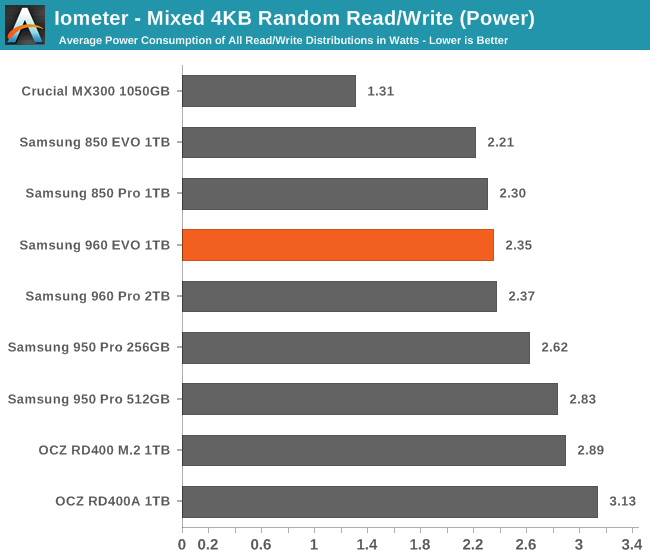
The 960 EVO's power efficiency on this test is not great, but it is a big improvement over last year's 950 Pro.
 | |||||||||
| Samsung 960 EVO 1TBCrucial MX300 1050GBIntel SSD 750 1.2TBIntel SSD 750 400GBOCZ RD400 1TB (M.2)OCZ RD400A 1TBSamsung 850 EVO 1TBSamsung 850 Pro 1TBSamsung 950 Pro 256GBSamsung 950 Pro 512GBSamsung 960 Pro 2TB | |||||||||
The 960 EVO's high performance score comes primarily from its great performance in the pure write final phase of the test. Throughout the rest of the test, the 960 EVO is not as fast as the 950 Pro.
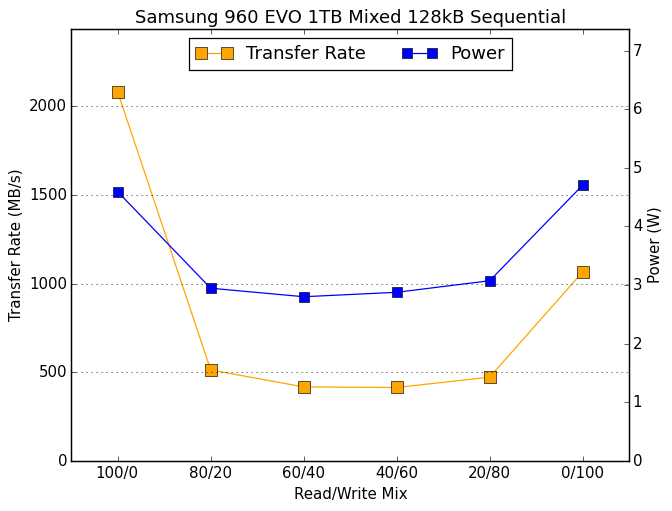
Mixed Sequential Read/Write Performance
The mixed sequential access test covers the entire span of the drive and uses a queue depth of one. It starts with a pure read test and gradually increases the proportion of writes, finishing with pure writes. Each subtest lasts for 3 minutes, for a total test duration of 18 minutes. The drive is filled before the test starts.
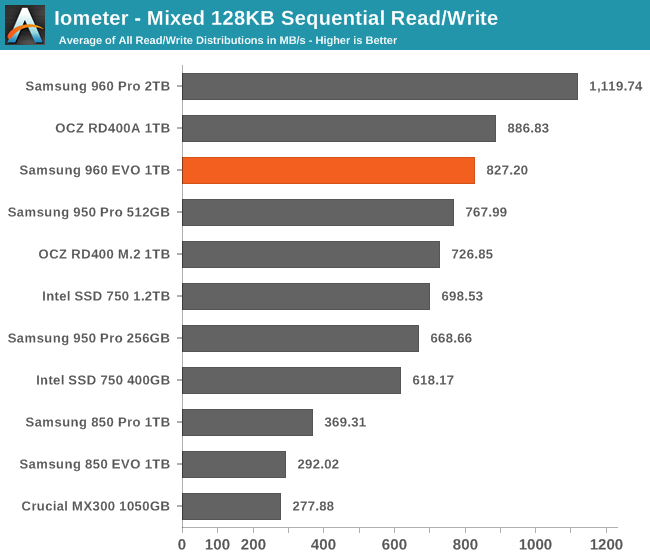
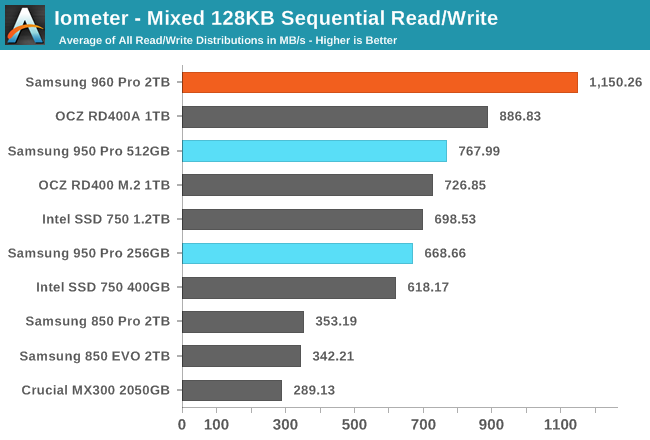
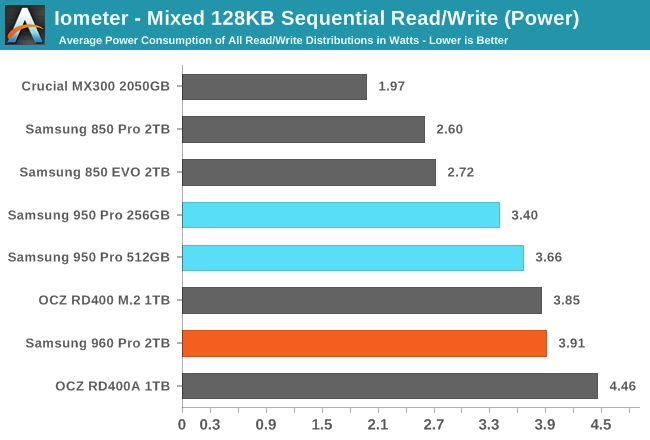
The 960 EVO's mixed sequential I/O performance is the second-fastest among M.2 SSDs and third place overall. Performance is modestly improved over the 950 Pro.
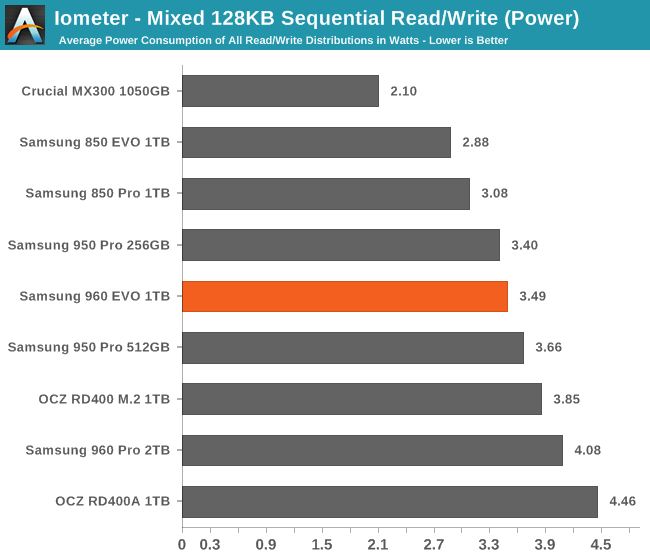
The 960 EVO's power efficiency is better than most PCIe SSDs, but still well behind the 960 Pro.
 | |||||||||
| Samsung 960 EVO 1TBCrucial MX300 1050GBIntel SSD 750 1.2TBIntel SSD 750 400GBOCZ RD400 1TB (M.2)OCZ RD400A 1TBSamsung 850 EVO 1TBSamsung 850 Pro 1TBSamsung 950 Pro 256GBSamsung 950 Pro 512GBSamsung 960 Pro 2TB | |||||||||
The 960 EVO's performance in the pure read first phase of the test is great, but its performance with an 80/20 mix is much worse than the 950 Pro or OCZ RD400. The worst-case performance is also not as good as the RD400 or 960 Pro.
Both AS-SSD sequential tests show that the 960 EVO's peak performance really is second only to the 960 Pro, even if in longer tests some other models are able to outperform the 960 EVO.
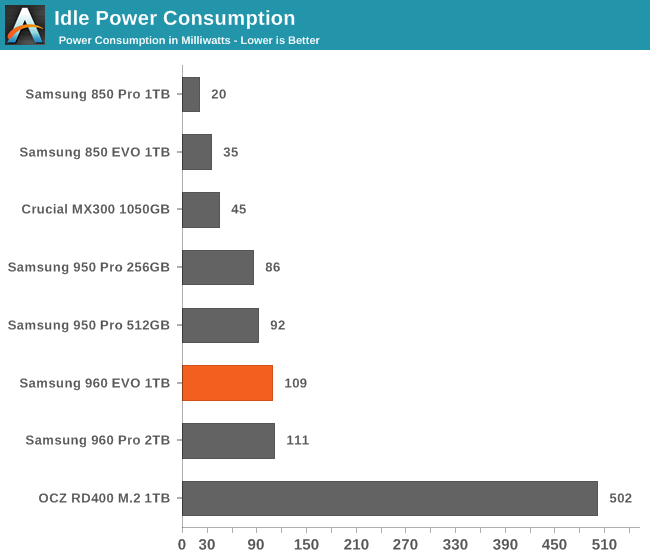
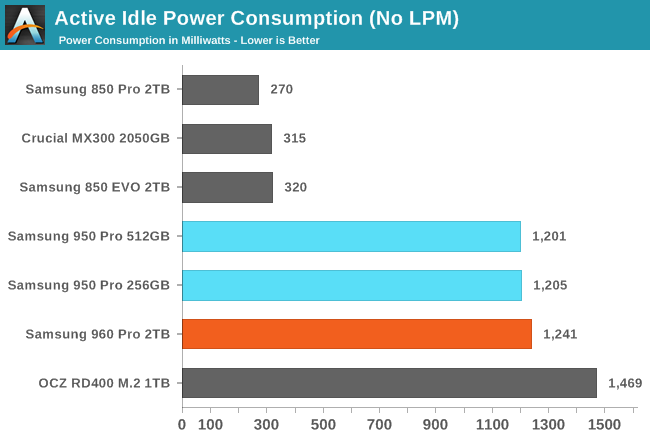
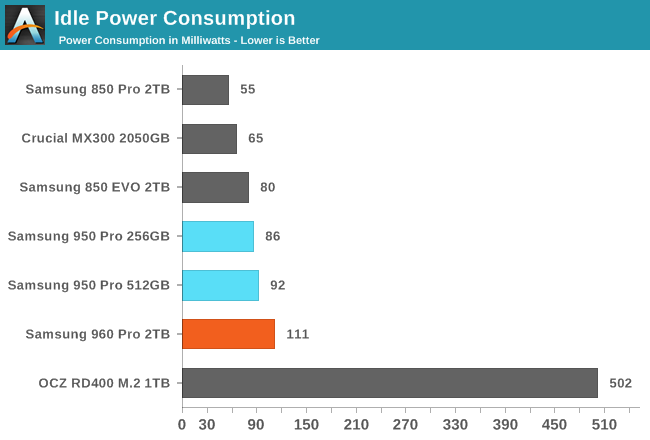
Idle Power Consumption
Since the ATSB tests based on real-world usage cut idle times short to 25ms, their power consumption scores paint an inaccurate picture of the relative suitability of drives for mobile use. During real-world client use, a solid state drive will spend far more time idle than actively processing commands. Our testbed doesn't support the deepest DevSlp power saving mode that SATA drives can implement, but we can measure the power usage in the intermediate slumber state where both the host and device ends of the SATA link enter a low-power state and the drive is free to engage its internal power savings measures.
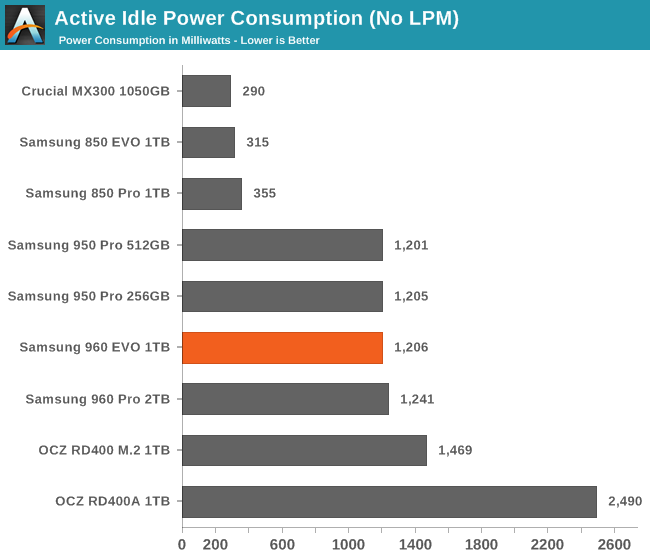
We also report the drive's idle power consumption while the SATA link is active and not in any power saving state. Drives are required to be able to wake from the slumber state in under 10 milliseconds, but that still leaves plenty of room for them to add latency to a burst of I/O. Because of this, many desktops default to either not using SATA Aggressive Link Power Management (ALPM) at all or to only enable it partially without making use of the device-initiated power management (DIPM) capability. Additionally, SATA Hot-Swap is incompatible with the use of DIPM, so our SSD testbed usually has DIPM turned off during performance testing.
'월드 벤치마크' 카테고리의 다른 글
| AMD 라데온 소프트웨어 크림슨 ReLive 에디션 테스트 (0) | 2016.12.09 |
|---|---|
| ADATA XPG SX8000 M.2 SSD 투입, 실력은? (0) | 2016.11.27 |
| 엔비디아 지포스GTX 1050/1050 Ti 발표, 성능은 어느정도? (0) | 2016.10.30 |
| 인텔 7세대 카비레이크 Core i5-7600K vs 6600K 성능 (0) | 2016.10.23 |
| 삼성 960 프로 NVMe M.2 SSD 성능확인 (2TB) (0) | 2016.10.21 |


%20SSD%20Review&txt=%3Cimg%20alt%3D%22%22%20src%3D%22http%3A%2F%2Fimages.anandtech.com%2Fdoci%2F10754%2FIMGP3007_575px.jpg%22%3E)
%20SSD%20Review&txt=%3Cimg%20alt%3D%22%22%20src%3D%22http%3A%2F%2Fimages.anandtech.com%2Fdoci%2F10754%2FIMGP2995_575px.jpg%22%3E)


%20Review&txt=%3Cimg%20alt%3D%22%22%20src%3D%22http%3A%2F%2Fimages.anandtech.com%2Fdoci%2F10559%2FDSC_4778_575px.jpg%22%3E)
%20Review&txt=%3Cimg%20alt%3D%22%22%20src%3D%22http%3A%2F%2Fimages.anandtech.com%2Fdoci%2F10559%2FDSC_4785_575px.jpg%22%3E)
%20Review&txt=%3Cimg%20alt%3D%22%22%20src%3D%22http%3A%2F%2Fimages.anandtech.com%2Fdoci%2F10559%2FDSC_4804_575px.jpg%22%3E)
%20Review&txt=%3Cimg%20alt%3D%22%22%20src%3D%22http%3A%2F%2Fimages.anandtech.com%2Fdoci%2F10559%2FDSC_4780_575px.jpg%22%3E)
%20Review&txt=%3Cimg%20alt%3D%22%22%20src%3D%22http%3A%2F%2Fimages.anandtech.com%2Fdoci%2F10559%2FWIN_20160815_19_11_28_Pro_575px.jpg%22%3E)