'월드 벤치마크'에 해당되는 글 109건

  1. 2016.06.30 3D NAND 탑재, 마이크론 크루셜 MX300 750GB SSD 리뷰 by 랩터 인터내셔널
  2. 2016.06.30 AMD 라데온RX 480 성능 vs GTX 970 by 랩터 인터내셔널
  3. 2016.06.07 지포스GTX 1070 성능 by 랩터 인터내셔널
  4. 2016.05.18 지포스GTX 1080 성능 vs 980TI 비교 by 랩터 인터내셔널
  5. 2016.04.11 인텔 제온E5 V4 리뷰 by 랩터 인터내셔널
  6. 2016.03.02 도시바 Q300 SSD 성능 (The Toshiba Q300 SSD Review) by 랩터 인터내셔널
  7. 2016.03.02 화웨이 메이트8 CPU,GPU,스토리지 성능 (기린950) by 랩터 인터내셔널
  8. 2016.03.02 인텔 컴퓨트 스틱 리뷰 (체리트레일 Z8300) by 랩터 인터내셔널
  9. 2016.03.02 마이크론 BX200 SSD 리뷰 (480GB & 960GB) by 랩터 인터내셔널
  10. 2015.12.03 AMD 라데온R9 380X 성능 by 랩터 인터내셔널


Advanced Features

  • Dynamic write acceleration
  • Redundant Array of Independent NAND (RAIN)
  • Multistep data integrity algorithm
  • Adaptive thermal protection
  • Power-loss protection
  • Data path protection
  • Active garbage collection
  • TRIM support
  • Self-Monitoring and Reporting Technology (SMART)
  • LDPC Error Correction Code (ECC)
  • Device sleep support
  • AES 256-bit hardware encryption (TCG Opal 2.0 and IEEE-1667-compliant)


크루셜 MX300은 컨트롤러에 Marvell 88SS1074 4-Channel "Dean", 디램은 1GB LPDDR3 1333MHz, 낸드는 마이크론의 32단 3D TLC 384Gbit 칩을 탑재 합니다.


제품의 시퀀셜 읽기/쓰기 성능은 각각 530 MB/s -  510 MB/s입니다. 그외 스펙은,


Random Read : 92,000 IOPS

Random Write : 83,000 IOPS
Endurance : 220 TBW (120GB Per Day For 5 Years)
Warranty : 3 Years


출처 - http://www.tomshardware.com

반응형
Posted by 랩터 인터내셔널


화제의 AMD 라데온 신형 RX 480 벤치마크


AMD Radeon GPU Specification Comparison
 AMD Radeon RX 480 (8GB)AMD Radeon RX 480 (4GB)AMD Radeon R9 390AMD Radeon R9 380
Stream Processors2304
(36 CUs)
2560
(40 CUs)
1792
(28 CUs)
Texture Units144160112
ROPs326432
Base Clock1120MHzN/AN/A
Boost Clock1266MHz1000MHz970MHz
Memory Clock7-8 Gbps GDDR57Gbps GDDR55Gbps GDDR55.5Gbps GDDR5
Memory Bus Width256-bit512-bit256-bit
VRAM8GB4GB8GB2GB
Transistor Count5.7B6.2B5.0B
Typical Board Power150W275W190W
Manufacturing ProcessGloFo 14nm FinFETTSMC 28nmTSMC 28nm
ArchitectureGCN 4GCN 1.1GCN 1.2
GPUPolaris 10HawaiiTonga
Launch Date06/29/1606/18/1506/18/15
Launch Price$239$199$329$199


AMD 라데온RX 480은 비디오 메모리 4GB 모델과 8GB 모델로 구분되며 나머지는 공통 스펙


36CU, 144텍스처, 32ROP, 1120MHz 베이스 클럭, 1266MHz 부스트 클럭, 7-8 Gbps GDDR5 메모리 및 클럭, 256비트 메모리 버스 위스, 5.7B 트랜지스터, TDP 150W, GPU 제조는 글로벌 파운드리의 14나노 공정, 가격은 8GB 모델이 239달러, 4GB 모델이 199달러, 레퍼런스 공식 판매 시작


AMD 라데온RX 480 = 폴라리스 10 아키텍처


AMD Radeon RX480 Memory Bandwidth
 AMD Radeon RX 480 8GB ReferenceAMD Radeon RX 480 4GB ReferenceAMD Radeon RX 480 Min Requirements
Memory Clock8Gbps GDDR57Gbps GDDR57Gbps GDDR5
Memory Bus Width256-bit256-bit256-bit
Total Mem Bandwidth256GB/sec224GB/sec224GB/sec
VRAM8GB4GB4/8GB


AMD 라데온RX 480 메모리 밴드 위스


8GB 레퍼런스 : 8Gbps GDDR5 / 256비트 / 256GB/sec

4GB 레퍼런스 : 7Gbps GDDR5 / 256비트 / 224GB/sec


카드 길이 : 9.5인치, 블로워 타입 쿨링


Summer 2016 GPU Pricing Comparison
AMDPriceNVIDIA
 $659GeForce GTX 1080
 $429GeForce GTX 1070
Radeon R9 390X$329 
 $259GeForce GTX 970
Radeon RX 480 (8GB)$239 
Radeon RX 480 (4GB)$199 


GPU 가격에 따른 AMD / 엔비디아 라인업 비교, 라데온 480은 지포스 970보다 저렴한 가격


AMD의 GPU 로드맵. 폴라리스 이후에는 HBM2 메모리가 탑재되는 베가(VEGA) 등장 예정


[ 게이밍 성능 테스트 시작 ]


Rise of the Tomb Raider - 2560x1440 - Very High Quality (DX11)

Rise of the Tomb Raider - 1920x1080 - Very High Quality (DX11)

Dirt Rally - 2560x1440 - Ultra Quality

Dirt Rally - 1920x1080 - Ultra Quality

Ashes of the Singularity - 2560x1440 - Extreme Quality (DX12)

Ashes of the Singularity - 1920x1080 - Extreme Quality (DX12)

Battlefield 4 - 2560x1440 - Ultra Quality

Battlefield 4 - 1920x1080 - Ultra Quality

Crysis 3 - 2560x1440 - Very High Quality + FXAA

Crysis 3 - 1920x1080 - Very High Quality + FXAA


The Witcher 3 - 2560x1440 - Ultra Quality (No Hairworks)

The Witcher 3 - 1920x1080 - Ultra Quality (No Hairworks)

The Division - 2560x1440 - Ultra Quality

The Division - 1920x1080 - Ultra Quality

Grand Theft Auto V - 2560x1440 - Very High Quality

Grand Theft Auto V - 1920x1080 - Very High Quality

Grand Theft Auto V - 99th Percentile Framerate - 2560x1440 - Very High Quality

Grand Theft Auto V - 99th Percentile Framerate - 1920x1080 - Very High Quality


Hitman - 2560x1440 - Ultra Quality (DX11)

Hitman - 1920x1080 - Ultra Quality (DX11)

Hitman - 2560x1440 - Ultra Quality (DX12)

Hitman - 1920x1080 - Ultra Quality (DX12)


[ 전력소모 / 온도 / 소음 ]


Idle Power Consumption


Load Power Consumption - Crysis 3


Idle GPU Temperature

Moving on to idle GPU temperatures, there’s little to remark on. At 31C, the RX 480’s blower based design is consistent with the other cards in our lineup.

Load GPU Temperature - FurMark

Load GPU Temperature - Crysis 3

Meanwhile with load temperatures, we get to see the full impact of AMD’s new WattMan power management technology. The RX 480 has a temperature target of 80C, and it dutifully ramps up the fan to ensure it doesn’t exceed that temperature.

Idle Noise Levels

With idle noise levels RX 480 once again posts a good result. At 37.8dB, it’s in good company, only meaningfully trailing cards that idle silently due to their respective zero fan speed idle implementations.

Load Noise Levels - FurMark

Load Noise Levels - Crysis 3


출처 - http://www.anandtech.com


AMD 라데온RX 480 요약 (8GB 모델 기준)

성능 : 엔비디아 지포스GTX 970과 엎치락 뒤치락

전력소모 : 지포스GTX 970 대비 12와트 적게 소모

온도 : 지포스GTX 1070과 동급

소음 : 라데온 280급

반응형
Posted by 랩터 인터내셔널


Nvidia GeForce GTX 1070 Founders Edition                

PCWorld Rating

Meet the new people's champion. The Nvidia GeForce GTX 1070 delivers more performance than the $1000 Titan X for a fraction of the cost and a fraction of the power.


화제의 파스칼 아키텍처 기반 최상위 1080에 이은 1070 모델의 www.pcworld.com 의 벤치마크 자료 입니다.


지포스GTX 1070은 3개의 그래픽스 프로세싱 클러스터로 구성됩니다. 세부적으로 1920 쿠다코어, 120 텍스처 유닛, 64 ROP, 256비트 메모리 인터페이스에 GDDR5 8GB 탑재 됩니다.


기본클럭은 1506MHz, 부스트 클럭 1683MHz, 메모리 클럭 4006MHz로 8핀 보조전원 한개 구성이며 TDP는 150와트 입니다.


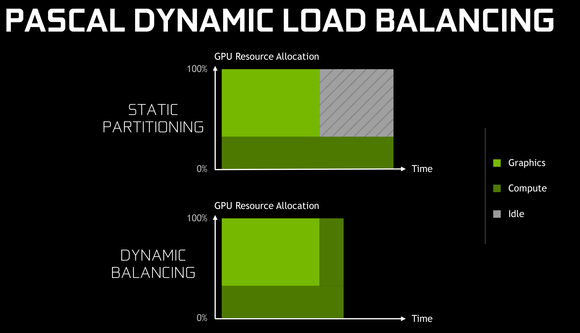
pascal dynamic load balancing


파스칼 아키텍처의 새로운 다이나믹 로드 밸런싱 기술은 부하량에 따라 GPU 자원을 최적의 효율성으로 사용합니다.


= 벤치마크 테스트 시스템 구성

Intel’s Core i7-5960X with a Corsair Hydro Series H100i closed-loop water cooler, to eliminate any potential for CPU bottlenecks affecting graphical benchmarksAn Asus X99 Deluxe motherboardCorsair’s Vengeance LPX DDR4 memory, Obsidian 750D full-tower case, and 1,200-watt AX1200i power supplyA 480GB Intel 730 series SSD Windows 10 Pro


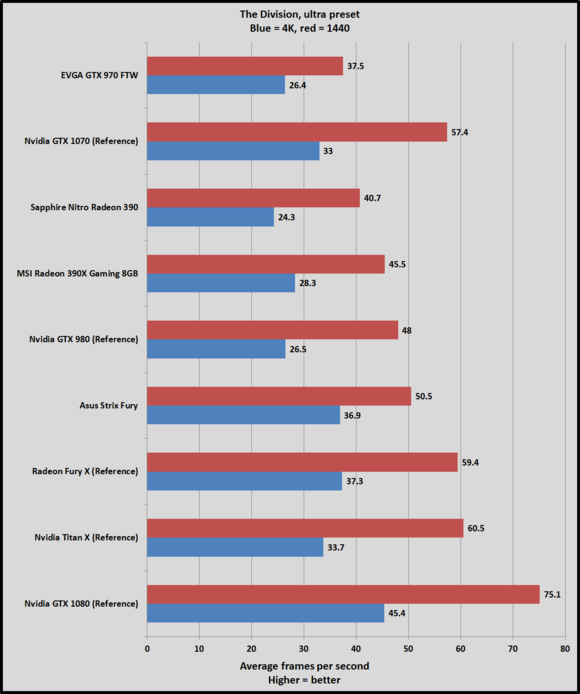
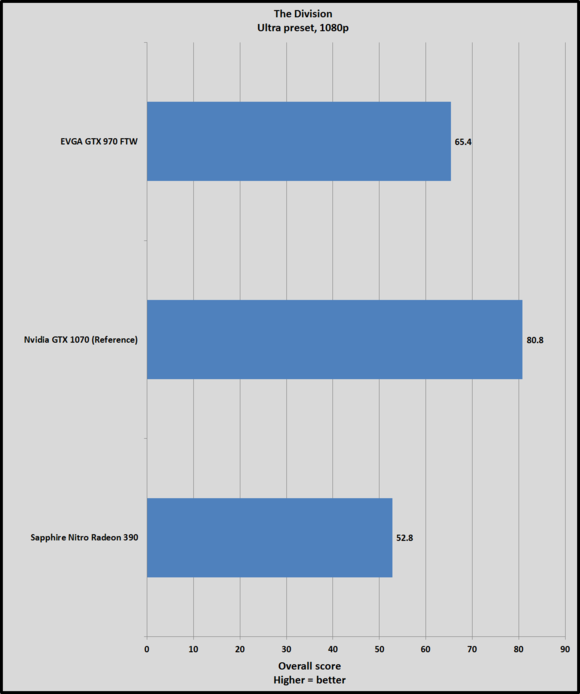
The Division


gtx 1070 division

gtx 1070 divisoin 1080


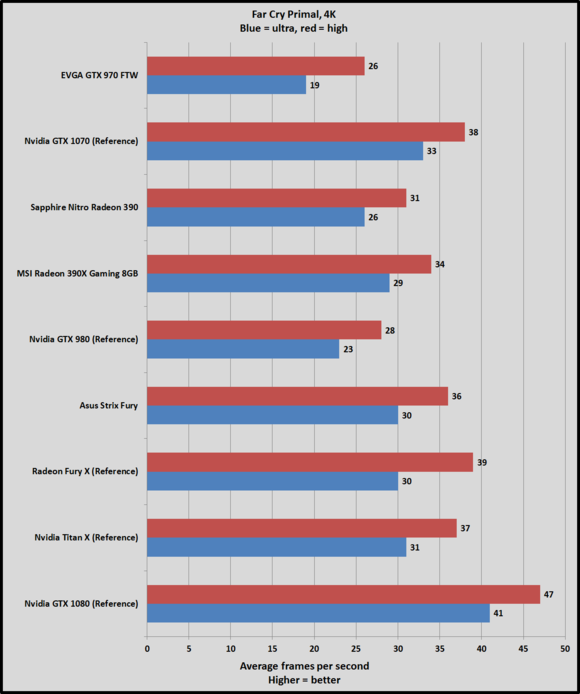
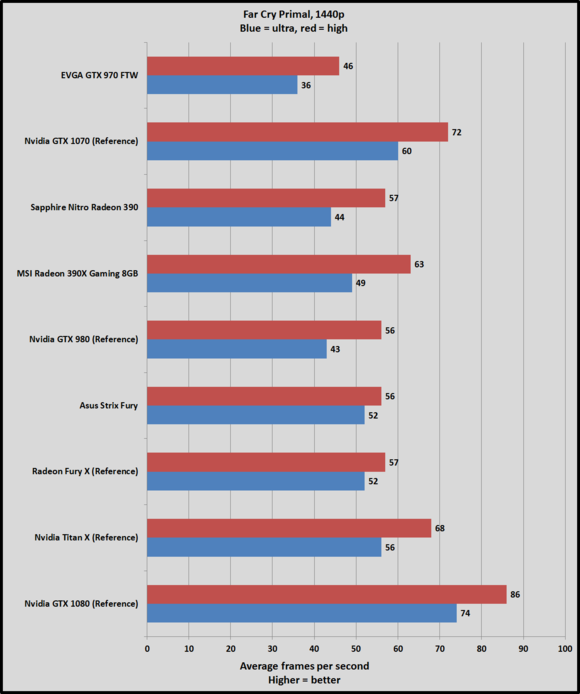
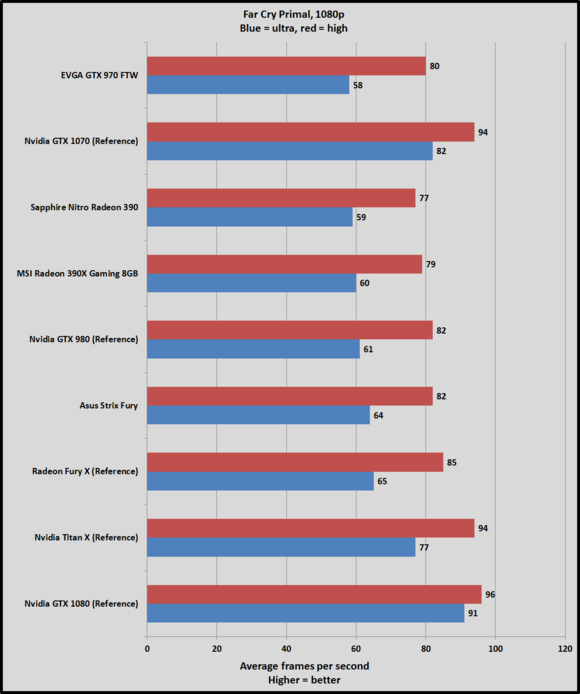
Far Cry Primal


gtx 1070 fc 4k

gtx 1070 fc 1440

gtx 1070 fc 1080


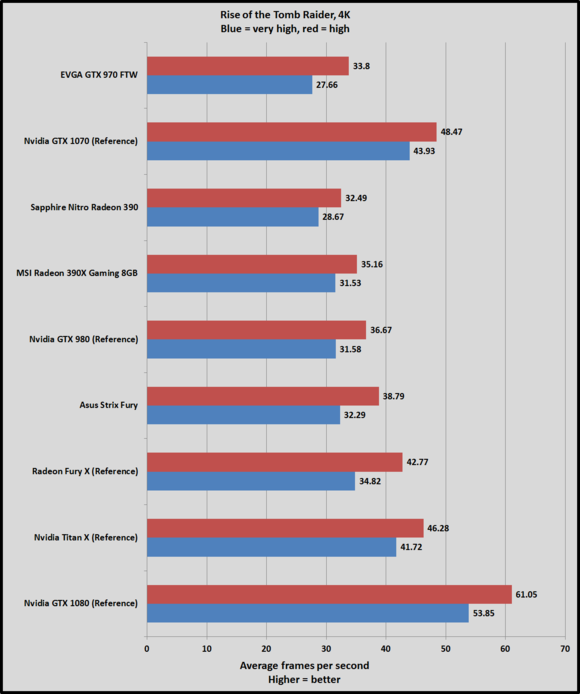
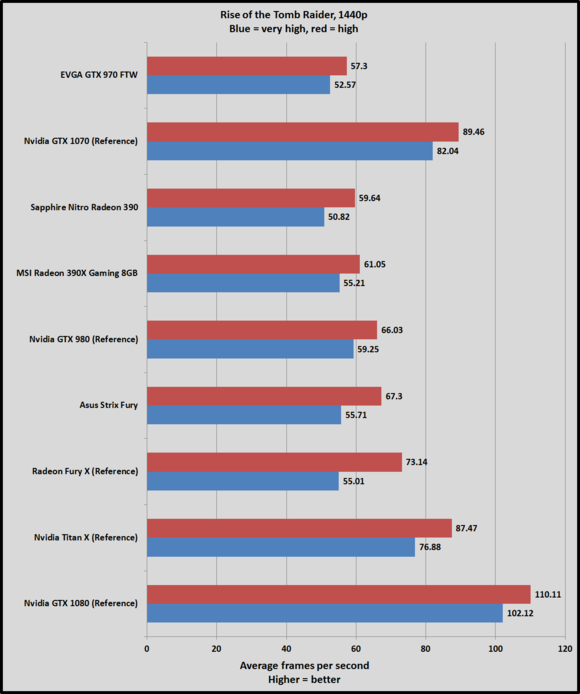
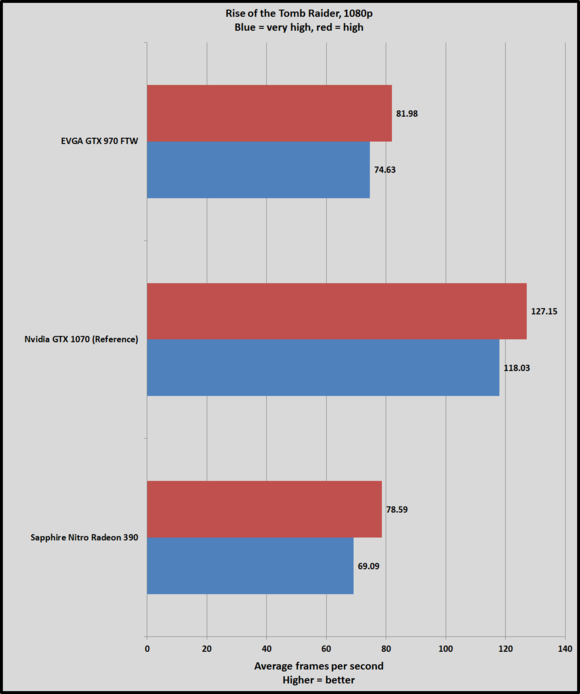
Rise of the Tomb Raider


gtx 1070 rotr 4k

gtx 1070 rotr 1440

gtx 1070 rotr 1080


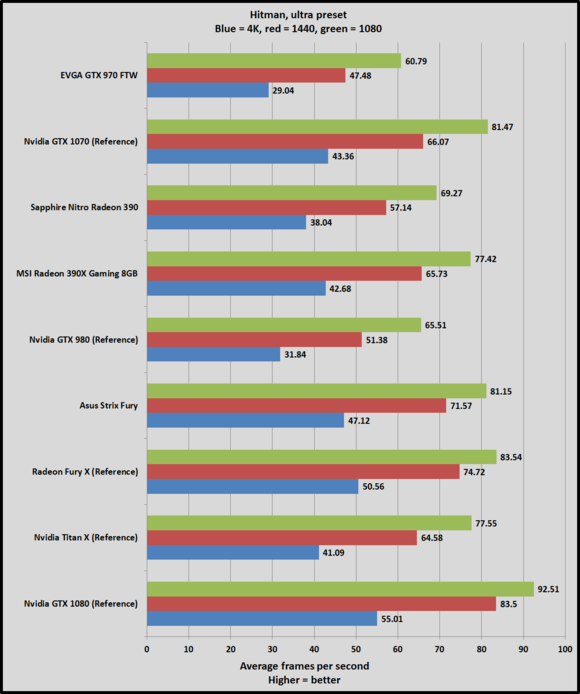
Hitman


gtx 1070 hitman


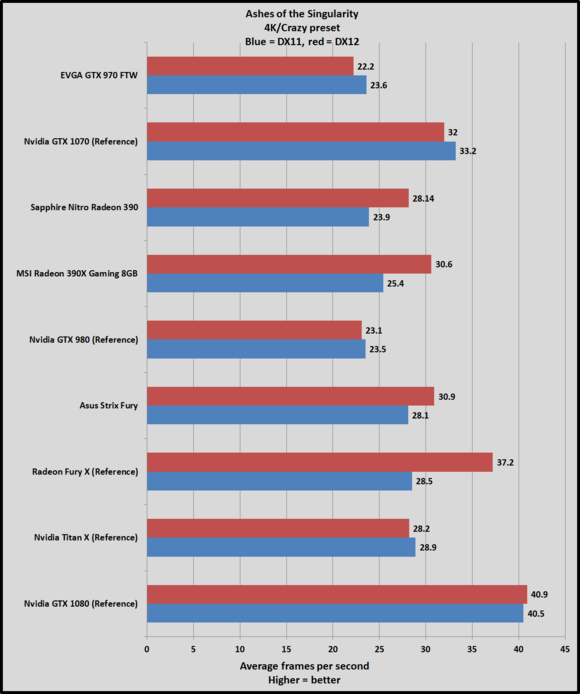
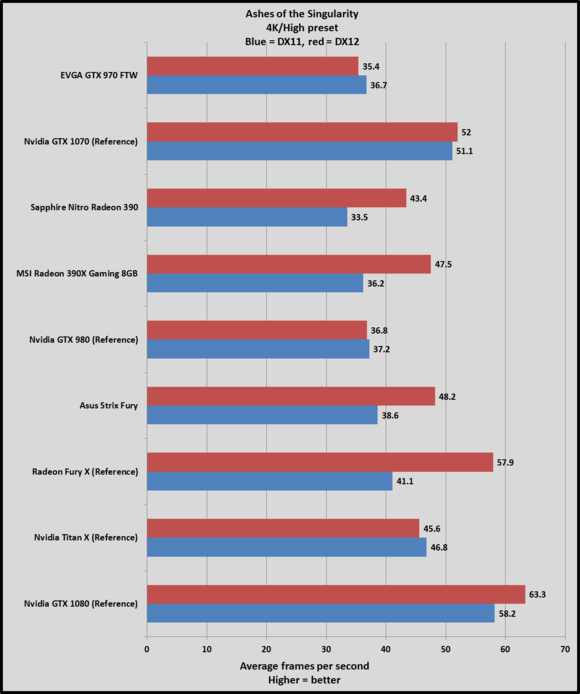
Ashes of the Singularity


gtx 1070 aots 4k crazy

gtx 1070 aots 4k high

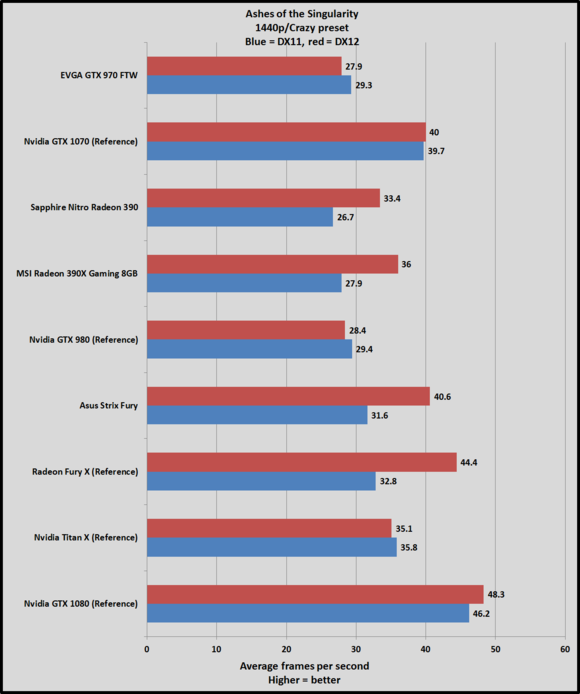
gtx 1070 aots 1440 crazy

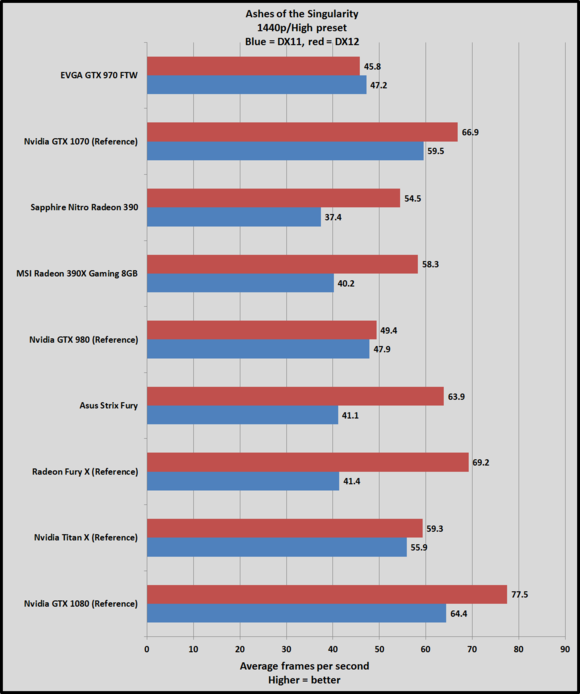
gtx 1070 aots 1440 high

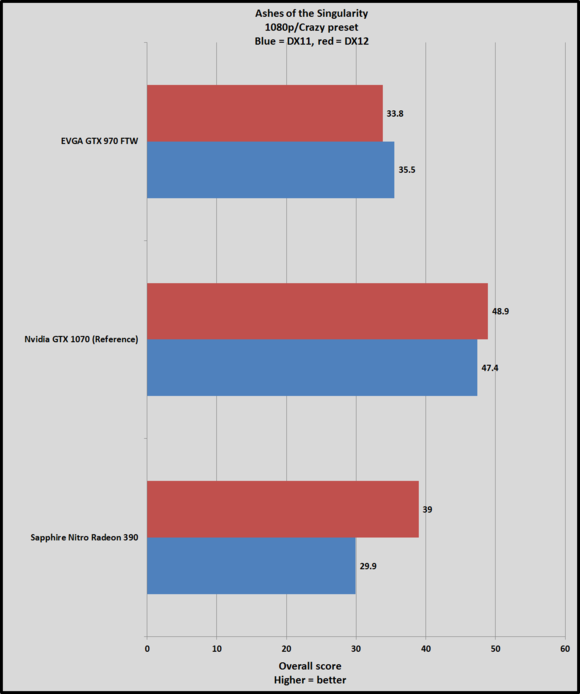
gtx 1070 aots 1080 crazy

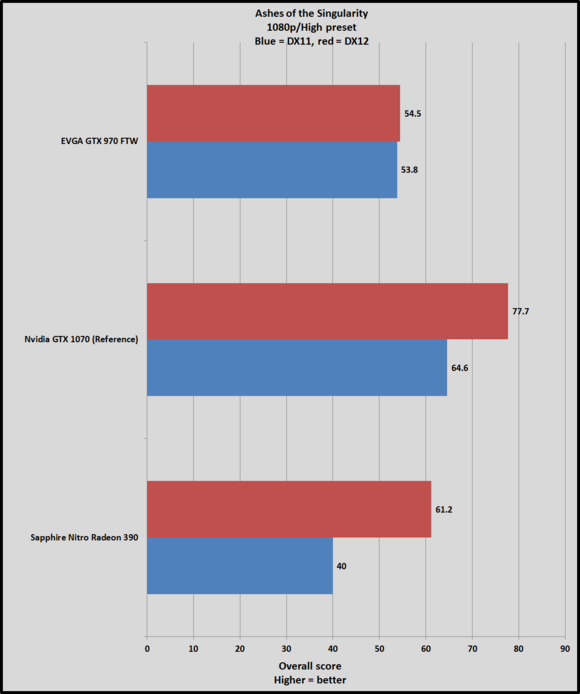
gtx 1070 aots 1080 high


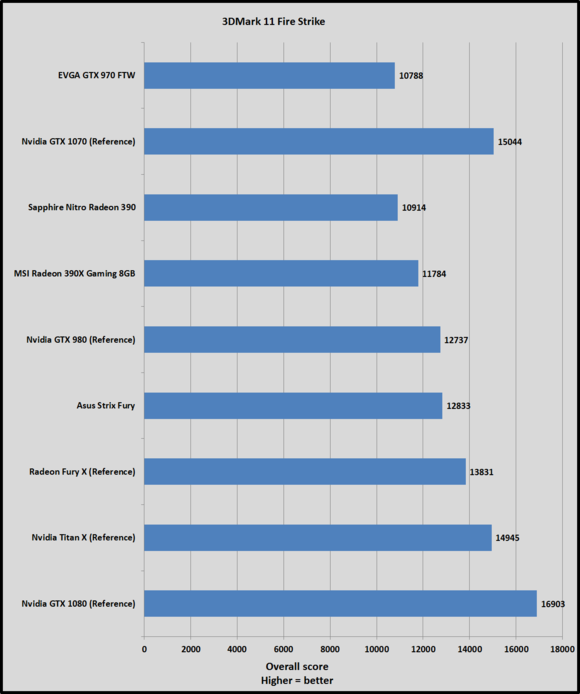
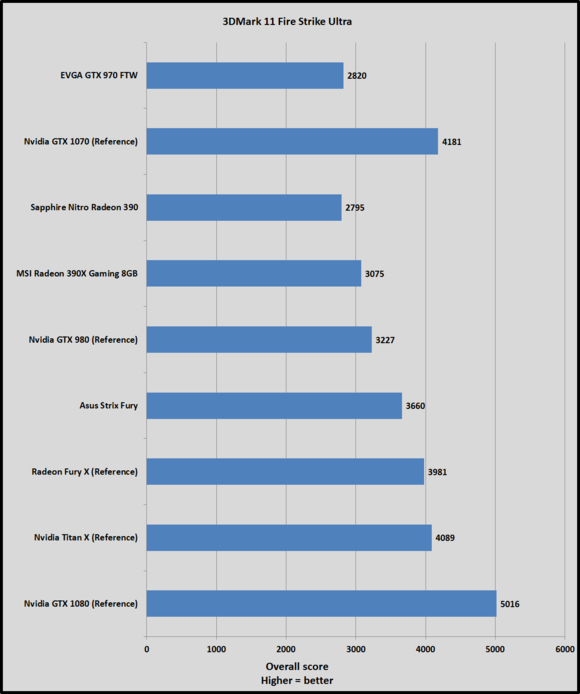
3DMark Fire Strike and Fire Strike Ultra


gtx 1070 firestrike

gtx 1070 firestrike ultra


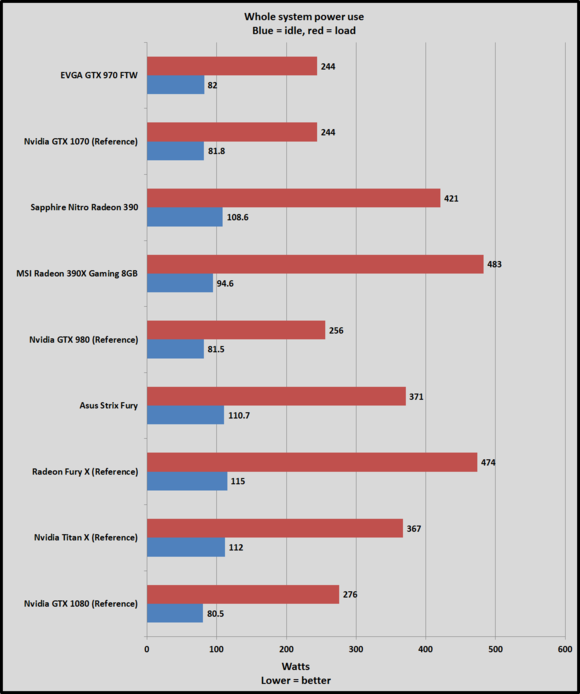
Power and heat


gtx 1070 power


출처 - http://www.pcworld.com


엔비디아가 최근 발표한 파스칼 아키텍처 기반 최상위 지포스GTX 1080의 바로 하위 모델인 1070의 벤치마크 자료 입니다.


결과는 이전부터 루머로 돌았던 지포스 타이탄X와 980TI를 넘어서는 성능을 증명하고 있으며 전력소모는 아이들과 로드시 모두 지포스 970과 동급으로 확인되고 있습니다. 이것은 전력 소모 대비 성능(와트당 성능)이 매우 뛰어남을 나타내는 것입니다.


이제 관전 포인트는 엔비디아의 파스칼에 대한 AMD의 대응 입니다.

반응형
Posted by 랩터 인터내셔널


엔비디아의 신 아키텍처 파스칼 베이스의 지포스GTX 1080 벤치마크 by 어낸드텍


NVIDIA GPU Specification Comparison
  GTX 1080 GTX 980 Ti GTX 980 GTX 780
CUDA Cores 2560 2816 2048 2304
Texture Units 160? 176 128 192
ROPs 64 96 64 48
Core Clock 1607MHz 1000MHz 1126MHz 863MHz
Boost Clock 1733MHz 1075MHz 1216MHz 900Mhz
TFLOPs (FMA) 9 TFLOPs 6 TFLOPs 5 TFLOPs 4.1 TFLOPs
Memory Clock 10Gbps GDDR5X 7Gbps GDDR5 7Gbps GDDR5 6Gbps GDDR5
Memory Bus Width 256-bit 384-bit 256-bit 384-bit
VRAM 8GB 6GB 4GB 3GB
FP64 1/32 1/32 1/32 FP32 1/24 FP32
TDP 180W 250W 165W 250W
GPU GP104 GM200 GM204 GK110
Transistor Count 7.2B 8B 5.2B 7.1B
Manufacturing Process TSMC 16nm TSMC 28nm TSMC 28nm TSMC 28nm
Launch Date 05/27/2016 06/01/2015 09/18/2014 05/23/2013
Launch Price MSRP: $599
Founders $699
$649 $549 $649


엔비디아의 하이엔드 GPU 스펙비교


지포스GTX 1080은 새로운 파스칼 아키텍처가 탑재, TSMC 16나노 공정, 쿠다코어 2560, ROP 64, 베이스 클럭 1607MHz, 부스트 클럭 1733MHz, 메모리 및 클럭 10Gbps GDDR5X, 메모리 인터페이스 256비트, VRAM 8GB, TDP 180와트, 공식 가격 599달러, 파운더스 에디션 699달러


스펙 주요 특징 : 지포스GTX 980TI에서 크게 향상된 코어-부스트 클럭, 쿠다코어는 오히려 감소


카드 PCB 디자인, 8핀 보조전원 X1


Gaming Performance, Power, Temperature, & Noise

So with the basics of the architecture and core configuration behind us, let’s dive into some numbers.

Rise of the Tomb Raider - 3840x2160 - Very High (DX11)

Dirt Rally - 3840x2160 - Ultra

Ashes of the Singularity - 3840x2160 - Extreme

Battlefield 4 - 3840x2160 - Ultra Quality (0x MSAA)

Crysis 3 - 3840x2160 - Very High Quality + FXAA

The Witcher 3 - 3840x2160 - Ultra Quality (No Hairworks)

The Division - 3840x2160 - Ultra Quality

Grand Theft Auto V - 3840x2160 - Very High Quality

Hitman - 3840x2160 - Ultra Quality


The Witcher 3 - 1920x1080 - Ultra Quality (No Hairworks)


지포스GTX 1080 성능 : 최고 성능


Load Power Consumption - Crysis 3


지포스GTX 1080 전력 소모 : 지포스 980TI 보다 52와트 적게 소모, 높은 전력 효율


Load GPU Temperature - Crysis 3

Load Noise Levels - Crysis 3


지포스GTX 1080 소음 및 온도 : 모두 중급으로 무난


출처 - http://www.anandtech.com

반응형
Posted by 랩터 인터내셔널


인텔 브로드웰-EP 아키텍처 기반 제온E5 V4 시리즈


바뀐 외형 : 상단이 브로드웰EP, 하단이 구형 E5 V3


14나노 브로드웰-EP 제온E5 V4 특징


◾Faster divider: lower latency & higher throughput
◾AVX multiply latency has decreased from 5 to 3
◾Bigger TLB (1.5k vs 1k entries)
◾Slightly improved branch prediction (as always)
◾Larger scheduler (64 vs 60)


제온E5 V4 시리즈 라인업 및 가격


Intel Xeon E5 v4 SKUs
  Cores/Threads TDP Base Clockspeed Price
E5-2699 v4 22/44 145W 2.2GHz $4115
E5-2698 v4 20/40 135W 2.2GHz $3228
E5-2697A v4 16/32 145W 2.6GHz $2891
E5-2697 v4 18/36 145W 2.3GHz $2702
E5-2695 v4 18/36 120W 2.1GHz $2424
E5-2690 v4 14/28 135W 2.6GHz $2090
E5-2687W v4 12/24 160W 3.0GHz $2141
E5-2683 v4 16/32 120W 2.1GHz $1846
E5-2680 v4 14/28 120W 2.4GHz $1745
E5-2667 v4 8/16 135W 3.2GHz $2057
E5-2660 v4 14/28 105W 2.0GHz $1445
E5-2650L v4 14/28 65W 1.7GHz $1329
E5-2650 v4 12/24 105W 2.2GHz $1166
E5-2643 v4 6/12 135W 3.4GHz $1552
E5-2640 v4 10/20 90W 2.4GHz $939
E5-2637 v4 4/8 135W 3.5GHz $996
E5-2630 v4 10/20 85W 2.2GHz $667
E5-2630L v4 10/20 55W 1.8GHz $612
E5-2623 v4 4/8 85W 2.6GHz $444
E5-2620 v4 8/16 85W 2.1GHz $417
E5-2609 v4 8/8 85W 1.7GHz $306
E5-2603 v4 6/6 85W 1.7GHz $213


[ 테스트 시스템 ]


Intel's Xeon E5 Server – S2600WT (2U Chassis)

CPU Two Intel Xeon processor E5-2699v4 (2.2 GHz, 22c, 55MB L3, 145W)
Two Intel Xeon processor E5-2695v4 (2.1 GHz, 18c, 45MB L3, 145W)
Two Intel Xeon processor E5-2699v3 (2.3 GHz, 18c, 45MB L3, 145W)
Two Intel Xeon processor E5-2695v3 (2.3 GHz, 14c, 35MB L3, 120W)
Two Intel Xeon processor E5-2667v3 (3.2 GHz, 8c, 20MB L3, 135W)
RAM 128GB (8x16GB) Kingston DDR-2400
Internal Disks 2x Intel SSD3500 400GB
Motherboard Intel Server Board Wildcat Pass
Chipset Intel Wellsburg B0
BIOS version 1/28/2016
PSU Delta Electronics 750W DPS-750XB A (80+ Platinum)


SuperMicro 6027R-73DARF (2U Chassis)

CPU Two Intel Xeon processor E5-2697 v2 (2.7GHz, 12c, 30MB L3, 130W)
Two Intel Xeon processor E5-2690 (2.9GHz, 8c, 20MB L3, 135W)
RAM 128GB (8x16GB) Samsung at 1866 MHz 
Internal Disks 2x Intel SSD3500 400GB
Motherboard SuperMicro X9DRD-7LN4F
Chipset Intel C602J
BIOS version R 3.0a (December the 6th, 2013)
PSU Supermicro 740W PWS-741P-1R (80+ Platinum)


출처 - http://www.anandtech.com

반응형
Posted by 랩터 인터내셔널

q300_678x452_678x452.jpg


Toshiba Q300 SATA SSDs
Capacity 960GB 480GB 240GB 120GB
NAND Toshiba A19nm 128Gb TLC
Controller Toshiba TC58
Sequential Read 550 MB/s
Sequential Write 530 MB/s
4kB Random Read IOPS 87k
4kB Random Write IOPS 83k
Endurance Rating 240TB 120TB 60TB 30TB
Active Power Consumption 5.1W
Idle Power Consumption 1.1W
Warranty 3 years


- 도시바 Q300 SSD 스펙


라인업 : 120 - 240 - 480 - 960GB

낸드 플래시 : 도시바 A19나노 128Gb TLC

메인 컨트롤러 : 도시바 TC58

시퀀셜 읽기 : 550 MB/s

시퀀셜 쓰기 : 530 MB/s

4kB 랜덤 읽기 : 87k

4kB 랜덤 쓰기 : 83k

액티브 전력소모 : 5.1와트

아이들 전력소모 : 1.1와트

워런티 : 3년


좌 : 도시바 Q300 / 우 : OCZ Trion 100  = 같은 모델


[ 테스트 시스템 ]

CPU Intel Core i7-4770K running at 3.5GHz (Turbo & EIST enabled, C-states disabled)
Motherboard ASUS Z97 Deluxe (BIOS 2501)
Chipset Intel Z97
Memory Corsair Vengeance DDR3-1866 2x8GB (9-10-9-27 2T)
Graphics Intel HD Graphics 4600
Desktop Resolution 1920 x 1200
OS Windows 8.1 x64


Steady-State 4KB Random Write Performance

The Q300's steady-state performance is on par with the Trion 100: low, but well above the Crucial BX200 and SanDisk Ultra II. The latter drive uses SanDisk's second-generation 19nm TLC that is made on the same process as the flash in the Q300.

Steady-State 4KB Random Write Consistency

The write consistency of the Q300 is poor, but that's the case for most low-end drives - even the ones using MLC flash. As long as the performance has a reasonably high floor, a lot of variance is tolerable for client workloads. The Q300 is noticeably less consistent than the Trion 100.

IOPS over time
Default Toshiba Q300 480GBOCZ ARC 100 240GBPlextor M6V 256GBSamsung 850 EVO 500GBSamsung 850 Pro 256GBSanDisk Extreme Pro 240GBSanDisk Ultra II 240GBOCZ Trion 100 240GBOCZ Trion 100 480GBOCZ Trion 100 960GBCorsair Neutron XT 480GBCrucial BX100 500GBCrucial MX100 512GBCrucial MX200 500GBOCZ Vector 180 480GBSamsung SSD 850 Pro 512GBSanDisk Extreme Pro 480GB
25% Over-Provisioning Toshiba Q300 480GBOCZ Trion 100 240GBOCZ Trion 100 480GBOCZ Trion 100 960GBCorsair Neutron XT 480GBCrucial BX100 500GBCrucial MX100 512GBOCZ ARC 100 240GBOCZ Vector 180 480GBSamsung 850 EVO M.2 500GBSamsung SSD 850 Pro 512GBSanDisk Extreme Pro 480GBSanDisk Ultra II 240GB

It takes about ten minutes of full-speed writing for the Q300 to burn through its spare area, which is pretty good. The steady state that it reaches is mostly consistent save for some extreme outliers.

Steady-State IOPS over time
Default Toshiba Q300 480GBOCZ ARC 100 240GBPlextor M6V 256GBSamsung 850 EVO 500GBSamsung 850 Pro 256GBSanDisk Extreme Pro 240GBSanDisk Ultra II 240GBOCZ Trion 100 240GBOCZ Trion 100 480GBOCZ Trion 100 960GBCorsair Neutron XT 480GBCrucial BX100 500GBCrucial MX100 512GBCrucial MX200 500GBOCZ Vector 180 480GBSamsung 850 EVO 1TBSamsung SSD 850 Pro 512GBSanDisk Extreme Pro 480GB
25% Over-Provisioning Toshiba Q300 480GBOCZ Trion 100 240GBOCZ Trion 100 480GBOCZ Trion 100 960GBCorsair Neutron XT 480GBCrucial BX100 500GBCrucial MX100 512GBOCZ ARC 100 240GBOCZ Vector 180 480GBSamsung 850 EVO M.2 500GBSamsung SSD 850 Pro 512GBSanDisk Extreme Pro 480GBSanDisk Ultra II 240GB

The Q300's steady-state write performance is around 1500 IOPS with several brief excursions per minute up to 30k+ IOPS. With extra space reserved, the variance increases and the steady state ranges from about 1100 IOPS to about 5500 IOPS.


AnandTech Storage Bench - The Destroyer (Data Rate)

The Q300's average data rate during The Destroyer was slightly better than the Trion 100 480GB, and puts the Q300 around the middle of the pack and well ahead of the Crucial BX200. It's also slightly ahead of the Plextor M6V, a drive that uses MLC flash and prioritizes power efficiency over performance.

AnandTech Storage Bench - The Destroyer (Latency)

The average service time of the Q300 on The Destroyer is considerably worse than the Trion 100, and near the bottom of the chart. The performance consistency test showed the Q300 as significantly more variable than the Trion 100 before reaching steady state, so this result isn't inexplicable.

AnandTech Storage Bench - The Destroyer (Latency)

AnandTech Storage Bench - The Destroyer (Latency)

The Q300 has more severe latency outliers than the Trion 100, though neither drive is great at limiting latency.

AnandTech Storage Bench - The Destroyer (Power)

The Q300 shows improved power efficiency over the Trion 100, but the MLC drives are all better.


AnandTech Storage Bench - Heavy (Data Rate)

The Q300's average data rate on the ATSB Heavy test is the same as the Trion 100: low but not the worst we've seen, and about half what the Samsung 850 Pro delivers. All of the planar TLC drives perform worse than all of the MLC drives.

AnandTech Storage Bench - Heavy (Latency)

The Q300's average service time is again worse than the Trion 100, and is about twice that of the slowest MLC drive. The BX200 puts things in perspective: the Q300 is a disappointment, but isn't truly broken.

AnandTech Storage Bench - Heavy (Latency)

Most MLC drives are able to keep latency under 10ms almost all of the time, but the TLC drives get overwhelmed during the more intense parts of the test. The Q300 is worse than the Trion 100 480GB, but this time isn't worse than the smaller Trion 100.

AnandTech Storage Bench - Heavy (Power)

The Q300 continues to be slightly more power efficient than the Trion 100, but the gap separating it from the MLC drives is quite clear. The SanDisk Ultra II managed to get much better efficiency out of nearly-identical TLC flash.


AnandTech Storage Bench - Light (Data Rate)

The performance rankings for the ATSB Light test are similar to the more intense tests, but the spread is much smaller and the difference between starting with an empty or full drive is much larger. A low-end MLC drive usually won't provide noticeably better performance than the Q300 on workloads this light.

AnandTech Storage Bench - Light (Latency)

AnandTech Storage Bench - Light (Latency)

The latency of the Q300 is again near the bottom of the charts and worse than the Trion 100, but even for a full drive the average is only twice that of the best MLC SATA drives. The Q300 is underperforming for its capacity class, but is still reasonable for a SSD.

AnandTech Storage Bench - Light (Power)

On light workloads like this, most drives don't stand out from the crowd in terms of energy efficiency. The top performers are mostly drawing proportionately more power and end up using the same amount of energy.


Iometer - 4KB Random Read


Iometer - 4KB Random Write


Iometer - 128KB Sequential Read


Iometer - 128KB Sequential Write


Incompressible Sequential Read Performance

Incompressible Sequential Write Performance


Idle Power Consumption (HIPM+DIPM)


Active Idle Power Consumption (No ALPM)


출처 - http://www.anandtech.com

반응형
Posted by 랩터 인터내셔널

P1030828_678x452.jpg


중국 화웨이 스마트폰 메이트8


Huawei Mate 8
SoC HiSilicon Kirin 950
4x Cortex A53 @ 1.8GHz
4x Cortex A72 @ 2.3GHz
Mali-T880MP4 @ 900MHz
RAM 3-4GB LPDDR4 @ 1333MHz
NAND

(NXT-AL10)
32GB / 64GB / 128GB NAND
+  microSD
Display 6” 1080p JDI IPS-Neo LCD
Modem 2G/3G/4G LTE Cat 6 
(Integrated HiSilicon Balong Modem)
Networks


(NXT-AL10)
(NXT-L29)
(NXT-L09)
TDD LTE B38 / B39 / B40 / B41
FDD LTE B1 / B2 / B3 / B4 / B5 / B6-B6 B7 / B8 / B12 / B17 / B18 / B19 / B20 / B26 / B28
UMTS 850 / 900 / AWS / 1900 / 2100
( B19 / B8 / B6 / B5 / B4 / B2 / B1)
GSM 850 / 900 / 1800 / 1900
Dimensions 157.1 (h) x 80.6 (w) x 7.9 (d) mm
185g weight
Camera Rear Camera w/ OIS
16MP ( 4608 × 3456 )
Sony IMX298 1/2.8" w/ 1.12µm pixels
F/2.0 aperture, 27mm eq.
Front Facing Camera
8MP ( 3264 × 2448 ) 
Sony IMX179 1/3.2" w/ 1.4µm pixels
F/2.4 aperture, 26mm eq.
Battery 4000mAh (15.2 Whr)
OS Android 6.0
with EmotionUI 4.0
Connectivity  802.11a/b/g/n/ac dual-band 2.4 & 5GHz
BT 4.2, microUSB2.0, GPS/GNSS,
DLNA, NFC
SIM Size NanoSIM +
NanoSIM (w/o microSD)
(NXT-L09 is single-SIM)
MSRP 3GB + 32GB China: ¥2999-3199 (USD~479, ~449€) - Europe: 599€
4GB + 64GB China: ¥3699 (USD~591, ~554€) - Europe: 699€
4GB + 128GB China: ¥4399 (USD~703, ~659€) - Europe: N/A


메이트8 스펙 : 기린 950 AP, 3~4GB LPDDR4, 32/64/128GB 낸드 + 마이크로SD, 6인치 IPS-Neo LCD, 2G/3G/4G LTE Cat 6 모뎀


제품 사이즈 : 157.1 (h) x 80.6 (w) x 7.9 (d) mm

무게 : 185g

카메라 : 후면 OIS 16MP ( 4608 × 3456 ) / 소니 IMX179 1/3.2" w/ 1.4µm

카메라 : 전면 8MP ( 3264 × 2448 ) / 소니 IMX179 1/3.2" w/ 1.4µm

배터리 : 4000mAh (15.2 Whr)

운영체제 : 안드로이드 6.0 with EmotionUI 4.0

커넥티비티 : 802.11a/b/g/n/ac dual-band 2.4 & 5GHz / BT 4.2, microUSB2.0, GPS/GNSS / DLNA, NFC


[ 화웨이 메이트8 디자인 ]


HiSilicon High-End Kirin Lineup
SoC Kirin 925
(Hi3620)
Kirin 935
(Hi3630)
Kirin 950
(Hi3650)
CPU 4x Cortex A7 @ 1.3GHz

4x Cortex A15 @ 1.8 GHz
4x Cortex A53 @ 1.5 GHz

4x Cortex A53 @ 2.2 GHz
4x Cortex A53 @ 1.8 GHz

4x Cortex A72 @ 2.3 GHz
Memory
Controller
2x 32-bit LPDDR3 @ 800MHz


12.8GB/s b/w
2x 32-bit LPDDR3
or LPDDR4 @ 1333MHz
(hybrid controller)

21.3GB/s b/w
GPU Mali T628MP4
600MHz
Mali T628MP4
680MHz
Mali T880MP4
900MHz
Encode/
Decode
1080p H.264
Decode & Encode
1080p60 H.264
Decode & Encode

2160p30 HEVC 
Decode
Integrated
Modem
Balong Integrated
UE Cat. 6 LTE


[ 화웨이 기린 950 프로세서 스펙 ]

코어 구성 : 4x Cortex A53 @ 1.8 GHz / 4x Cortex A72 @ 2.3 GHz

메모리 컨트롤러 : 2x 32-bit LPDDR3 + LPDDR4 @ 1333MHz (하이브리드 컨트롤러)

GPU : 말리 T880MP4 900MHz

기타 : 1080p60 H.264 Decode & Encode / 2160p30 HEVC Decode

모뎀 : UE Cat. 6 LTE


Kraken 1.1 (Chrome/Safari/IE)


Google Octane v2  (Chrome/Safari/IE)


WebXPRT 2015 (Chrome/Safari/IE)


Basemark OS II 2.0 - System


Basemark OS II 2.0 - Memory


Basemark OS II 2.0 - Web


Basemark OS II 2.0 - Overall


PCMark - Web Browsing


PCMark - Video Playback


PCMark - Writing


PCMark - Photo Editing


PCMark - Work Performance Overall


화웨이 메이트8 CPU 성능 (기린 950) : 아이폰6S(A9) 다음으로 이어지는 최상급 성능


3DMark Ice Storm Unlimited - Graphics

Starting with 3DMark Ice Storm Unlimited we see that the Mate 8 is able to show a good improvement over past Kirin SoCs but can’t keep up with the more performant GPUs from Qualcomm and Samsung.

3DMark Ice Storm Unlimited - Physics

The physics test shows some very good improvements as the test stresses both GPU and CPU. 

GFXBench Manhattan ES 3.0 (Onscreen)

Kishonti’s GFXBench Manhattan sees a doubling of the framerate from 9.5 to 19.2fps. This is interesting as it means the new GPU is able to take advantage of its architectural advancements to improve performance per clock compared to the Mali T628. The difference is quite large, but unfortunately we won’t be able to better analyse just how much the new GPU improves over its predecessors until we are able to get better control over the platform’s drivers to be able to test it in the same way we investigated the Mali T760 in last year’s Exynos 5433.

GFXBench T-Rex HD (Onscreen)

The on-screen T-Rex tests show an even larger performance improvement as we’re getting 2.5x the performance of the T628 in the Kirin 925 and 935. The 220MHz (32%) clock advantage alone isn’t able to account for the performance increase and the remaining factors coming from the addition of a new LPDDR4 memory controller are also far greater than what we’ve seen from the T760, leaving us with the only viable explanation that ARM’s new GPU generation is able to show some solid improvements in terms of performance at the same clock and physical configuration.

GFXBench Manhattan ES 3.0 (Offscreen)GFXBench T-Rex HD (Offscreen)


화웨이 메이트8 GPU 성능 : 중급 성능


Web Browsing Battery Life (WiFi)


웹 브라우징 배터리 지속시간(와이파이) : 화웨이 메이트7에 이어 두번째 효율


Web Browsing Battery Life (4G LTE)


웹 브라우징 배터리 지속시간(LTE) : 하급 성능


PCMark - Work Battery Life


PC마크 배터리 지속 시간 : 최고 효율


BaseMark OS II Battery Life


베이스마크OS II 배터리 효율 : 갤럭시 노트5에이 두번째 효율


GFXBench 3.0 Battery Life


GFX 벤치 3.0 배터리 효율 : 하급 성능


Charge Time


충전 시간 : 상급 성능


Internal NAND - Sequential Read

The Mate 8 managed 127MB/s sequential read which puts it at the lower end of last generation flagships. Unless I’m mistaken the phone comes unencrypted and Huawei also doesn’t offer the option to encrypt the phone as it’s missing from the settings menus. HiSilicon has confirmed to me that the Mate 8 has FDE enabled by default and that the performance listed represents the encrypted performance of the phone. 

Internal NAND - Sequential Write


화웨이 메이트8 스토리지 시퀀셜 성능 : 중급 성능


WiFi Performance - UDP


화웨이 메이트8 와이파이 성능(UDP) : 중 하급 성능


출처 - http://www.anandtech.com

반응형
Posted by 랩터 인터내셔널

carousel_678x452.jpg


인텔의 초소형 스틱PC, 컴퓨트 스틱


Intel PPSTK1AW32SC Specifications
Processor Intel Atom x5-Z8300
(4C/4T x 1.44 GHz, 14nm, 2MB L2, 2W SDP)
Memory 2GB DDR3L @ 1600 MHz
Graphics Intel HD Graphics
Disk Drive(s) SanDisk DF4032 32GB eMMC
Networking 2x2 Intel Dual Band Wireless-AC 7265 802.11ac
Audio Capable of 5.1/7.1 digital output with audio over HDMI
Operating System Windows 10 Home x86
Pricing (As configured) $159
Full Specifications Intel PPSTK1AW32SC Specifications


컴퓨트 스틱 스펙 : 메인 프로세서에 인텔 아톰X5 체리트레일 Z8300, 메모리 2GB, 인텔 HD 그래픽, 샌디스크 32GB eMMC, 인텔 듀얼 밴드 AC7265, 7.1채널 오디오(HDMI), 윈도우10, 159달러


package_575px.jpg


패키지 구성품 : 스틱 본체, 파워 어댑터, HDMI 변환 케이블


[ 성능 테스트 ]


Futuremark PCMark 8 - Home OpenCL

Futuremark PCMark 8 - Creative OpenCL

Futuremark PCMark 8 - Work OpenCL

Miscellaneous Futuremark Benchmarks

Futuremark PCMark 7 - PCMark Suite Score

Futuremark 3DMark 11 - Entry Score

Futuremark 3DMark 2013 - Cloud Gate Score


Video Encoding - x264 5.0 - Pass 1

Video Encoding - x264 5.0 - Pass 2


7-Zip LZMA Compression Benchmark

7-Zip LZMA Decompression Benchmark


7-Zip LZMA Compression Benchmark

7-Zip LZMA Decompression Benchmark


스틱PC 임에도 상당한 성능


Wi-Fi TCP Throughput


와이파이 TCP 스루풋 - 최고 성능


Wi-Fi UDP Throughput (< 1% Packet Loss)


와이파이 UDP 스루풋 -  중급 성능


YouTube Streaming - HTML5: Power Consumption


유튜브 HTML5 스트리밍 전력소모 - 최고 효율


Netflix Streaming - Windows 8.1 Metro App: Power Consumption


넷플릭스 스트리밍 전력소모 - 최고 효율


Idle Power Consumption

Load Power Consumption (Prime95 + FurMark)


아이들 / 로드 전력소모 - 최고 효율


출처 - http://www.anandtech.com


인텔 컴퓨트 스틱은 소형PC계열 누크보다 인기를 얻을 것

반응형
Posted by 랩터 인터내셔널

carousel_678x452.jpg


Crucial  480/500/512GB SSD Comparison
Drive BX100 BX200 MX200
Controller Silicon Motion SM2246EN Silicon Motion SM2256 Marvell 88SS9189
NAND Micron 16nm 128Gbit MLC Micron 16nm 128Gbit TLC NAND Micron 16nm 128Gbit MLC
Sequential Read 535 MB/s 540 MB/s 555 MB/s
Sequential Write 450 MB/s 490 MB/s 500 MB/s
4kB Random Read 90k IOPS 66k IOPS 100k IOPS
4kB Random Write 70k IOPS 78k IOPS 87k IOPS
Endurance 72 TB 72 TB 160 TB
Warranty 3 years


마이크론 BX200 SDD 스펙. 기존 BX100의 실리콘 모션 SM2246EN 컨트롤러에서 SM2256으로 향상, 낸드는 처음으로 16나노 TLC 128Gbit 탑재, 시퀀셜 읽기 성능 540MB/s, 시퀀셜 쓰기 성능 490MB/s, 4K 랜덤 읽기 66k, 랜덤 쓰기 78k, 3년 워런티 제공


[ 테스트 시스템 ]


AnandTech 2015 SSD Test System
CPU Intel Core i7-4770K running at 3.5GHz (Turbo & EIST enabled, C-states disabled)
Motherboard ASUS Z97 Deluxe (BIOS 2501)
Chipset Intel Z97
Chipset Drivers Intel 10.0.24+ Intel RST 13.2.4.1000
Memory Corsair Vengeance DDR3-1866 2x8GB (9-10-9-27 2T)
Graphics Intel HD Graphics 4600
Graphics Drivers 15.33.8.64.3345
Desktop Resolution 1920 x 1200
OS Windows 8.1 x64


Steady-State 4KB Random Write Performance

The BX200 is off to a poor start, with very low steady-state IOPS where the BX100 managed to place closer to the middle of the pack.

Steady-State 4KB Random Write Consistency


AnandTech Storage Bench - The Destroyer (Data Rate)

The BX100's performance on The Destroyer isn't dead last, but it underperforms for its capacity.

AnandTech Storage Bench - The Destroyer (Latency)

Average service time is startlingly high and is close to a hard drive's seek time.

AnandTech Storage Bench - The Destroyer (Latency)

AnandTech Storage Bench - The Destroyer (Latency)

The frequency of performance outliers is in line with the other two low performers on this test, indicating that the BX200's performance doesn't stutter any more often, but it pauses for longer periods of time when it does stutter.

AnandTech Storage Bench - The Destroyer (Power)

Higher power consumption is to be expected from a drive using TLC NAND, but the BX200 consumed more than twice the energy over the duration of The Destroyer than any of the other drives, and more than five times as much as the BX100. The BX200 didn't take vastly more time to complete The Destroyer, so it was clearly not making good use of idle time.


AnandTech Storage Bench - Heavy (Data Rate)


AnandTech Storage Bench - Heavy (Latency)


AnandTech Storage Bench - Heavy (Latency)

AnandTech Storage Bench - Light (Data Rate)

Even our Light test is enough to hit the BX200 where it hurts. The 480GB drive's average data rate is around what the first-generation SATA interface could handle.

AnandTech Storage Bench - Light (Latency)

AnandTech Storage Bench - Light (Latency)

The latency outliers are the most disturbing result so far. The Light test should not enough to bring a SSD to its knees.

AnandTech Storage Bench - Light (Power)


Iometer - 4KB Random Read

Random reads are slow, but at least the BX200 has company. This is what slow TLC flash does, but unlike many other results so far, this performance is not cause for major concern.

Iometer - 4KB Random Read (Power)

Power consumption is in the middle of the pack, so the BX200 is doing something (almost) right when handling reads.


Iometer - 4KB Random Write

Our Iometer tests run for three minutes at each queue depth, so within 9 minutes the BX200 is clearly having trouble. The higher capacity of the the 960GB drive seems to help a lot, which suggests that the 240GB BX200's performance might be much worse than that of the 480GB.

Iometer - 4KB Random Write (Power)

Power consumption is normal for a TLC drive, which suggests that there are a lot of background writes being done by the drive that are keeping power consumption up in spite of how little real work is getting done.

Crucial BX200 480GB


Iometer - 128KB Sequential Read

At last we see respectable performance from the BX200. Its sequential read speeds aren'te quite up to the SATA limit at low queue depths, but it can sustain solid performance. Unfortunately, for anyone holding out hope that the poor results we've seen so far may be a testbed issue, the otherwise respectable sequential performance puts that idea to rest.

Iometer - 128KB Sequential Read (Power)

Power consumption on sequential reads is actually good, though it won't catch up with the best of drives.

Crucial BX200 480GB
Default Crucial BX200 480GBCrucial BX200 960GBCrucial MX100 512GBCorsair Neutron XT 480GBSamsung 850 Pro 512GBSanDisk Extreme Pro 480GBOCZ Vector 180 960GBOCZ Vector 180 480GBSamsung 850 EVO mSATA 1TBSamsung 850 EVO M.2 500GBSanDisk Ultra II 240GBSamsung 850 EVO 1TBCrucial BX100 500GBCrucial BX100 1TBCrucial MX200 1TBCrucial MX200 512GBOCZ Trion 100 960GBOCZ Trion 100 480GBOCZ ARC 100 240GBADATA XPG SX930 480GBSamsung 850 Pro 2TBSamsung 850 EVO 2TBPlextor M6V 256GB

Given a larger queue depth, the BX200 is actually able to reach the performance plateau of the SATA speed limit; it just takes a little longer than the top tier of drives. Given the performance, it's not surprising to see that power consumption doesn't grow much. The shallow but steady decline in power consumption for the 480GB drive may be a sign that it's able to do some prefetching and caching to reduce the number of times it has to read from the flash.

Sequential Write Performance

The sequential write isn't limited to a small span of the disk, as that usually doesn't make a difference for this performance metric. As always, our averages are of the lower queue depths, but scaling to higher queue depths is also investigated. Bulk file copies and recording uncompressed video are the kind of uses that depend on sequential write performance.

Iometer - 128KB Sequential Write

The initial good news we saw with the BX200's sequential read performance didn't last long. The drive's write performance is bad for sequential access just like random access, unfortunately displacing the Trion 100 as one of the worst drives in our current collection.

Iometer - 128KB Sequential Write (Power)

The BX200 power consumption during sequential writing is poor but not radically so. It would seem that Micron's TLC flash requires at most a little more power to write to than other TLC, and this drive is just wasting most of that power budget on background management.

Crucial BX200 480GB
Default Crucial BX200 480GBCrucial BX200 960GBCrucial MX100 512GBCorsair Neutron XT 480GBSamsung 850 Pro 512GBSanDisk Extreme Pro 480GBOCZ Vector 180 960GBOCZ Vector 180 480GBSamsung 850 EVO mSATA 1TBSamsung 850 EVO M.2 500GBSanDisk Ultra II 240GBSamsung 850 EVO 1TBCrucial BX100 500GBCrucial BX100 1TBCrucial MX200 1TBCrucial MX200 512GBOCZ Trion 100 960GBOCZ Trion 100 480GBOCZ ARC 100 240GBADATA XPG SX930 480GBSamsung 850 Pro 2TBSamsung 850 EVO 2TBPlextor M6V 256GB

Looking at larger queue depths, performance drops slightly after QD1, and stays low as power consumption shifts around some but is always high. Neither capacity of the BX100 can sustain even 100MB/s of writes for a length of time.


Iometer - Mixed 4KB Random Read/Write

The BX200's reasonable read speeds are apparently able to compensate for the write performance enough to keep at least the 960GB BX200 out of last place for the mixed random test, but the 480GB only manages to surpass a 120GB drive.

Iometer - Mixed 4KB Random Read/Write (Power)

The power draw is even more mainstream than the performance, because despite being inefficient the BX200 isn't unreasonably power hungry in an absolute sense.

Crucial BX200 480GB
Default Crucial BX200 480GBCrucial BX200 960GBCrucial MX100 512GBCorsair Neutron XT 480GBSamsung 850 Pro 512GBSanDisk Extreme Pro 480GBOCZ Vector 180 960GBOCZ Vector 180 480GBSamsung 850 EVO mSATA 1TBSamsung 850 EVO M.2 500GBSanDisk Ultra II 240GBSamsung 850 EVO 1TBCrucial BX100 500GBCrucial BX100 1TBCrucial MX200 1TBCrucial MX200 512GBOCZ Trion 100 960GBOCZ Trion 100 480GBOCZ ARC 100 240GBADATA XPG SX930 480GBSamsung 850 Pro 2TBSamsung 850 EVO 2TBPlextor M6V 256GB

Slow and steady doesn't win the race here. Most drives gain speed near the end of the test for the write-heavy portions, but the BX200 gains no performance as the power consumption climbs. It doesn't have the slight bathtub curve shape in the middle the way the Trion 100 does, which is how it keeps pace even without the boost at the end.

Mixed Sequential Read/Write Performance

At either end of this test, when the workload is heavily skewed toward either reads or writes, most drives perform well. In between, performance typically suffers greatly, and that's where the winners and losers of this test are usually determined. Anything that's duplicating or transforming a large amount of data on the drive will produce I/O patterns similar to this test. Creating a System Restore snapshot, backing up files to a different location on the same drive, and file compression can all produce interleaved reads and writes of large blocks of data, though not necessarily fast enough to be limited by the drive's performance. Heavy multitasking can add up to a mixed workload.

Iometer - Mixed 128KB Sequential Read/Write

With average read speeds and poor write speeds, the BX200 is in last place for the overall average, since the competition didn't have any acute weaknesses.

Iometer - Mixed 128KB Sequential Read/Write (Power)

Average power consumption is once again high, and the 960GB is a particular outlier.

Crucial BX200 480GB
Default Crucial BX200 480GBCrucial BX200 960GBCrucial MX100 512GBCorsair Neutron XT 480GBSamsung 850 Pro 512GBSanDisk Extreme Pro 480GBOCZ Vector 180 960GBOCZ Vector 180 480GBSamsung 850 EVO mSATA 1TBSamsung 850 EVO M.2 500GBSanDisk Ultra II 240GBSamsung 850 EVO 1TBCrucial BX100 500GBCrucial BX100 1TBCrucial MX200 1TBCrucial MX200 512GBOCZ Trion 100 960GBOCZ Trion 100 480GBOCZ ARC 100 240GBADATA XPG SX930 480GBSamsung 850 Pro 2TBSamsung 850 EVO 2TBPlextor M6V 256GB

The graph of performance as more writes come into the mix shows just how quickly things get bad. There's a big jump in power consumption once writes are more common than reads, and the drive is almost as overwhelmed at 40/60 as it is for the pure writes.


Idle Power Consumption (HIPM+DIPM)


출처 - http://www.anandtech.com


로우엔드 TLC 모델답게 성능은 비교 모델간 하위권. 전력 효율도 낮은편.

반응형
Posted by 랩터 인터내셔널
0_s.jpg


AMD는 11월 19일 라데온R9 시리즈의 새 GPU "라데온R9 380X"를 발표했다. 이번 발표에 앞서 이 GPU을 탑재한 비디오 카드를 차용해 새로운 GPU 성능을 벤치마크 테스트로 체크했다.


2048기의 Stream Processor을 갖춘 Radeon R9 380X

라데온R9 380X는 Graphics Core Next(GCN)아키텍처를 채택하고 28nm공정으로 제조된 GPU. 라인업상에서는 Tonga코어 기반의 라데온R9 380과 Hawaii코어 기반의 라데온R9 390의 중간에 위치한다.


라데온R9 380X의 GPU코어는 32기의 CU(Compute Unit)으로 구성됐으며 2048기의 Stream Processor, 128기의 텍스처 유닛, 32기의 ROP유닛을 갖춘다. AMD의 리뷰용 자료에서는 라데온R9 380X가 채용한 GPU코어에 대한 정보는 밝히지 않았으며 스펙부터 살펴보건대, 하위 모델의 라데온R9 380과 마찬가지로 Tonga코어를 기반으로 한 제품이라고 생각된다.


VRAM에는 5.7GHz정도로 동작하는 4GB의 GDDR5 메모리를 채용, GPU와 VRAM을 맺은 메모리 인터페이스는 256bit, 비디오 카드가 소비하는 전력의 지표인 Typical Board Power는 190W. 메모리 인터페이스와 Typical Board Power는 하위 모델인 라데온R9 380과 동등한 사양으로 되어 있다.


[표 1]Radeon R9 380X의 주요 사양
Radeon R9 380X Radeon R9 380 Radeon R9 390
아키텍처 GCN GCN(Tonga) GCN(Hawaii)
프로세스 28nm 28nm 28nm
GPU클록(최대) 970MHz 970MHz 1,000MHz
Stream Processor 2,048 1,792 2,560基
텍스처 유닛 128 112 160
메모리 용량 4GB GDDR5 2GB/4GB GDDR5 8GB GDDR5
메모리 클럭 1,425MHz(5.7GHz) 1,425MHz(5.7GHz) 1,500MHz(6GHz)
메모리 인터페이스 256bit 256bit 512bit
ROP유닛 32 32 64基
Typical Board Power 190W 190W 275W


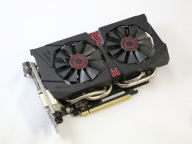
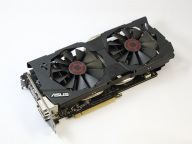
Radeon R9 380X를 탑재하는 ASUS STRIX-R9380X-OC4G-GAMING

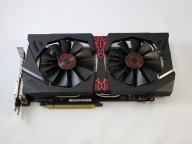
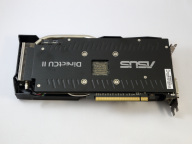
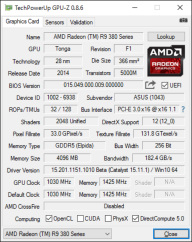
이번에 라데온R9 380X 탑재 비디오 카드로 차용한 것은 ASUS의 "STRIX-R9380X-OC4G-GAMING"


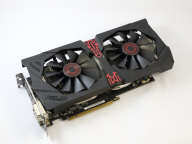
ASUS STRIX-R9380X-OC4G-GAMING은 ASUS의 게이머 브랜드 "STRIX"시리즈에 속하는 비디오 카드로 세미 팬리스 기능을 갖춘 GPU 쿨러 "DirectCU II"을 탑재하고 GPU코어는 라데온R9 380X의 레퍼런스 클럭인 970MHz부터 1030MHz까지 오버클럭되어 탑재되고 있다.


img_01_s.jpg
img_02_s.jpg
ASUS STRIX-R9380X-OC4G-GAMING. 독자적인 기판과 GPU쿨러를 갖추며 Radeon R9 380X을 오버클럭한 ASUS STRIX시리즈의 비디오 카드
img_03_s.jpg
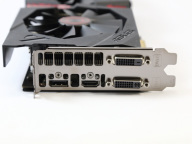
디스플레이 출력 포트. DisplayPort, HDMI, DVI-I, DVI-D
img_04_s.jpg
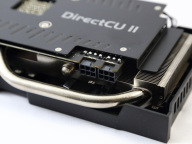
보조 전원 커넥터. PCI-E 6핀을 2계통 필요로 한다
img_05_s.jpg
GPU-Z실행 화면


테스트 장비

벤치마크 테스트의 실행 환경에는 Intel Core i7-6700K를 탑재한 Intel Z170 환경을 준비. 또 라데온R9 380X의 비교용으로 Radeon R9 380, Radeon R9 390, Radeon R9 390X의 AMD GPU 3제품과 GeForce GTX 960, GeForce GTX 970의 NVIDIA제 GPU 2제품으로 총 5가지 제품을 준비했다.


[표 2] 테스트 환경
GPU R9 380X/380/390/390X GTX 960/970
CPU Core i7-6700K
마더보드 ASUS Z170-A
메모리 DDR4-2133 8GB×2(15-15-15-35、1.20V)
스토리지 256GB SSD(CFD S6TNHG6Q)
파워 Antec HCP-1200(1,200W 80PLUS GOLD)
소프트웨어 Catalyst 15.11.1Beta GeForce 358.91 Driver
OS Windows 10 Pro 64bit


또한 비교를 위해서 준비한 5개의 GPU는 라데온R9 380X와 마찬가지로 ASUS의 STRIX 시리즈 제품으로 통일했다.


모두 오버클럭 사양의 비디오 카드이며 통상 레퍼런스 클럭으로 조정하고 벤치마크를 진행하지만 동일 업체의 동일 시리즈로 기재를 통일한 것, 또 시장에 존재하는 레퍼런스 사양의 제품의 적어 이번에는 차용한 ASUS STRIX 시리즈의 제품 사양 그대로 벤치마크 테스트를 실시했다. 각 비디오 카드의 동작 클럭은 다음 표와 같다.


[표 3] 테스트한 비디오 카드의 동작 클럭
GPU GPU 클럭 Boost 클럭 메모리 클럭 VRAM
R9 380X 1,030MHz - 1.425GHz(5.7GHz) 4GB
R9 380 990MHz - 1.375GHz(5.5GHz) 2GB
R9 390 1,050MHz - 1.5GHz(6.0GHz) 8GB
R9 390X 1,070MHz - 1.5GHz(6.0GHz) 8GB
GTX 960 1,228MHz 1,291MHz 1.8GHz(7.2GHz) 2GB
GTX 970 1,114MHz 1,253MHz 1.75GHz(7.0GHz)

4GB

img_06_s.jpg
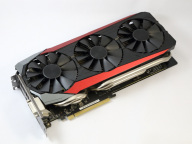
Radeon R9 380기반의 ASUS STRIX-R9380-DC2OC-2GD5-GAMING
img_07_s.jpg
Radeon R9 390기반의 STRIX-R9390-DC3OC-8GD5-GAMING
img_08_s.jpg
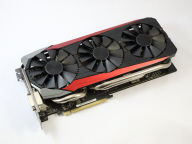
Radeon R9 390기반의 ASUS STRIX-R9390X-DC3OC-8GD5-GAMING
img_09_s.jpg
GeForce GTX 960기반의 ASUS STRIX-GTX960-DC2OC-2GD5
img_10_s.jpg
GeForce GTX 970기반의 STRIX-GTX970-DC2OC-4GD5


벤치마크 결과

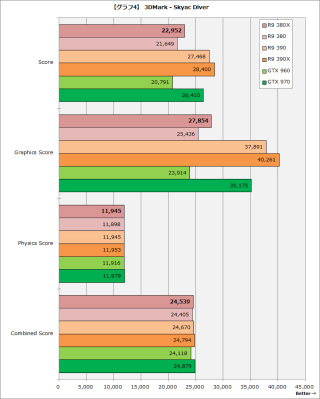
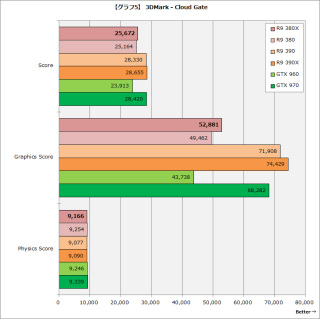
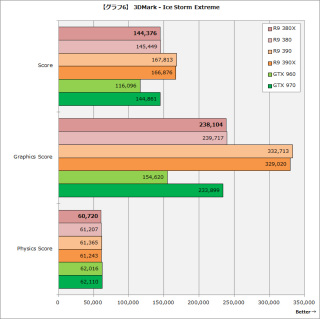
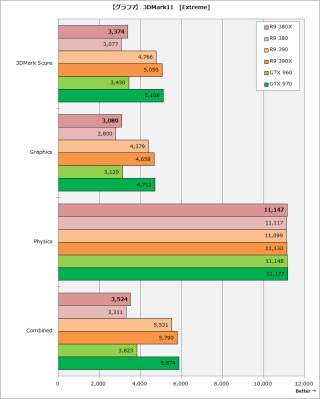
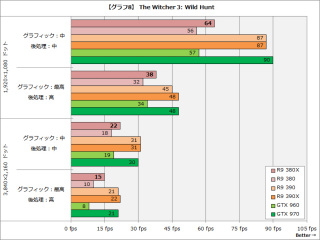
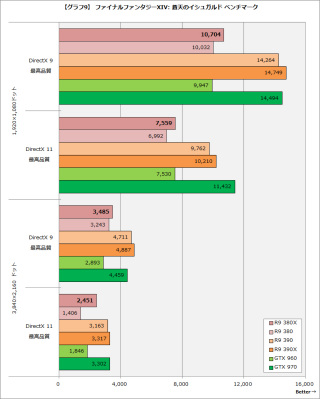
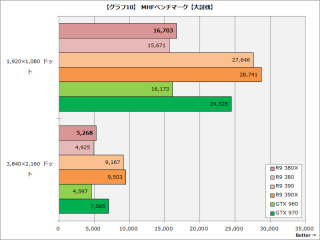
그럼 벤치마크 테스트 결과를 소개한다. 이번에 진행한 벤치마크 테스트는 3DMark(그래프 1~6), 3DMark11(그래프 7), The Witcher 3:Wild Hunt(그래프 8), 파이널 판타지 XIV(그래프 9), MHF 벤치마크(그래프 10).


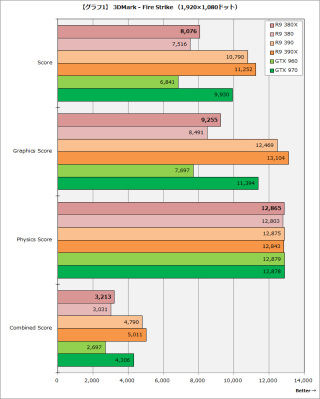
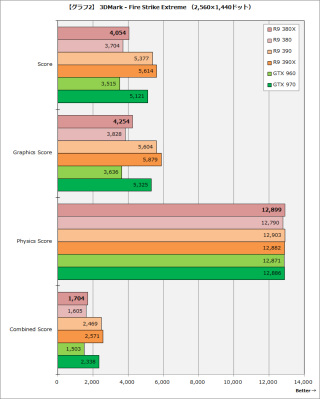
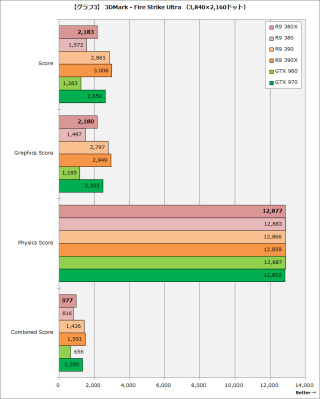
3DMark Fire Strike에서는 1,920×1,080과 2,560×1,440의 Extreme에서 라데온R9 380X가 라데온R9 380에 10% 안팎, GeForce GTX 960에는 15~18% 정도의 차이를 내며 웃돌았다. 이 차이는 3,840×2,160으로 실행되는 "Ultra"에서는 각각 약 40%로 약 70%까지 확대되고 있지만 이는 라데온R9 380과 GeForce GTX 960의 VRAM이 2GB로 4K해상도의 고 부하 벤치마크를 실행하려면 부족한 영향이 크다.


한편 상위 GPU의 차이는 하위 GPU와의 차보다 커 라데온R9 380X 스코어는 라데온R9 390에 30% 안팎, GeForce GTX 970에는 20% 안팎의 차이가 벌어지고 있다.


3DMark11에서 라데온R9 380과의 차이는 여전히 10% 안팎이지만 GeForce GTX 960에는 스코어가 역전되고 있다. 역전됐다고는 하지만 그 차이는 2% 정도로 박빙이며 벤치마크 테스트의 여러부문에서 GeForce GTX 960에 비해 라데온R9 380X는 동등 이상의 성능을 갖고 있다는 인식이 좋을 것이다.


g1_s.jpg
[그래프 1] 3DMark-Fire Strike(1,920×1,080)
g2_s.jpg
[그래프 2] 3DMark-Fire Strike Extreme(2,560×1,440)
g3_s.jpg
[그래프 3] 3DMark-Fire Strike Ultra(3,840×2,160)
g4_s.jpg
【그래프 4】3DMark - Skyac Diver
g5_s.jpg
【그래프 5】3DMark - Cloud Gate
g6_s.jpg
【그래프 6】3DMark - Ice Storm Extreme
g7_s.jpg
【그래프 7】3DMark11 [Extreme]


The Witcher 3:Wild Hunt에서는 3DMark Fire Strike에서 열세였던 GeForce GTX 960이 라데온R9 380를 살짝 넘는 프레임 레이트를 기록하고 있지만 라데온R9 380X는 두 GPU보다 10% 이상 높은 프레임 레이트를 기록했다.


3,840×2,160의 최고 렌더링 설정은 메모리 부족으로 라데온R9 380과 GeForce GTX 960이 크게 프레임 레이트가 떨어졌으며 상대적으로 라데온R9 380X의 우위가 확대되고 있지만 상위 GPU를 포함해 이 설정은 게임으로서 플레이가 가능한 프레임 레이트가 아니다.


g8_s.jpg
【그래프 8】The Witcher 3: Wild Hunt


파이널 판타지 XIV에서는 1,920×1,080의 화면 해상도에서 라데온R9 380에 비해 10% 가까운 차이를 두고 있는 라데온R9 380X이지만 DirectX 11의 최고 렌더링 설정에서는 GeForce GTX 960과 거의 동등한 스코어다.


다만 3,840×2,160의 화면 해상도에서는 라데온R9 380X가 GeForce GTX 960에 20~30%의 차로 역전되어 있다. 메모리 대역의 차이가 크다는 측면도 있지만 이 화면 해상도의 DirectX 11의 최고 렌더링 설정은 2GB의 VRAM에서는 부족한 경향을 보이며 라데온R9 380도 큰 스코어로 떨어지고 있다.


g9_s.jpg
[그래프 9]파이널 판타지 XIV 벤치마크


MHF 벤치마크도 라데온R9 380X는 라데온R9 380에 10% 가까운 차이를 둔다. GeForce GTX 960에 비해서는 1,920×1,080에서는 약 3%의 차에 머물지만 3,840×2,160에서는 약 15% 포인트 차로 확대되고 있다.모니터링한 한 이 벤치마크에서는 VRAM의 부족은 확인되지 않아 이 스코어 차의 확대는 메모리 대역 등에 의한 것.


g10_s.jpg
[그래프 10] MHF 벤치 마크


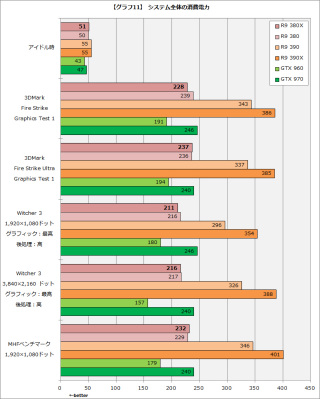
마지막은 각 GPU를 탑재한 시스템의 소비 전력을 측정한 결과의 비교다. 소비 전력은 산와 서플라이의 와트 체커를 사용해 아이들시와 각 벤치마크 실행 중 최대 소비 전력을 측정했다.


라데온R9 380X의 아이들시 소비 전력은 51W로 이는 비교한 6가지 제품 중에서 3번째로 높은 결과로 하위 라데온R9 380의 50W와는 1W 차이로 거의 동등한 결과라고 말해도 좋을 것이다. 한편 GeForce는 GeForce GTX 960이 43W, GeForce GTX 970은 47W를 각각 기록하고 있다. 아이들시 소비 전력은 GeForce 탑재 제품쪽이 약간 우위다.


벤치마크 실행 중인 소비 전력은 라데온R9 380X는 210~240W 안팎을 기록. 이는 하위 모델인 라데온R9 380과 거의 같은 결과다. 벤치마크시 소비 전력이 100W 대로 유지되고 있는 GeForce GTX 960의 전력 대 성능비에는 미치지 않지만 전원 유닛에 요구되는 출력은 크지 않은 것이다.


g11_s.jpg
[그래프 11] 시스템 전체의 소비 전력


Radeon R9 380X

이상과 같이 라데온R9 380X를 탑재한 STRIX-R9380X-OC4G-GAMING의 성능을 벤치마크 테스트로 체크했다. 라데온R9 380의 상위 GPU로 소비 전력 증가는 억제하면서 약 10% 정도 넘는 성능을 실현한 것이 라데온R9 380X.


이 성능 향상으로 GeForce가 강세인 타이틀에서도 GeForce GTX 960을 넘어서며 풀HD(1,920×1,080)을 넘는 화면 해상도에서는 256bit 메모리 인터페이스에 의해 메모리 대역이 강점이 되어 3,840×2,160의 4K 해상도는 어렵지만 풀HD와 4K의 중간에서 게임을 즐기고 싶다면 매력적인 GPU라 볼 수 있다.


출처 - http://pc.watch.impress.co.jp/docs/topic/review/20151119_731416.html

반응형
Posted by 랩터 인터내셔널