흥미로운 한판, 샌디브릿지 2600K vs 카비레이크 7350K 성능 대결 by http://www.anandtech.com
CPU Die Size Comparison
Numbers in table are to nearest degree of known accuracy
Data from Intel or Trusted Sources (Chipworks/PCWatch) |
| CPU | Year | Process
Node | Die Size
2C or 2+2 | Die Size
4C or 4+2 | Die Size
4+3/e
(no eDRAM) | Die Size
(other) |
| Intel Kaby Lake | 2017 | 14+nm | 98.68 | 126.15 | - | |
| Intel Skylake | 2015 | 14nm | 98.57 | 122.40 | 234 | - |
| Intel Broadwell | 2014 | 14nm | 82 | *** | 241.50 | 133 (2+3)
246.24 (10C)
306.18 (15C)
456.12 (24C) |
| Intel Haswell | 2013 | 22nm | 130 | 177 | 264 | 181 (2+3)
355.52 (8C)
492 (12C)
662 (18C) |
| Intel Ivy Bridge | 2012 | 22nm | 118.09 | 159.82 | - | 256.5 (6C)
341 (10C)
541 (15C) |
| Intel Sandy Bridge | 2011 | 32nm | 149 | 216 | - | 435 (8C) |
Intel Westmere
(GPU on 45nm) | 2009 | 32nm | 81 (Core)
195* (+GPU) | 276** | - | 248 (6C)
513 (10C) |
| Intel Nehalem | 2008 | 45nm | - | 263 | - | 296 (HEDT)
684 (8C) |
| Intel Yorkfield | 2007 | 45nm | 107 | 220 | - | - |
| Intel Kentsfield | 2007 | 65nm | - | 280 | - | - |
| Intel Conroe | 2006 | 65nm | 145 | - | - | - |
인텔의 세대별 프로세서 구분, 샌디브릿지는 2011년 발표된 32나노 공정, 다이사이즈는 216 / 카비레이크는 2017년 발표된 14나노 플러스 공정, 다이사이즈는 126.15
| Intel Kaby Lake S SKUs |
| | Cores/
Threads | Base/
Turbo | IGP | L3 | eDRAM | TDP | Cost
OEM |
| i7-7700K | 4/8 | 4.2/4.5 | HD 630 | 8 MB | - | 91 W | $339 |
| i7-7700 | 4/8 | 3.6/4.2 | HD 630 | 8 MB | - | 65 W | $303 |
| i7-7700T | 4/8 | 2.9/3.8 | HD 630 | 8 MB | - | 35 W | $303 |
| i5-7600K | 4/4 | 3.8/4.2 | HD 630 | 6 MB | - | 91 W | $242 |
| i5-7600 | 4/4 | 3.5/4.1 | HD 630 | 6 MB | - | 65 W | $213 |
| i5-7600T | 4/4 | 2.8/3.7 | HD 630 | 6 MB | - | 35 W | $213 |
| i5-7500 | 4/4 | 3.4/3.8 | HD 630 | 6 MB | - | 65 W | $192 |
| i5-7500T | 4/4 | 2.7/3.3 | HD 630 | 6 MB | - | 35 W | $192 |
| i5-7400 | 4/4 | 3.0/3.5 | HD 630 | 6 MB | - | 65 W | $182 |
| i5-7400T | 4/4 | 2.4/3.0 | HD 630 | 6 MB | - | 35 W | $182 |
| i3-7350K | 2/4 | 4.2 | HD 630 | 4 MB | - | 60 W | $168 |
| i3-7320 | 2/4 | 4.1 | HD 630 | 4 MB | - | 51 W | $149 |
| i3-7300 | 2/4 | 4.0 | HD 630 | 4 MB | - | 51 W | $138 |
| i3-7300T | 2/4 | 3.5 | HD 630 | 4 MB | - | 35 W | $138 |
| i3-7100 | 2/4 | 3.9 | HD 630 | 3 MB | - | 51 W | $117 |
| i3-7100T | 2/4 | 3.4 | HD 630 | 3 MB | - | 35 W | $117 |
| G4620 | 2/4 | 3.7 | HD 630 | 3 MB | - | 51 W | $86 |
| G4600 | 2/4 | 3.6 | HD 630 | 3 MB | - | 51 W | $75 |
| G4600T | 2/4 | 3.0 | HD 630 | 3 MB | - | 35 W | $75 |
| G4560 | 2/4 | 3.5 | HD 610 | 3 MB | - | 54 W | $64 |
| G4560T | 2/4 | 2.9 | HD 610 | 3 MB | - | 35 W | $64 |
| G3950 | 2/2 | 3.0 | HD 610 | 2 MB | - | 51 W | $52 |
| G3930 | 2/2 | 2.9 | HD 610 | 2 MB | - | 51 W | $42 |
| G3930T | 2/2 | 2.7 | HD 610 | 2 MB | - | 35 W | $42 |
인텔 카비레이크 프로세서 라인업
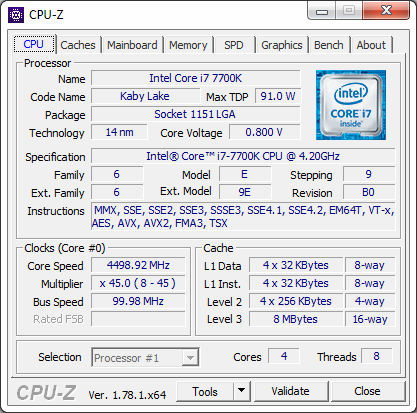
i3-7350K는 듀얼코어에 SMT 지원으로 4스레드 동작, 배수락 해제, 4.2 동작클럭, L3 캐시 4MB, HD 630 내장그래픽, TDP 60와트, 가격은 168달러
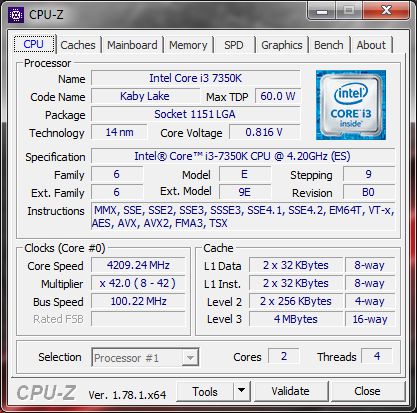
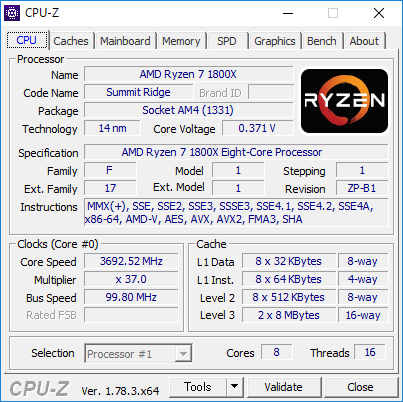
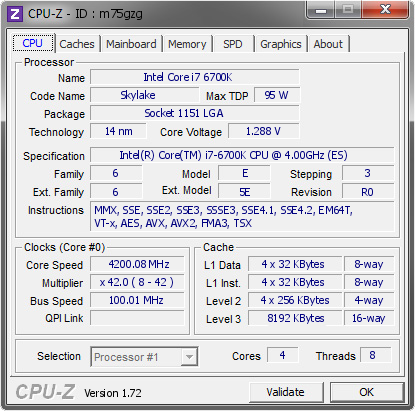
7350K CPU-Z 확인, 상기 스펙 동일
Kaby Lake i3 vs Sandy Bridge i7 Comparison
Launch Pricing |
| CPU | Year | Cores
Threads | Freq | Turbo | L3 | IGP | DRAM | TDP | Price |
| Core i3-7350K | 2017 | 2/4 | 4.2 | - | 4MB | HD 630 | DDR4-2400 | 60W | $168 |
| Core i7-2600K | 2011 | 4/8 | 3.4 | 3.8 | 8MB | HD 3000 | DDR3-1333 | 95W | $317 |
샌디브릿지 2600K는 과거의 하이엔드 프로세서로 4코어 8스레드, 3.4 동작클럭, L3 캐시 8MB, TDP 95W, 가격은 317달러, 7350K는 반값 정도인 168달러
[ 테스트 시스템 ]
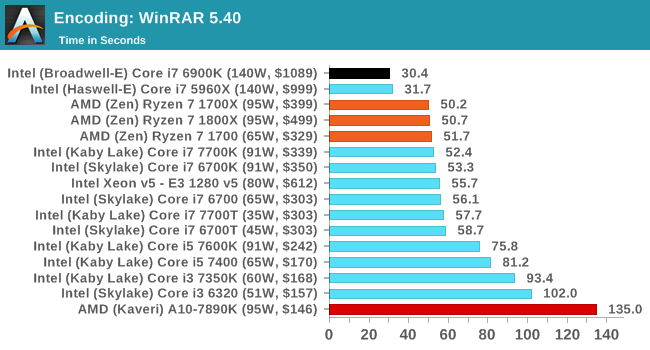
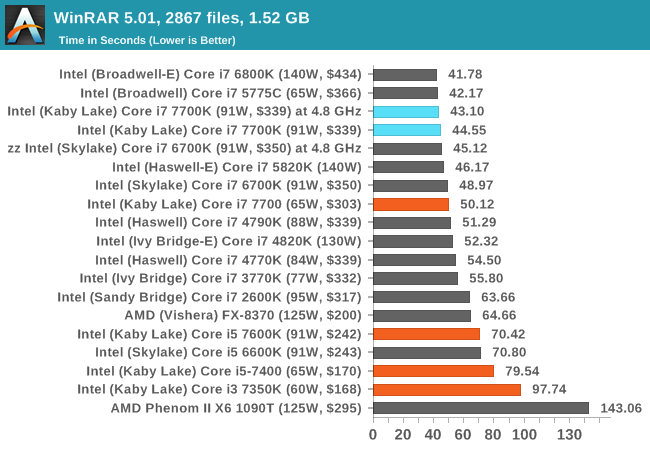
WinRAR 5.0.1: link
Our WinRAR test from 2013 is updated to the latest version of WinRAR at the start of 2014. We compress a set of 2867 files across 320 folders totaling 1.52 GB in size – 95% of these files are small typical website files, and the rest (90% of the size) are small 30 second 720p videos.
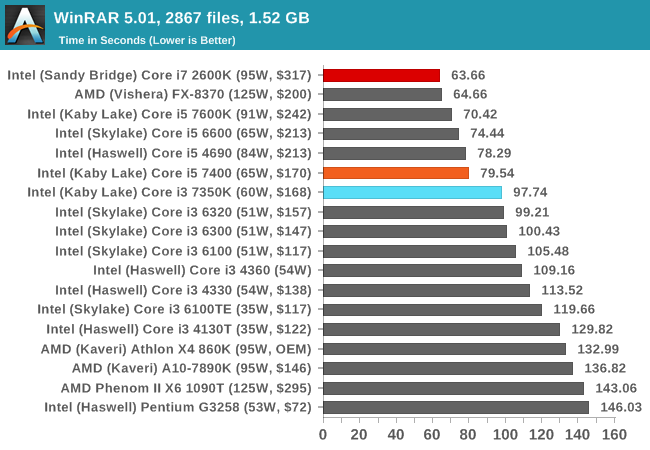
WinRAR is more geared towards a variable threaded environment but also memory speed. The fact that the Core i5 is above the Core i3 shows that having actual cores helps, regardless of frequency - the additional hyperthreads for the Core i7-2600K also gives it the win, despite the memory frequency difference.
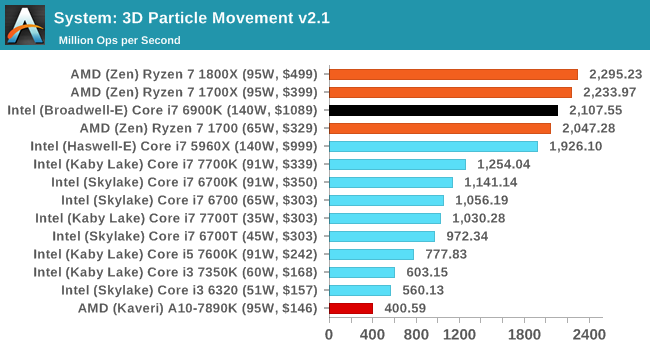
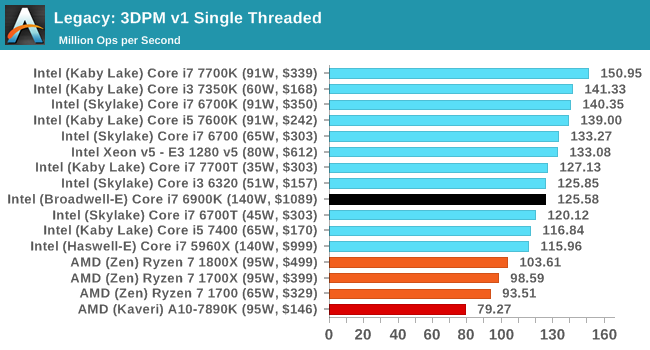
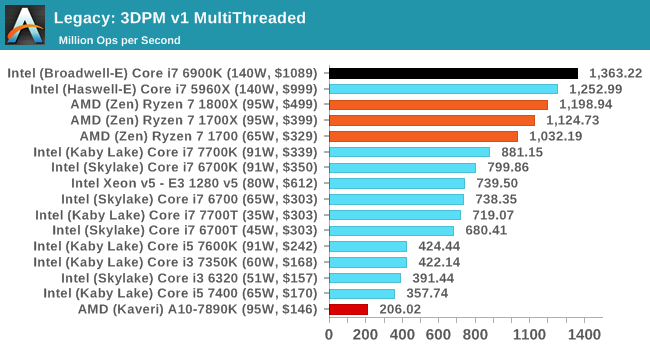
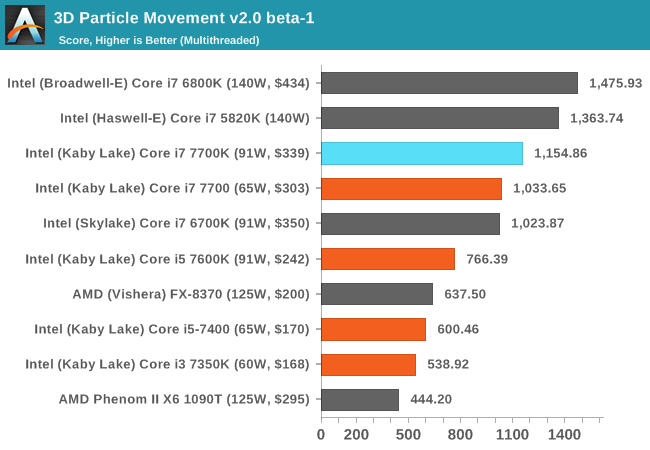
3D Particle Movement v2
3DPM is a self-penned benchmark, taking basic 3D movement algorithms used in Brownian Motion simulations and testing them for speed. High floating point performance, MHz and IPC wins the day. This is the second variant of this benchmark, fixing for false sharing in the first version, and lending itself to better multithreaded performance.
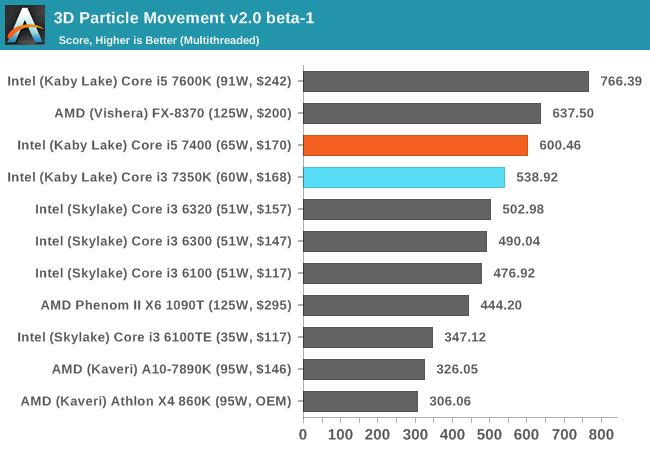
3DPMv2 is still new, so we don’t have too many results for it so far - but again this is another situation where having actual cores helps. This is typically when the threads are 'heavy', i.e. spill out into various caches and require more than 1/2 the cache shared within a core each. In the case of the Kaby Lake, this means that each core has 32KB of L1 - or 32KB per thread for the i5 but only 16KB per thread in the i3.
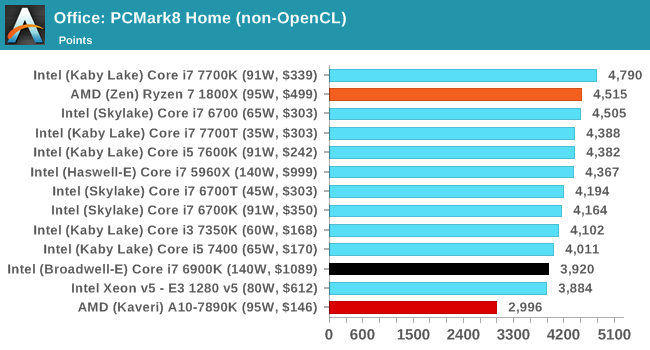
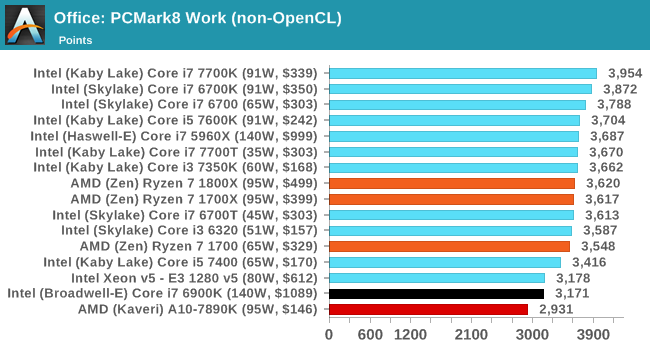
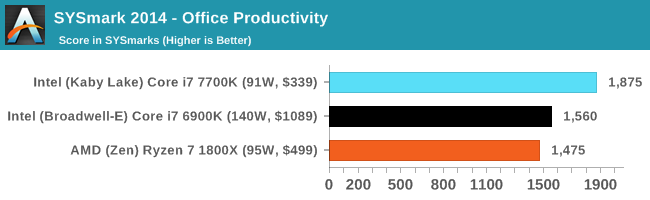
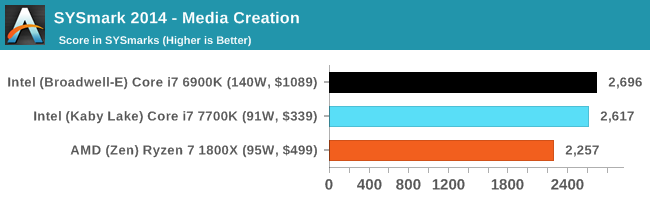
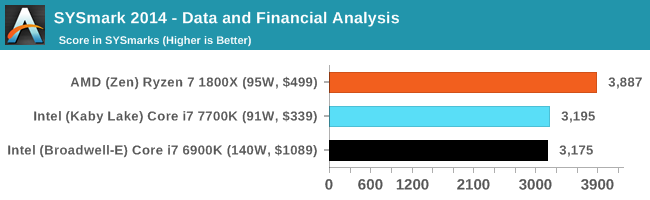
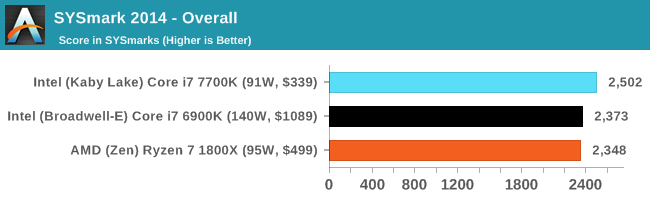
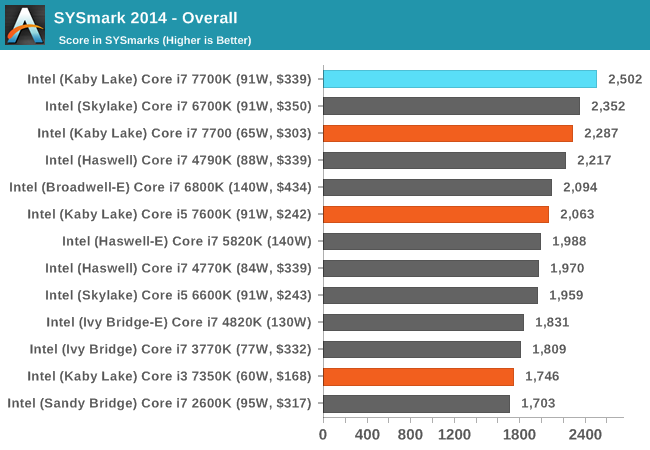
SYSMark 2014
Engineered by BAPco (to which Intel is a consortium member), this set of tests are designed to be an office/data/media/financial range of tests using common well-known CAD, image editing, web browsing and other tools to put out a score, where a score of 1000 is attributed to an old Core i3 using a mechanical harddrive. Here we report the overall score, however the test breakdowns can be found in Bench.
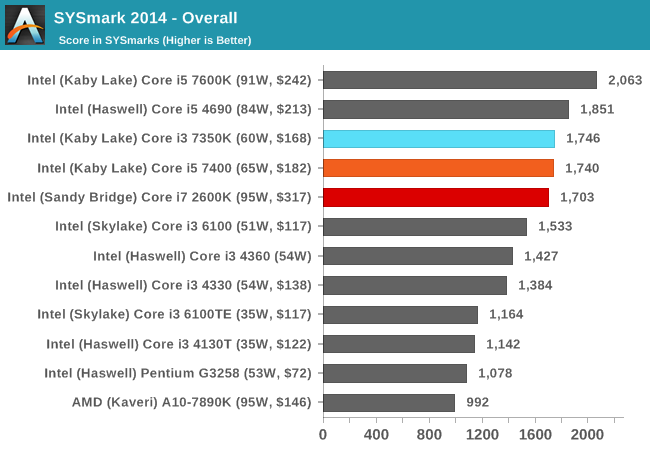
Because SYSMark is a variety of tests that rely on response and throughput, here is where the Core i3 comes into play over the i5 and i7-2600K. With the i5 it's about equal, but the years of IPC increases put the i7-2600K now behind the Kaby i3.
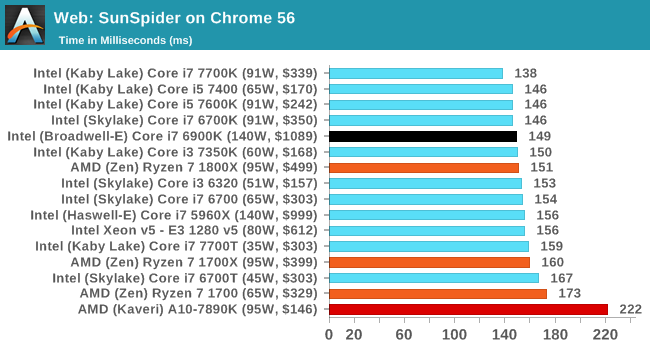
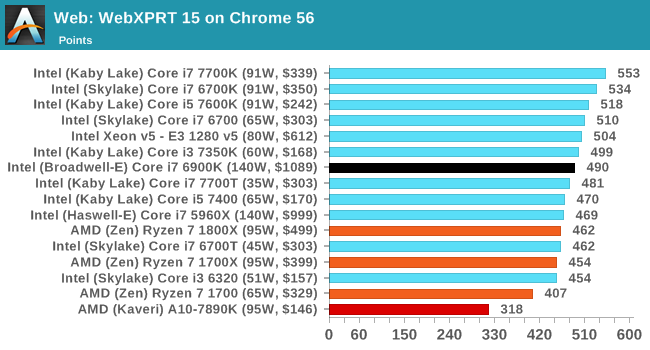
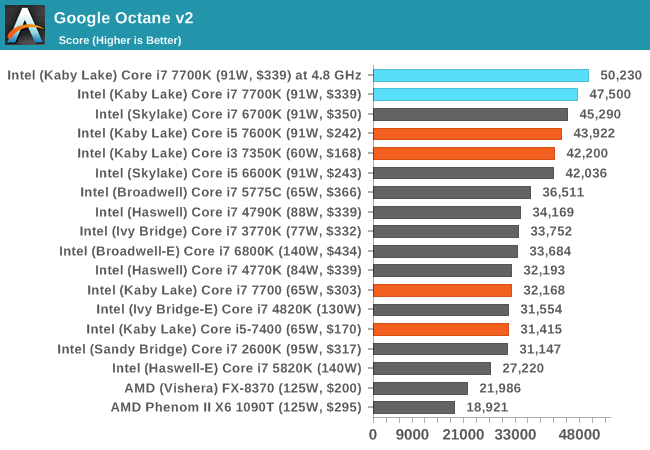
Web Benchmarks
On the lower end processors, general usability is a big factor of experience, especially as we move into the HTML5 era of web browsing. For our web benchmarks, we take well-known tests with Chrome as installed by SYSMark as a consistent browser.
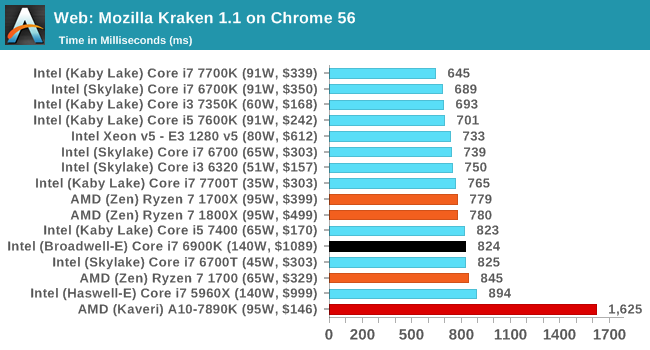
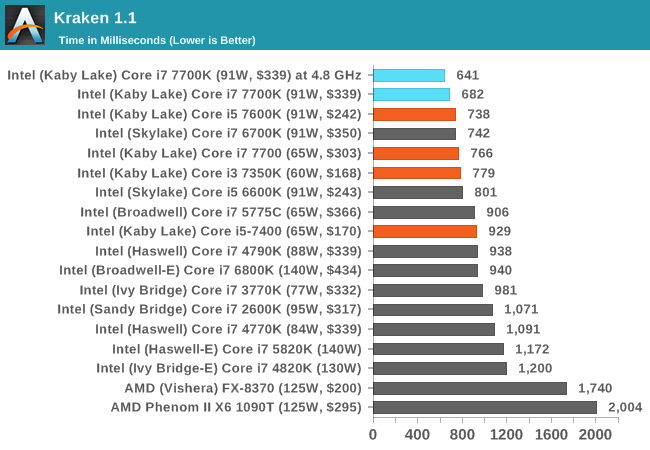
Mozilla Kraken 1.1
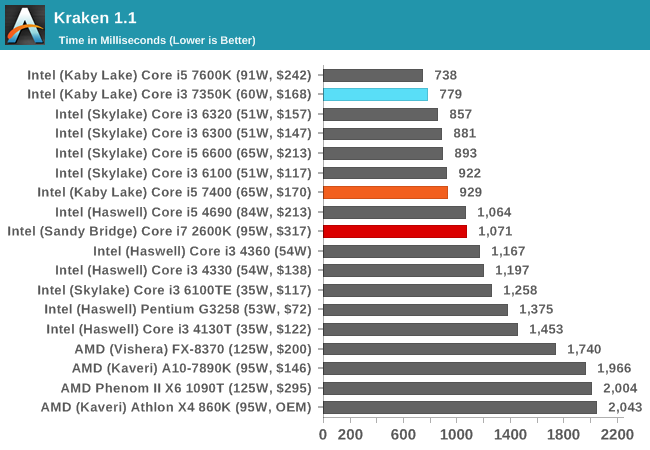
Kraken favors high frequency and IPC, so the i3 takes a large lead over the i7-2600K for this sort of workload
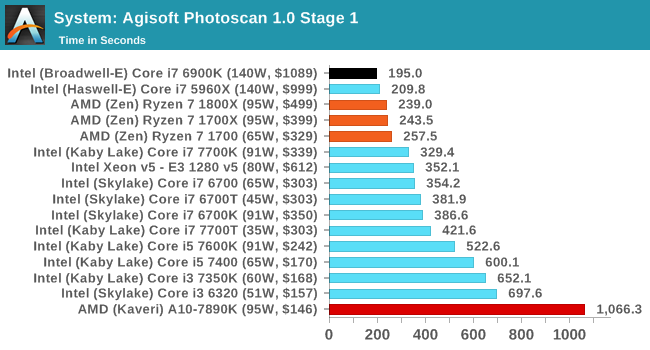
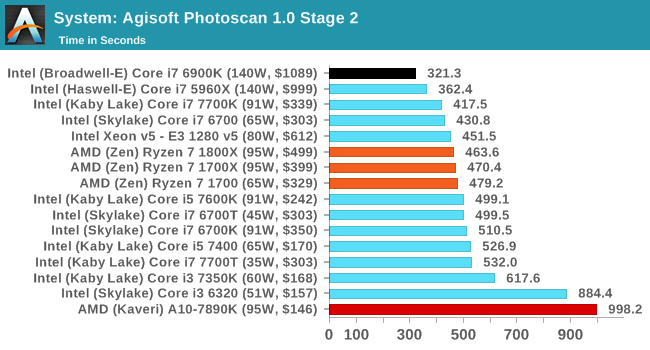
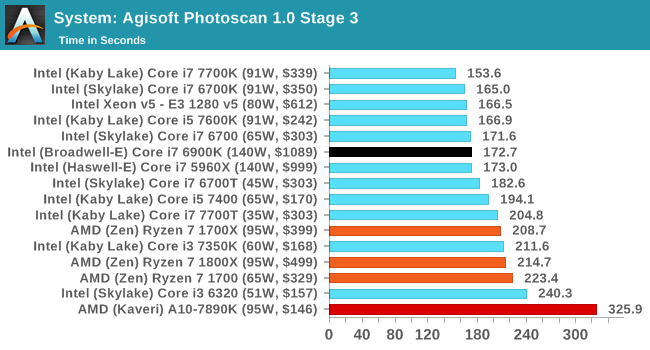
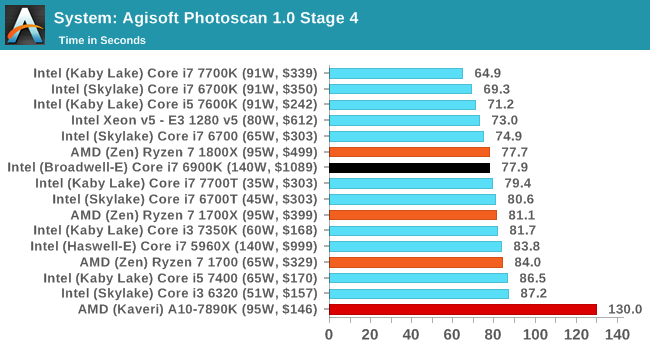
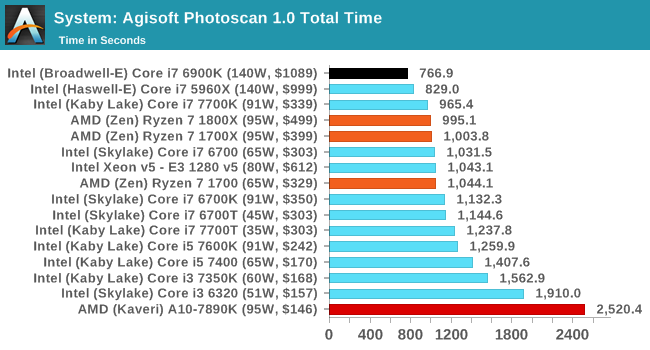
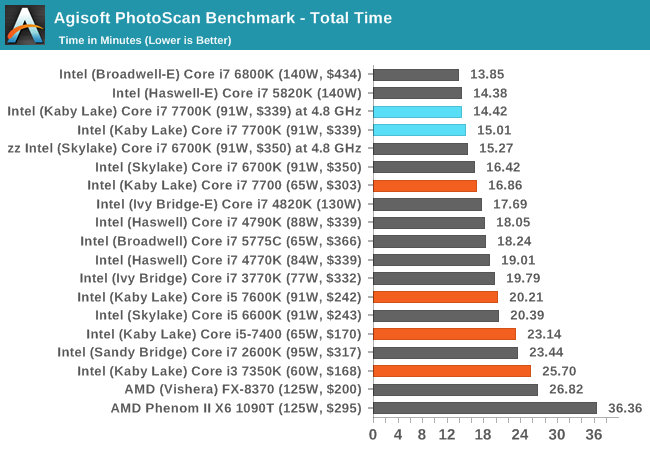
Agisoft Photoscan – 2D to 3D Image Manipulation: link
Agisoft Photoscan creates 3D models from 2D images, a process which is very computationally expensive. The algorithm is split into four distinct phases, and different phases of the model reconstruction require either fast memory, fast IPC, more cores, or even OpenCL compute devices to hand. Agisoft supplied us with a special version of the software to script the process, where we take 50 images of a stately home and convert it into a medium quality model. This benchmark typically takes around 15-20 minutes on a high-end PC on the CPU alone, with GPUs reducing the time.
Here we report the overall time to complete the test – sub-test results can be found in Bench.
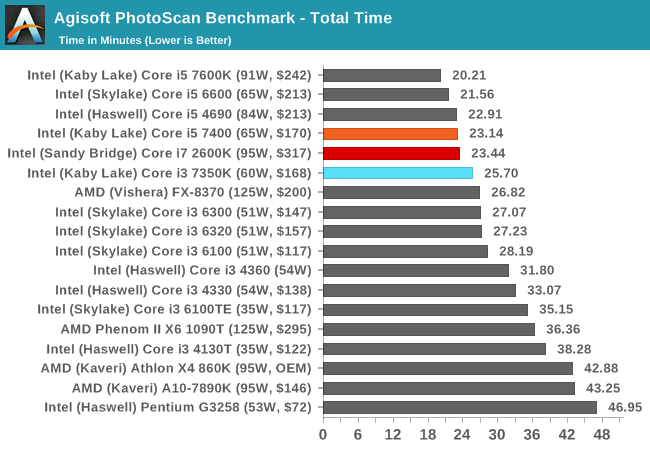
Photoscan is a mix of single and multi-threaded segments, but overall the extra cores in the i5/i7 beat the Core i3, but not by much.
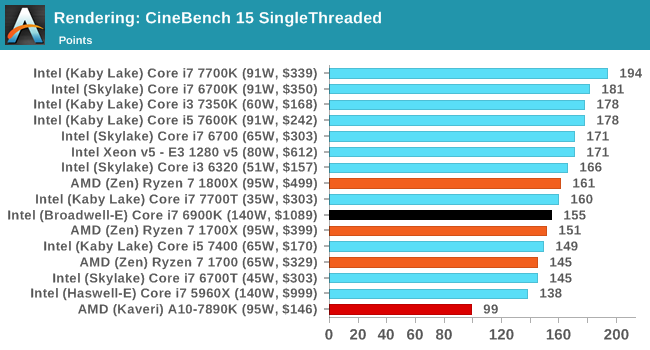
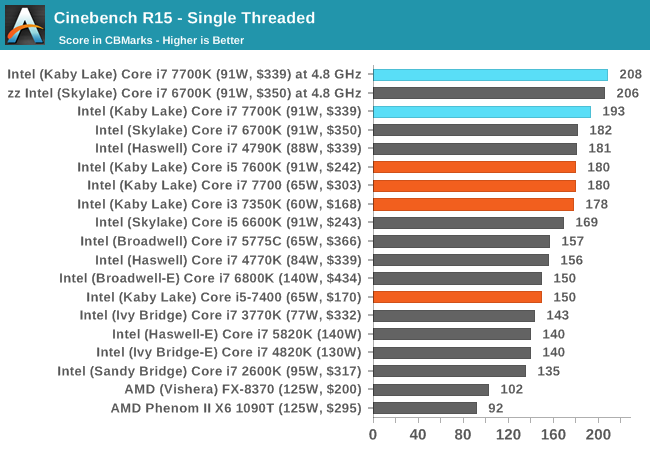
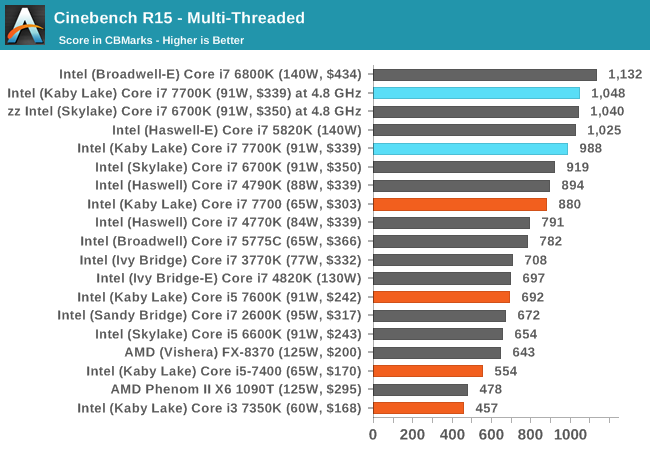
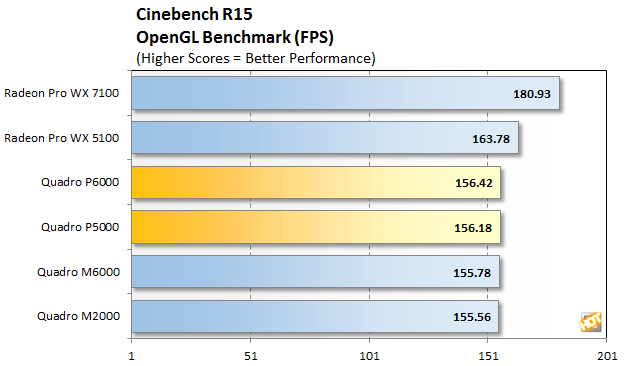
Cinebench R15
Cinebench is a benchmark based around Cinema 4D, and is fairly well known among enthusiasts for stressing the CPU for a provided workload. Results are given as a score, where higher is better.
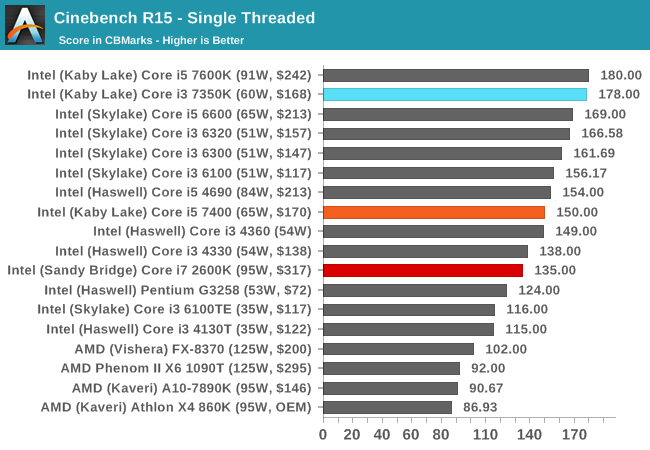
All the Kaby Lake processors seem to do well in CB15 single threaded performance, given that all the K-processors can reach 4.2 GHz or higher one way or another. Nonetheless, the age of the Core i7-2600K is showing here.
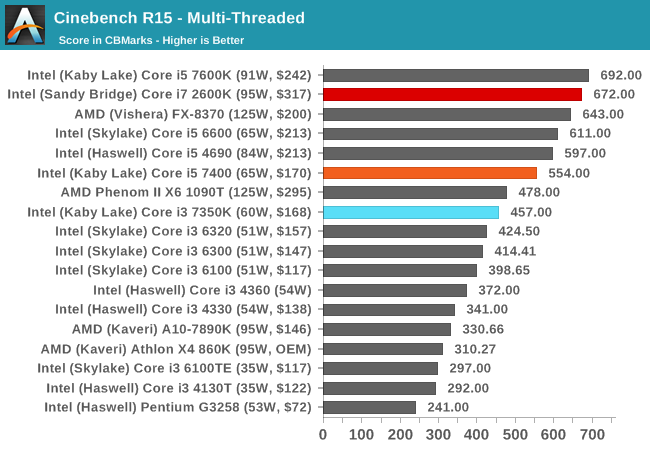
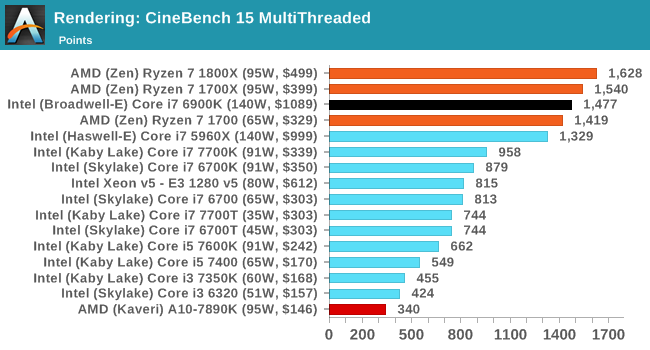
Turning the tables with actual cores, and the Core i7-2600K gets a significant leg up here. The Core i5 also sits above the Core i3.
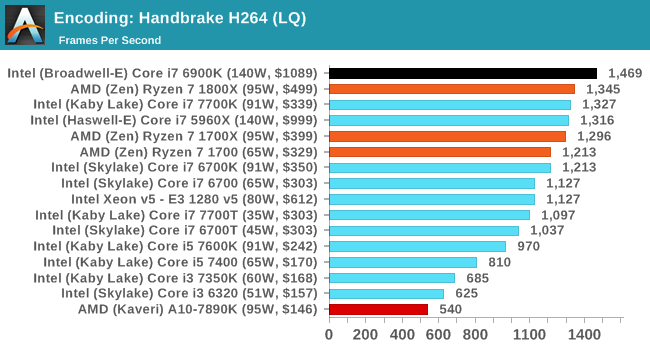
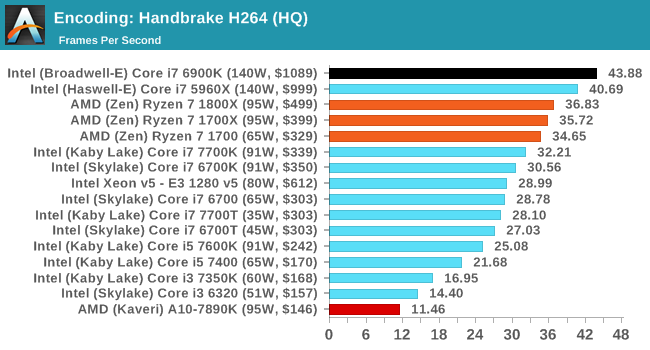
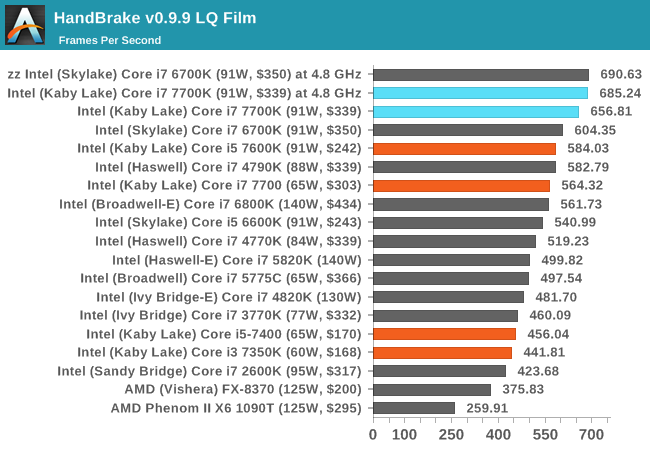
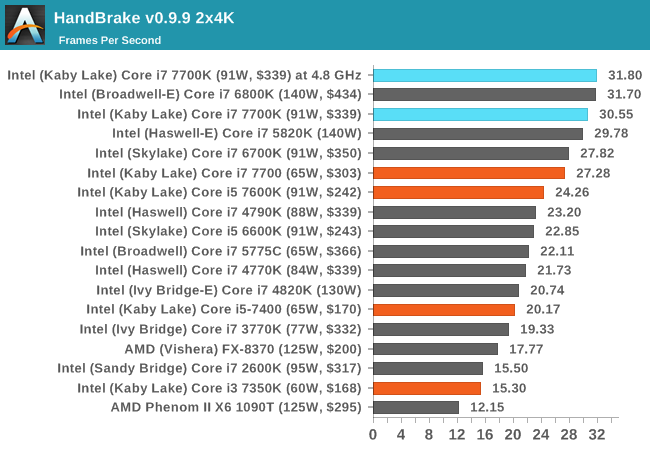
HandBrake v0.9.9: link
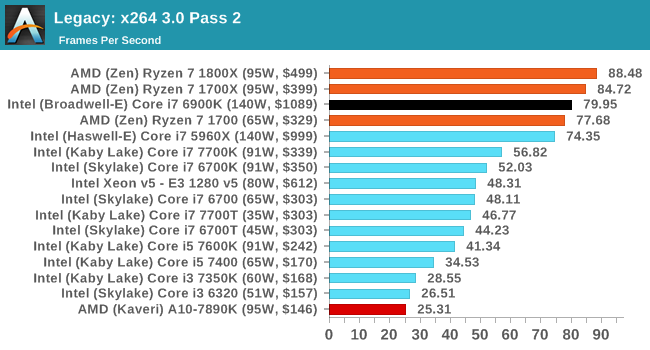
For HandBrake, we take two videos (a 2h20 640x266 DVD rip and a 10min double UHD 3840x4320 animation short) and convert them to x264 format in an MP4 container. Results are given in terms of the frames per second processed, and HandBrake uses as many threads as possible.
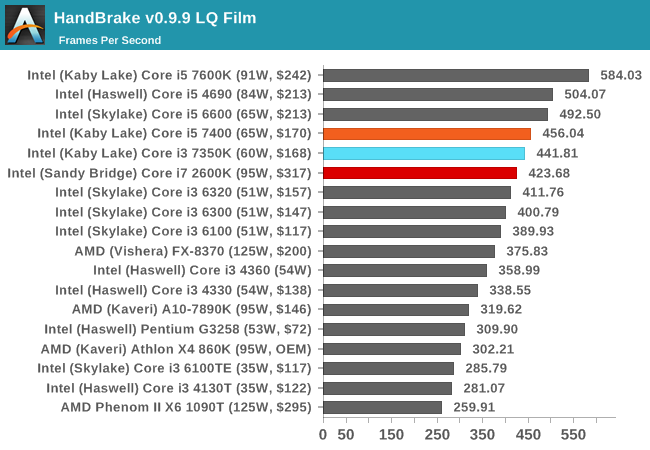
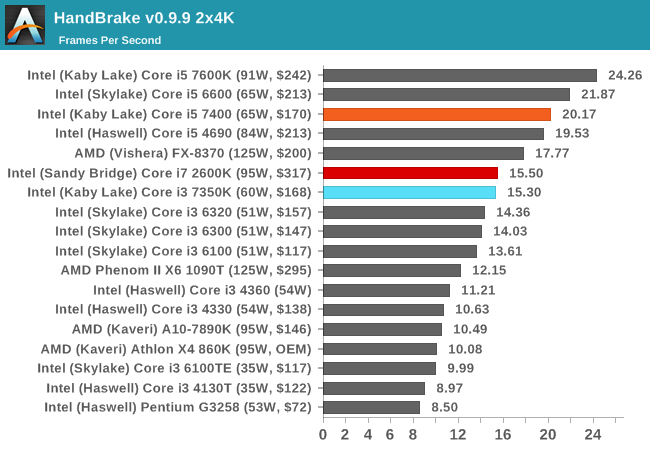
For video conversion, having small frames puts all three CPUs in a similar spot. But ramp up the frame size and we see the Kaby Lake i5 pull ahead due to IPC and instructions. The Core i3 has enough oomph to match the extra threads on the Core i7-2600K though.
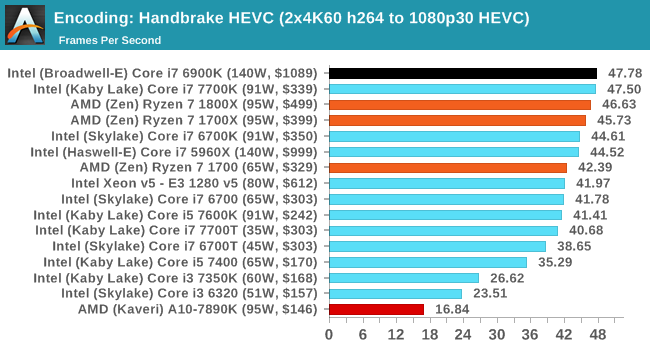
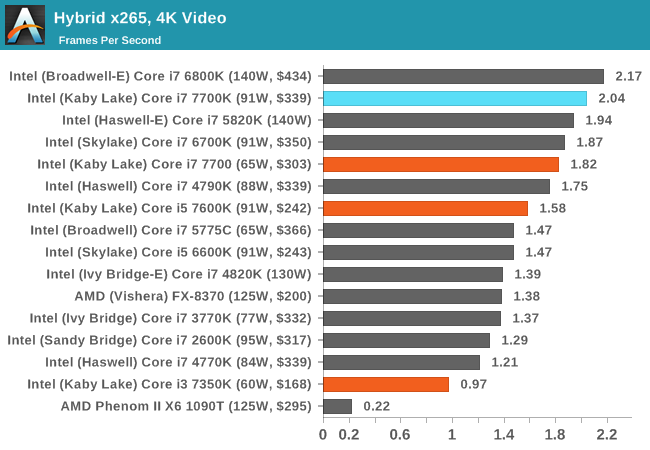
Hybrid x265
Hybrid is a new benchmark, where we take a 4K 1500 frame video and convert it into an x265 format without audio. Results are given in frames per second.
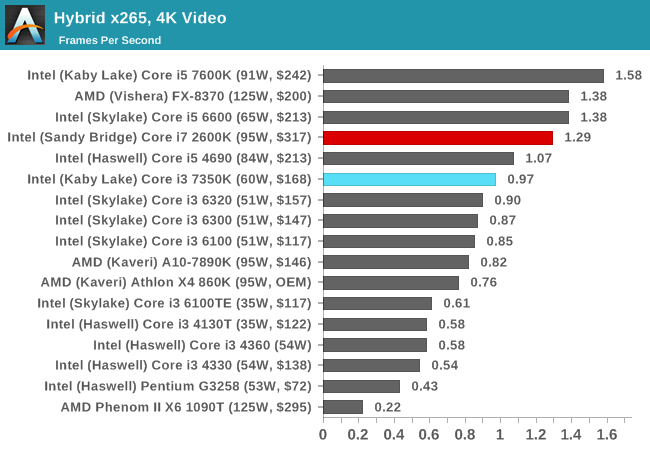
With a different video conversion tool and render, the extra cores and threads of the Core i7 is more than enough to give it a 30% advantage over the Core i3-7350K. It makes me wonder if another +30% frequency would help the Core i3.
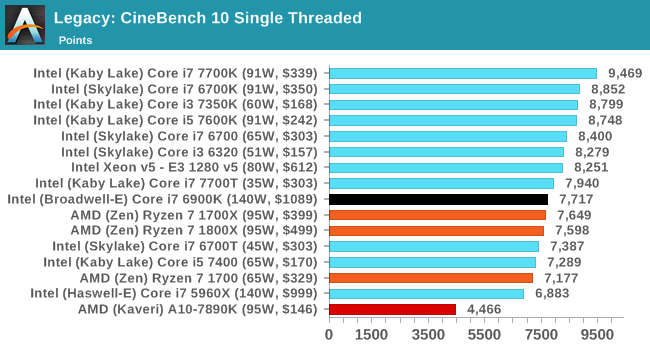
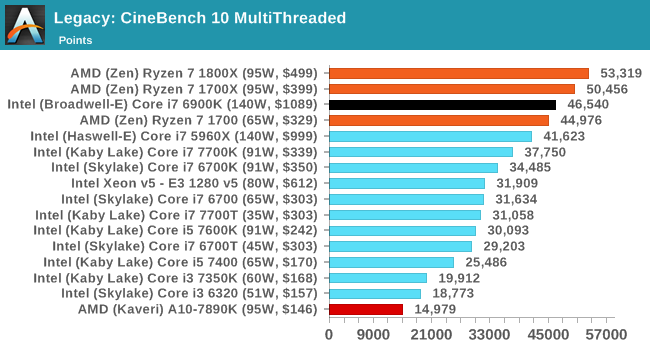
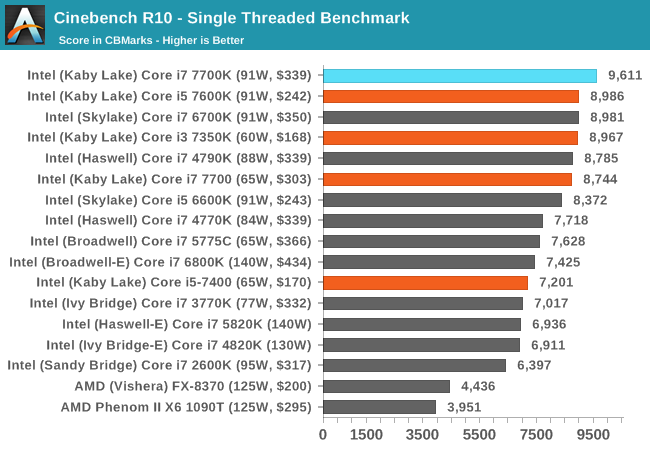
Cinebench R10
The R10 version of Cinebench is one of our oldest benchmarks, with data going back more than a few generations. The benchmark is similar to that of the newest R15 version, albeit with a simpler render target and a different strategy for multithreading.
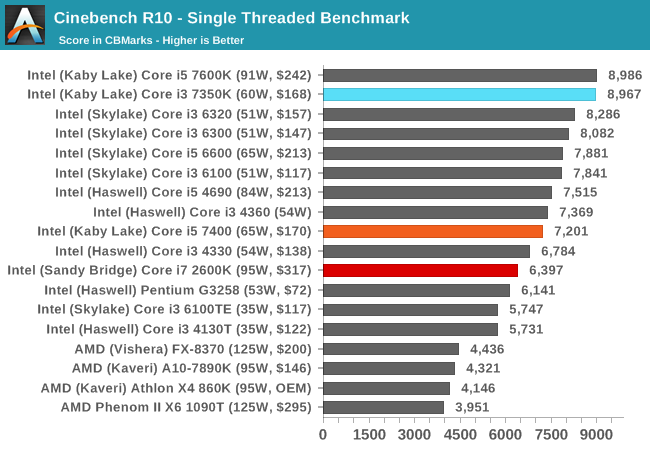
With high frequency in tow, the Core i3-7350K makes its mark.
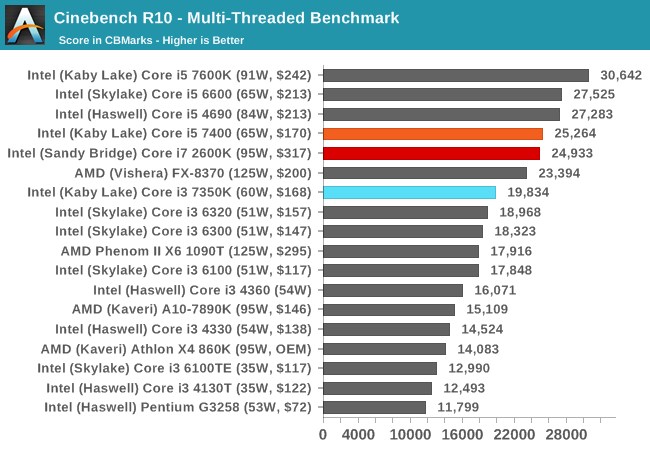
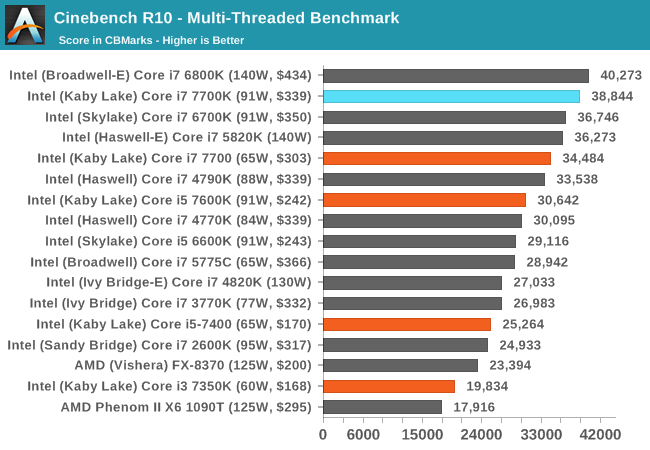
When more threads come to play, the Core i5-7400 and Core i7-2600K battle it out in terms of four cores and IPC vs hyperthreading. The Core i3-7350K sits around ~25% behind.
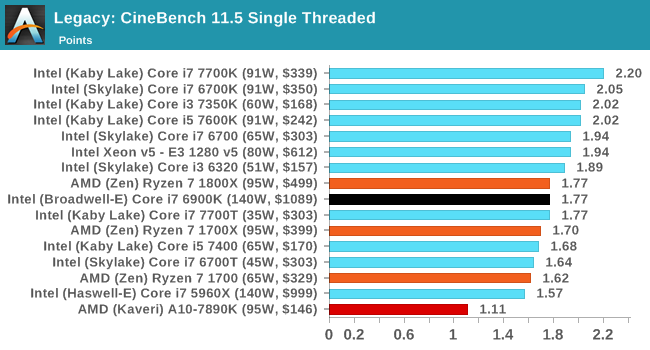
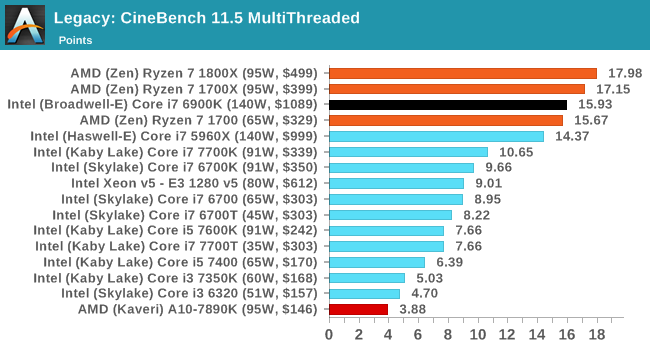
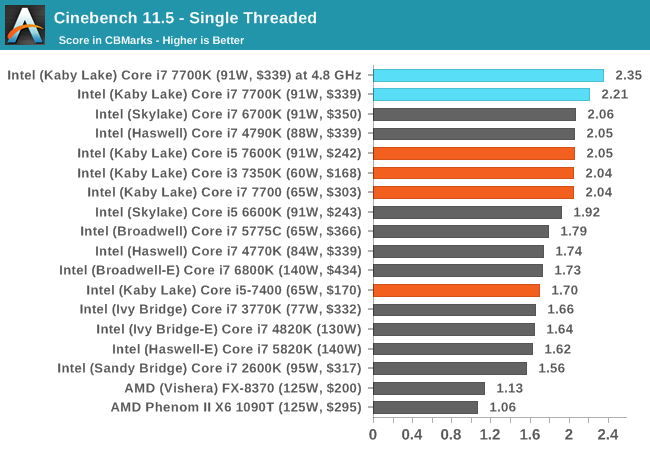
Cinebench R11.5
CB11.5 has been popular for many years as a performance test, using easy to read and compare numbers that aren’t in the 1000s. We run the benchmark in an automated fashion three times in single-thread and multi-thread mode and take the average of the results.
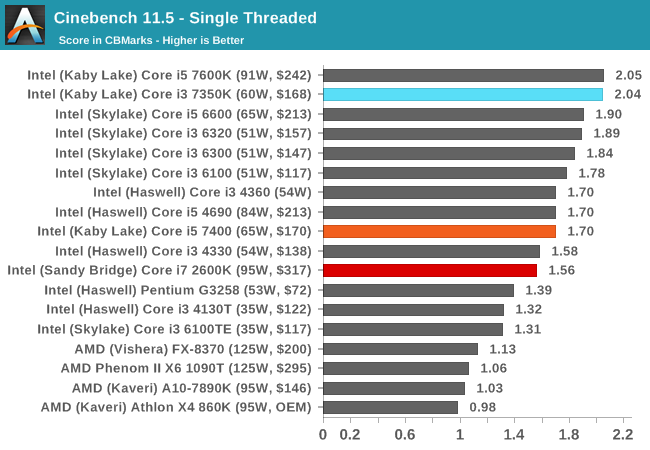

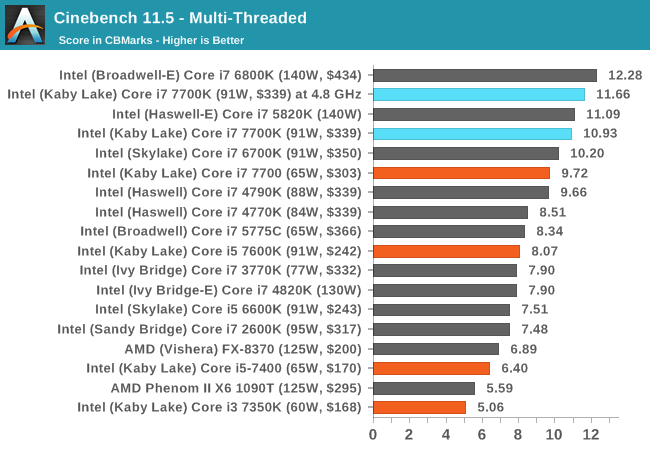
Similar to CB10, the single thread results show that a 4.2 GHz Kaby Lake is nothing to be sniffed at. In the multithreaded test, CB11.5 is more able to leverage the hyperthreads, showing that a Core i7-2600K will run rings around the low end Kaby i5, but is bested by the higher frequency Kaby i5-K. The Core i3 still has that dual core deficit.
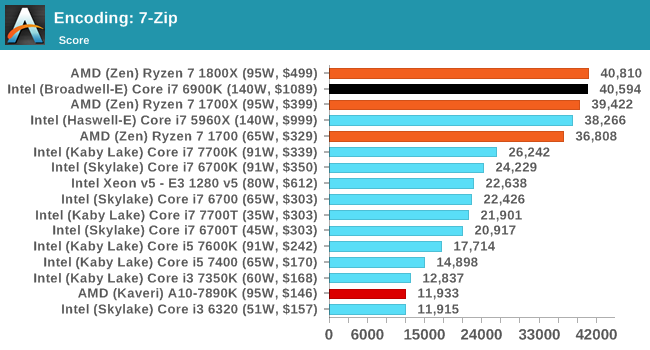
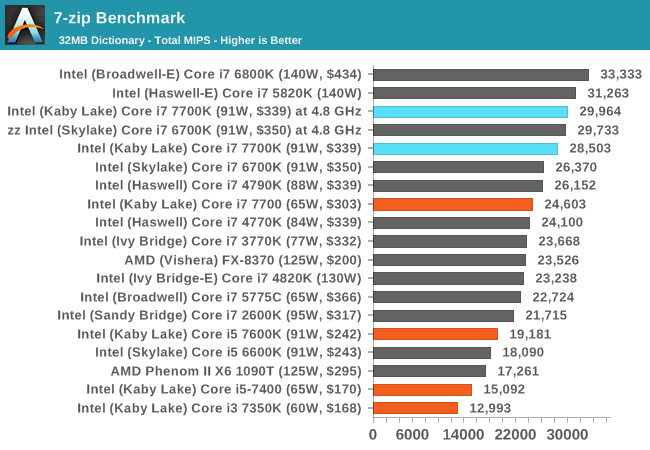
7-zip
As an open source compression/decompression tool, 7-zip is easy to test and features a built-in benchmark to measure performance. As a utility, similar to WinRAR, high thread counts, frequency and UPC typically win the day here.
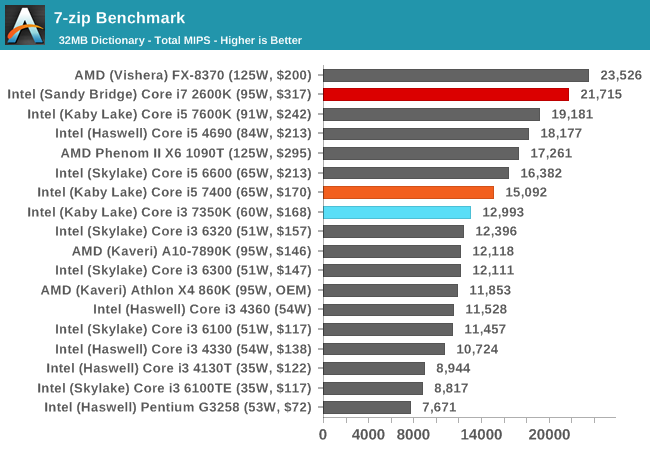
The difference between the i3-7350K and the i5-7400 shows that 7-zip prefers cores over threads, but the Core i7-2600K results show it can use both to good effect, even on older microarchitectures, scoring almost double the i3-7350K.
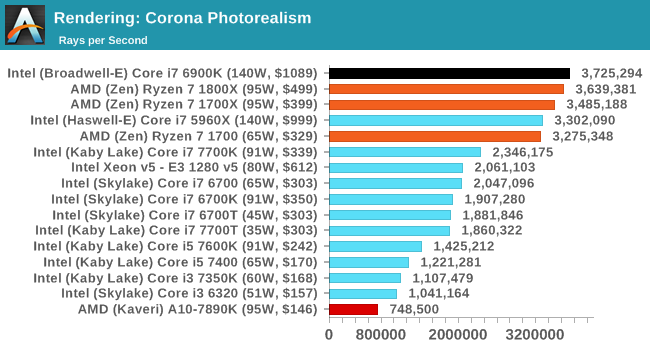
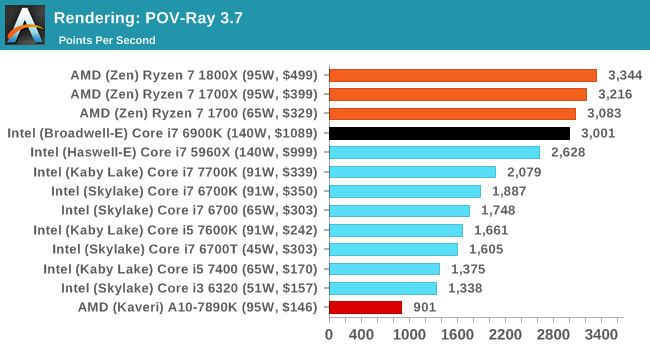
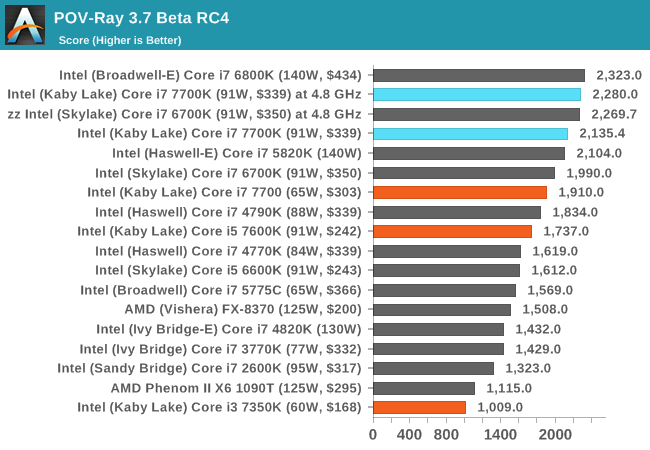
POV-Ray
Ray-tracing is a typical multithreaded test, with each ray being a potential thread in its own right ensuring that a workload can scale in complexity easily. This lends itself to cores, frequency and IPC: the more, the better.
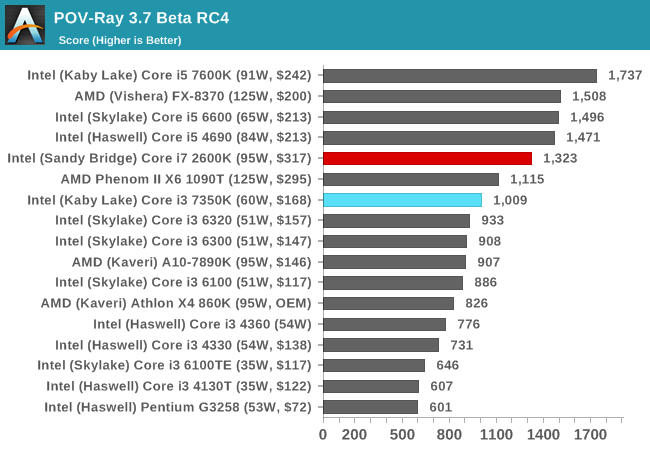
POV-Ray is a benchmark that is usually touted as liking high IPC, high frequency and more threads. The i7-2600K, despite having double the resources of the Core i3-7350K, is only 30% ahead.
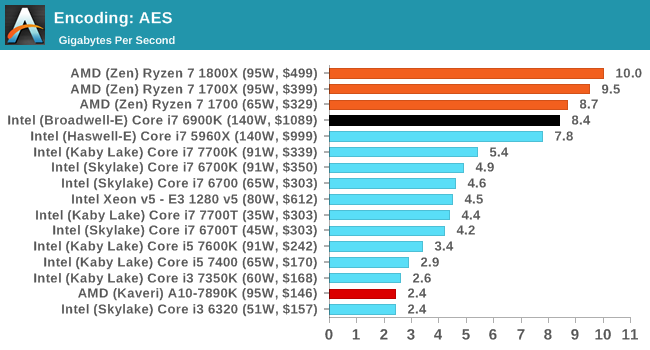
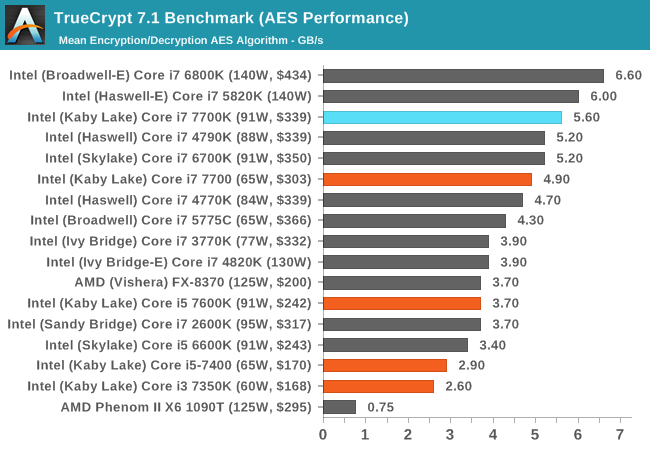
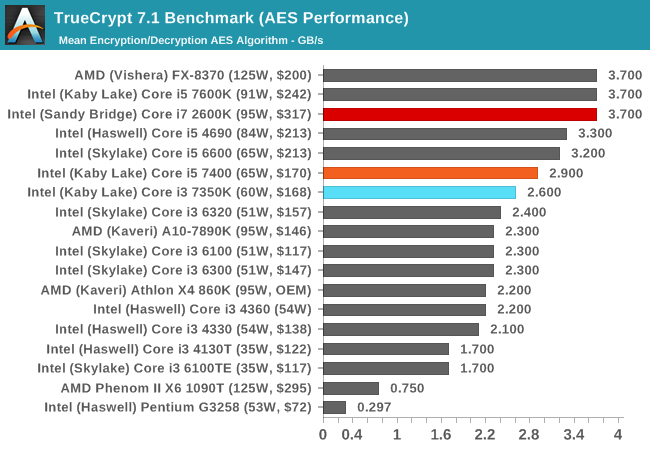
AES via TrueCrypt
Despite TrueCrypt no longer being maintained, the final version incorporates a good test to measure different encryption methodologies as well as encryption combinations. When TrueCrypt was in full swing, the introduction of AES accelerated hardware dialed the performance up a notch, however most of the processors (save the Pentiums/Celerons) now support this and get good speed. The built-in TrueCrypt test does a mass encryption on in-memory data, giving results in GB/s.
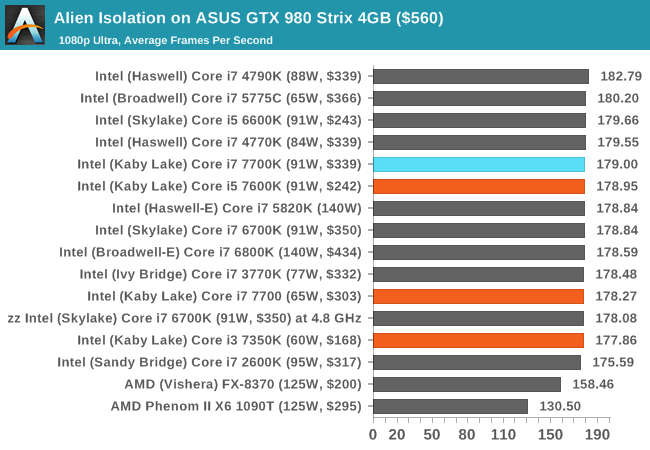
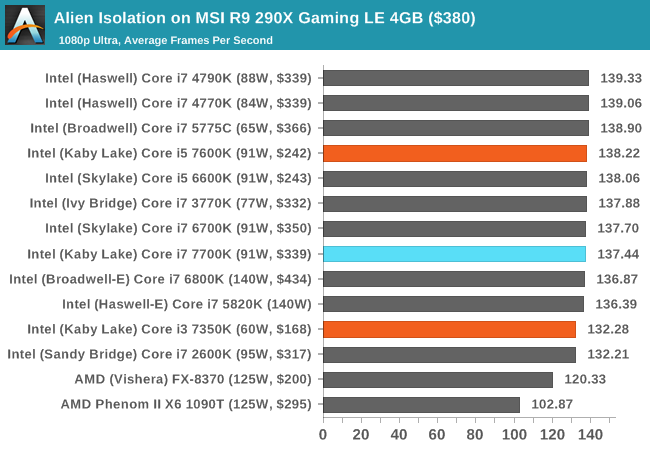
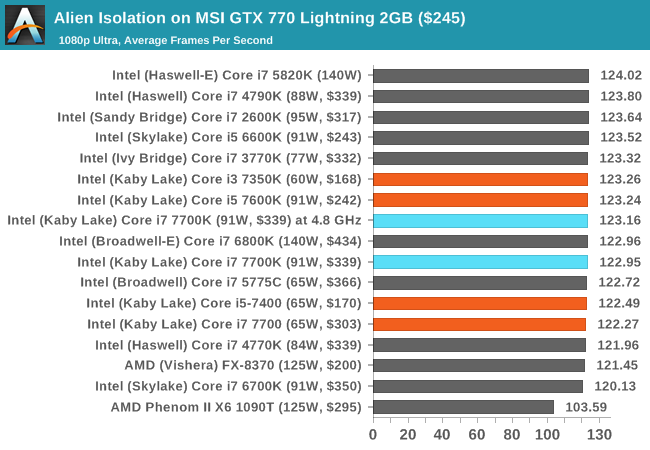
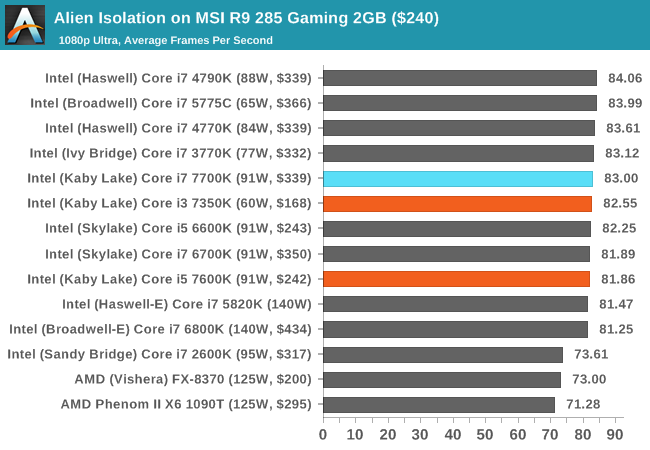
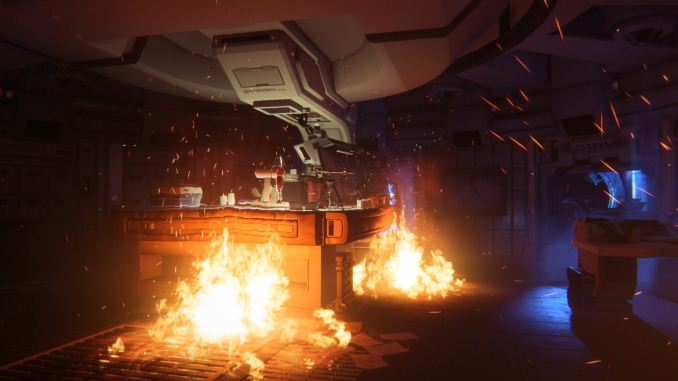
Alien: Isolation
If first person survival mixed with horror is your sort of thing, then Alien: Isolation, based off of the Alien franchise, should be an interesting title. Developed by The Creative Assembly and released in October 2014, Alien: Isolation has won numerous awards from Game Of The Year to several top 10s/25s and Best Horror titles, ratcheting up over a million sales by February 2015. Alien: Isolation uses a custom built engine which includes dynamic sound effects and should be fully multi-core enabled.
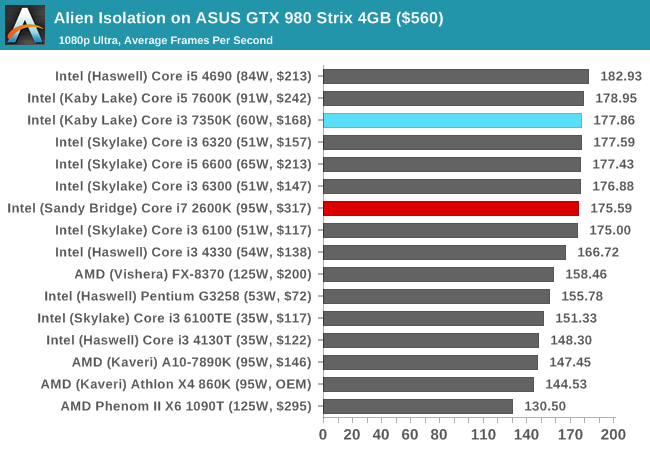
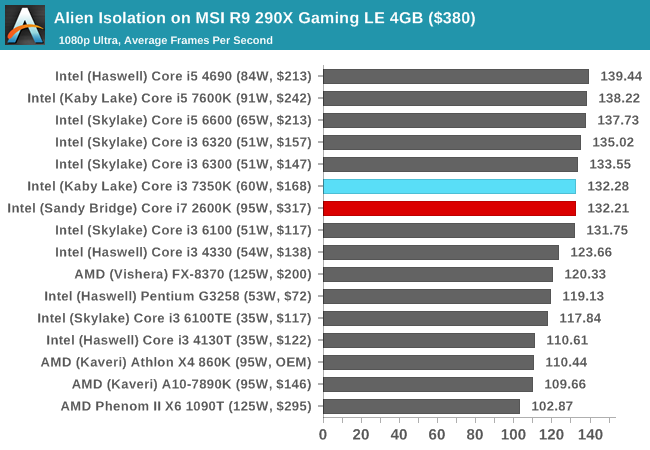
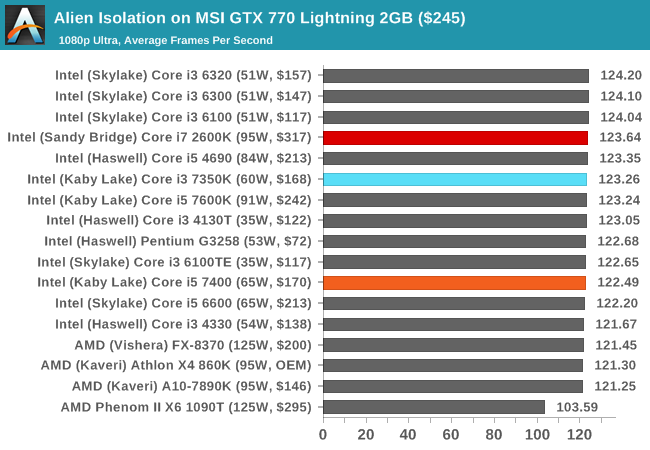
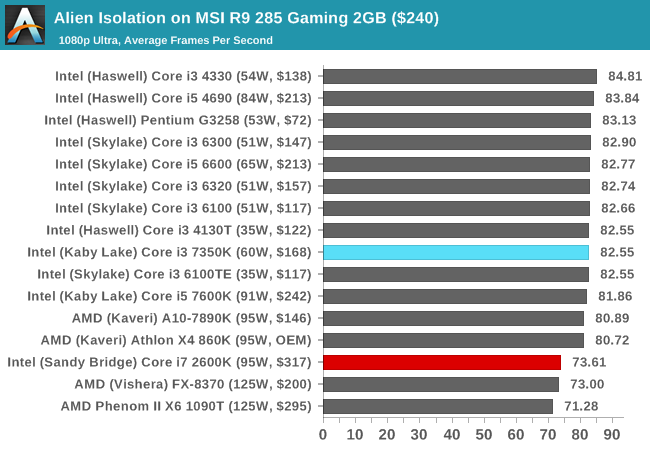
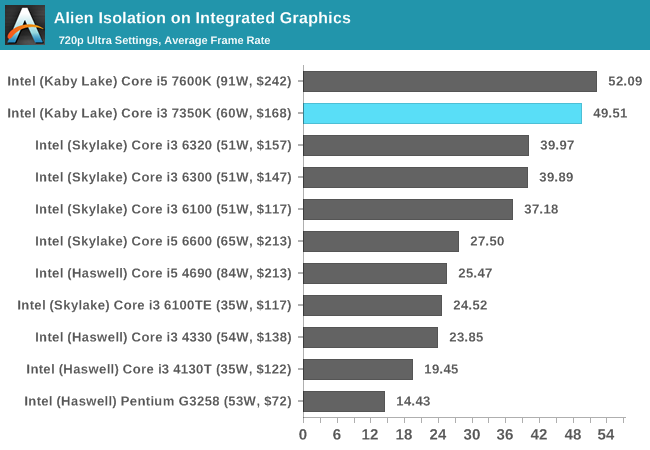
Aside from a small dip by the Core i7-2600K when using the R9 285, the i3-7350K matches the other CPUs in Alien Isolation.
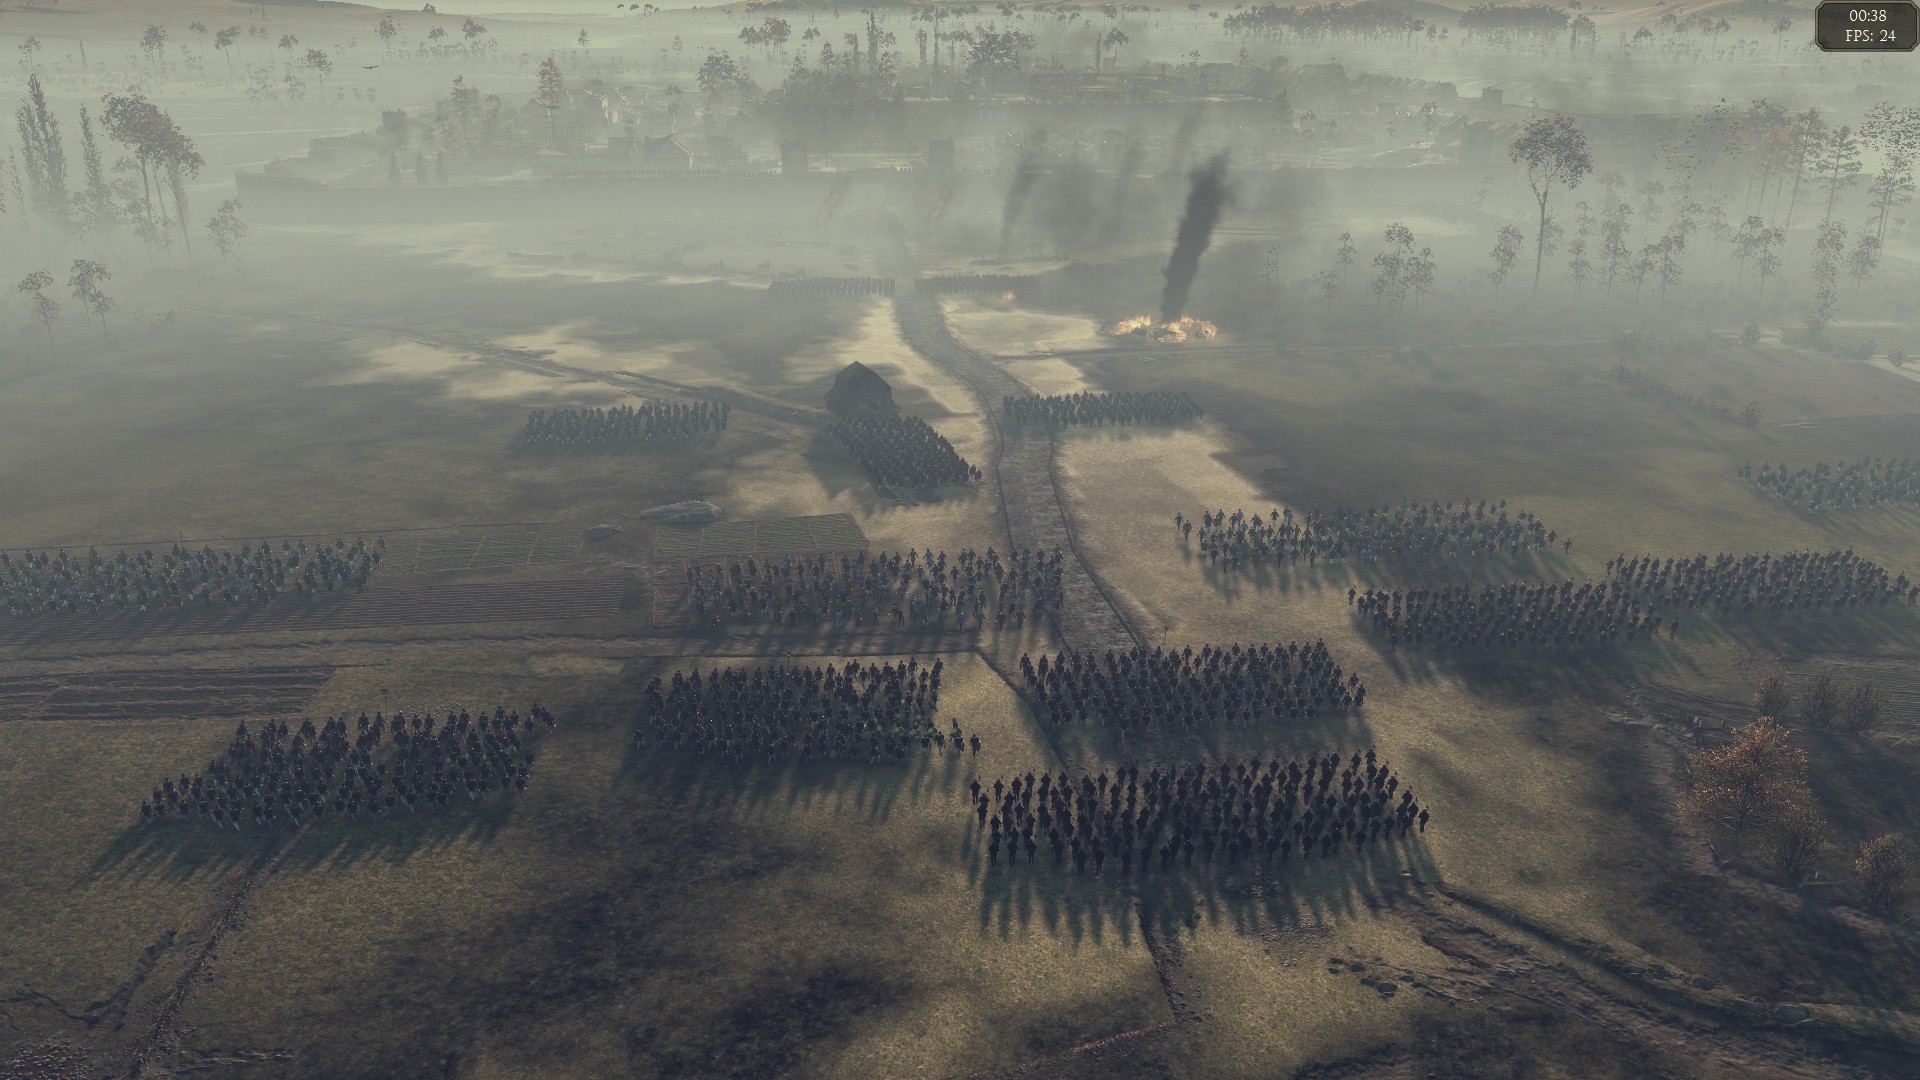
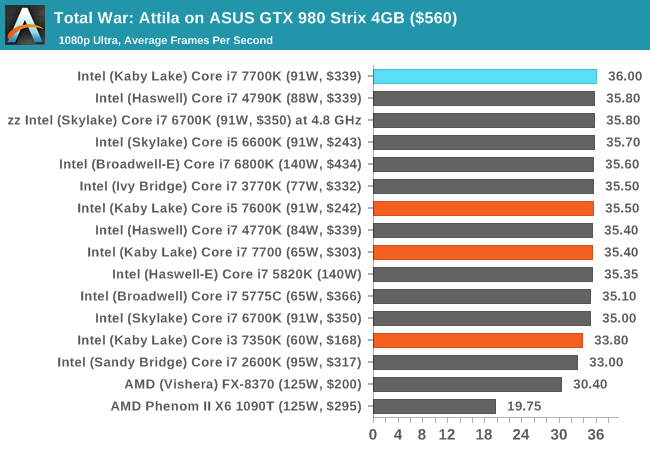
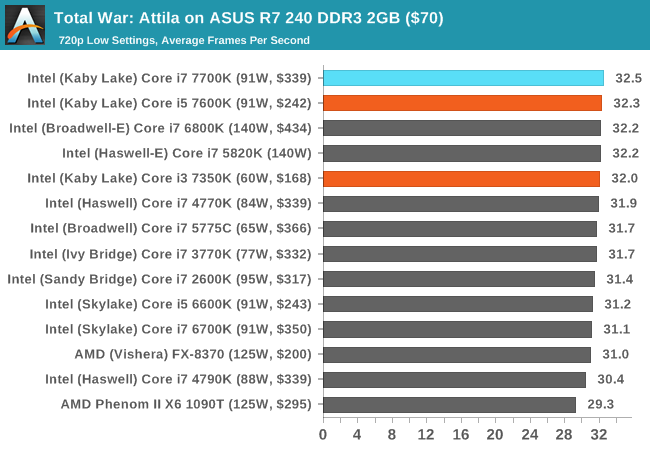
Total War: Attila
The Total War franchise moves on to Attila, another The Creative Assembly development, and is a stand-alone strategy title set in 395AD where the main story line lets the gamer take control of the leader of the Huns in order to conquer parts of the world. Graphically the game can render hundreds/thousands of units on screen at once, all with their individual actions and can put some of the big cards to task.
For low end graphics, we test at 720p with performance settings, recording the average frame rate. With mid and high range graphics, we test at 1080p with the quality setting. In both circumstances, unlimited video memory is enabled and the in-game scripted benchmark is used.
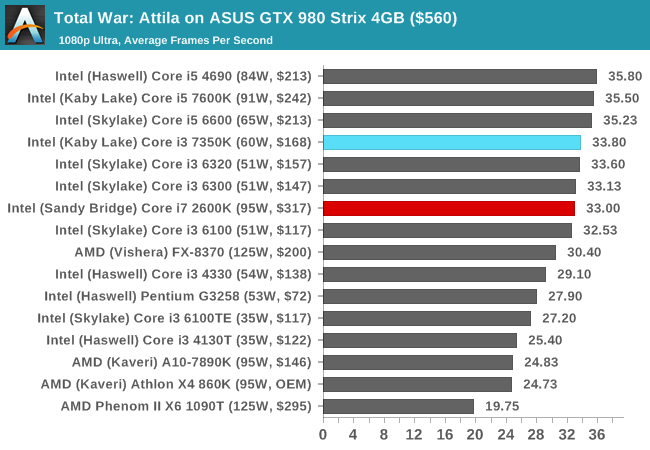
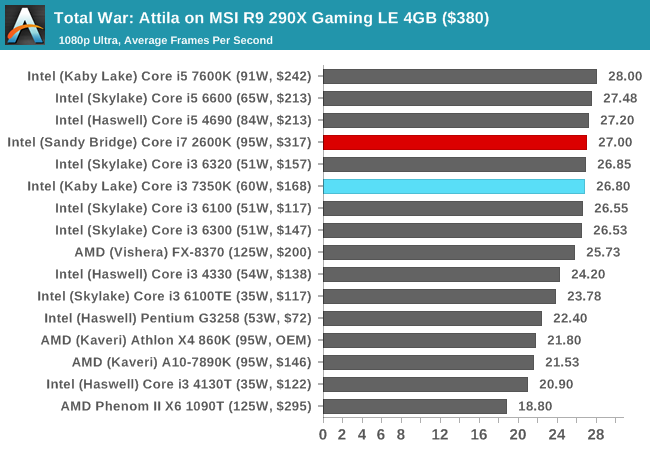
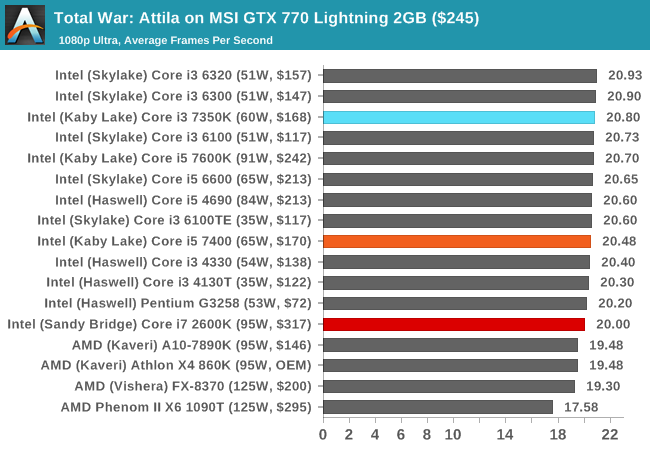
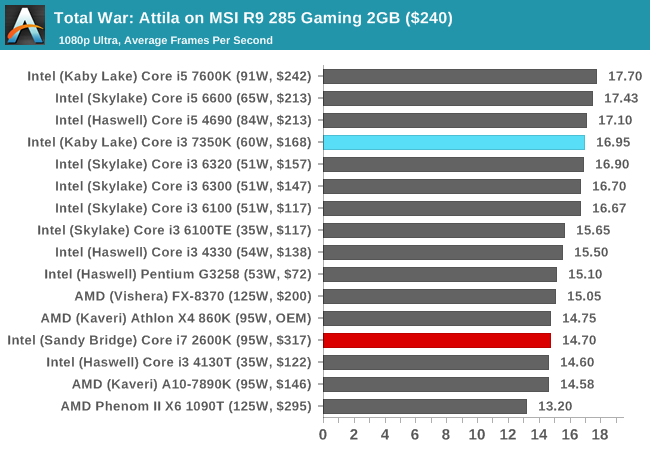
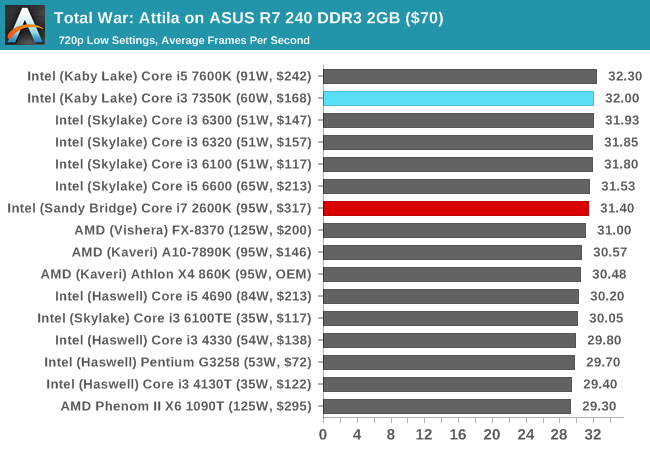
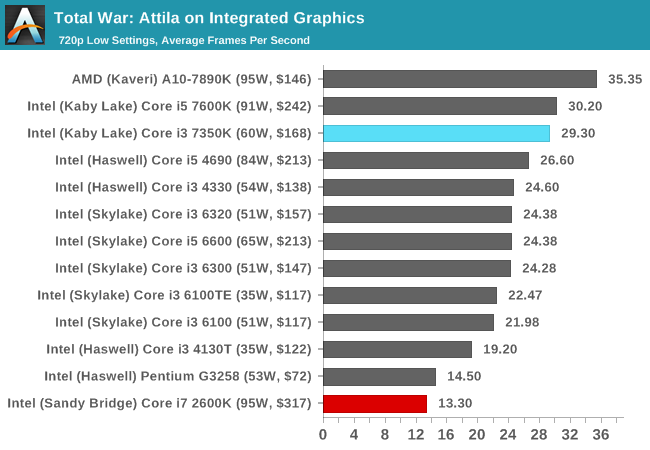
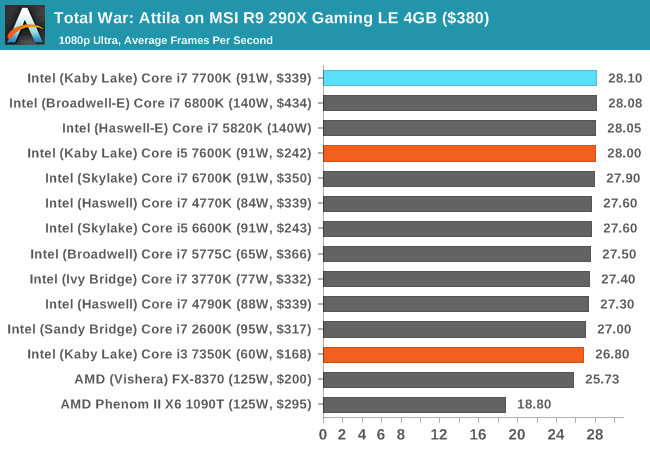
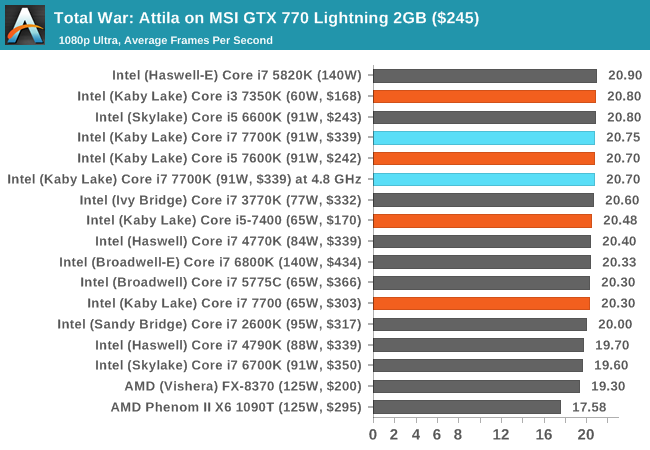
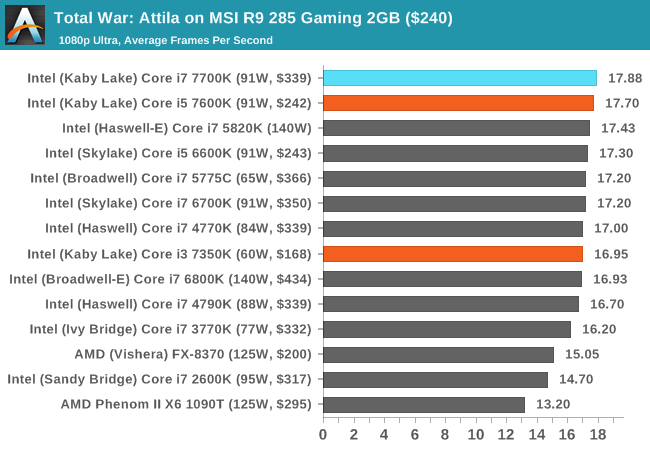
Similar to Alien Isolation, the only discrete GPU there seems to be much of a difference between the i3 and i7 is on the R9 285, where the newer microarchitecture has the advantage. The integrated graphics in Sandy Bridge were laughable, and the Core i3 offers over double the performance here.
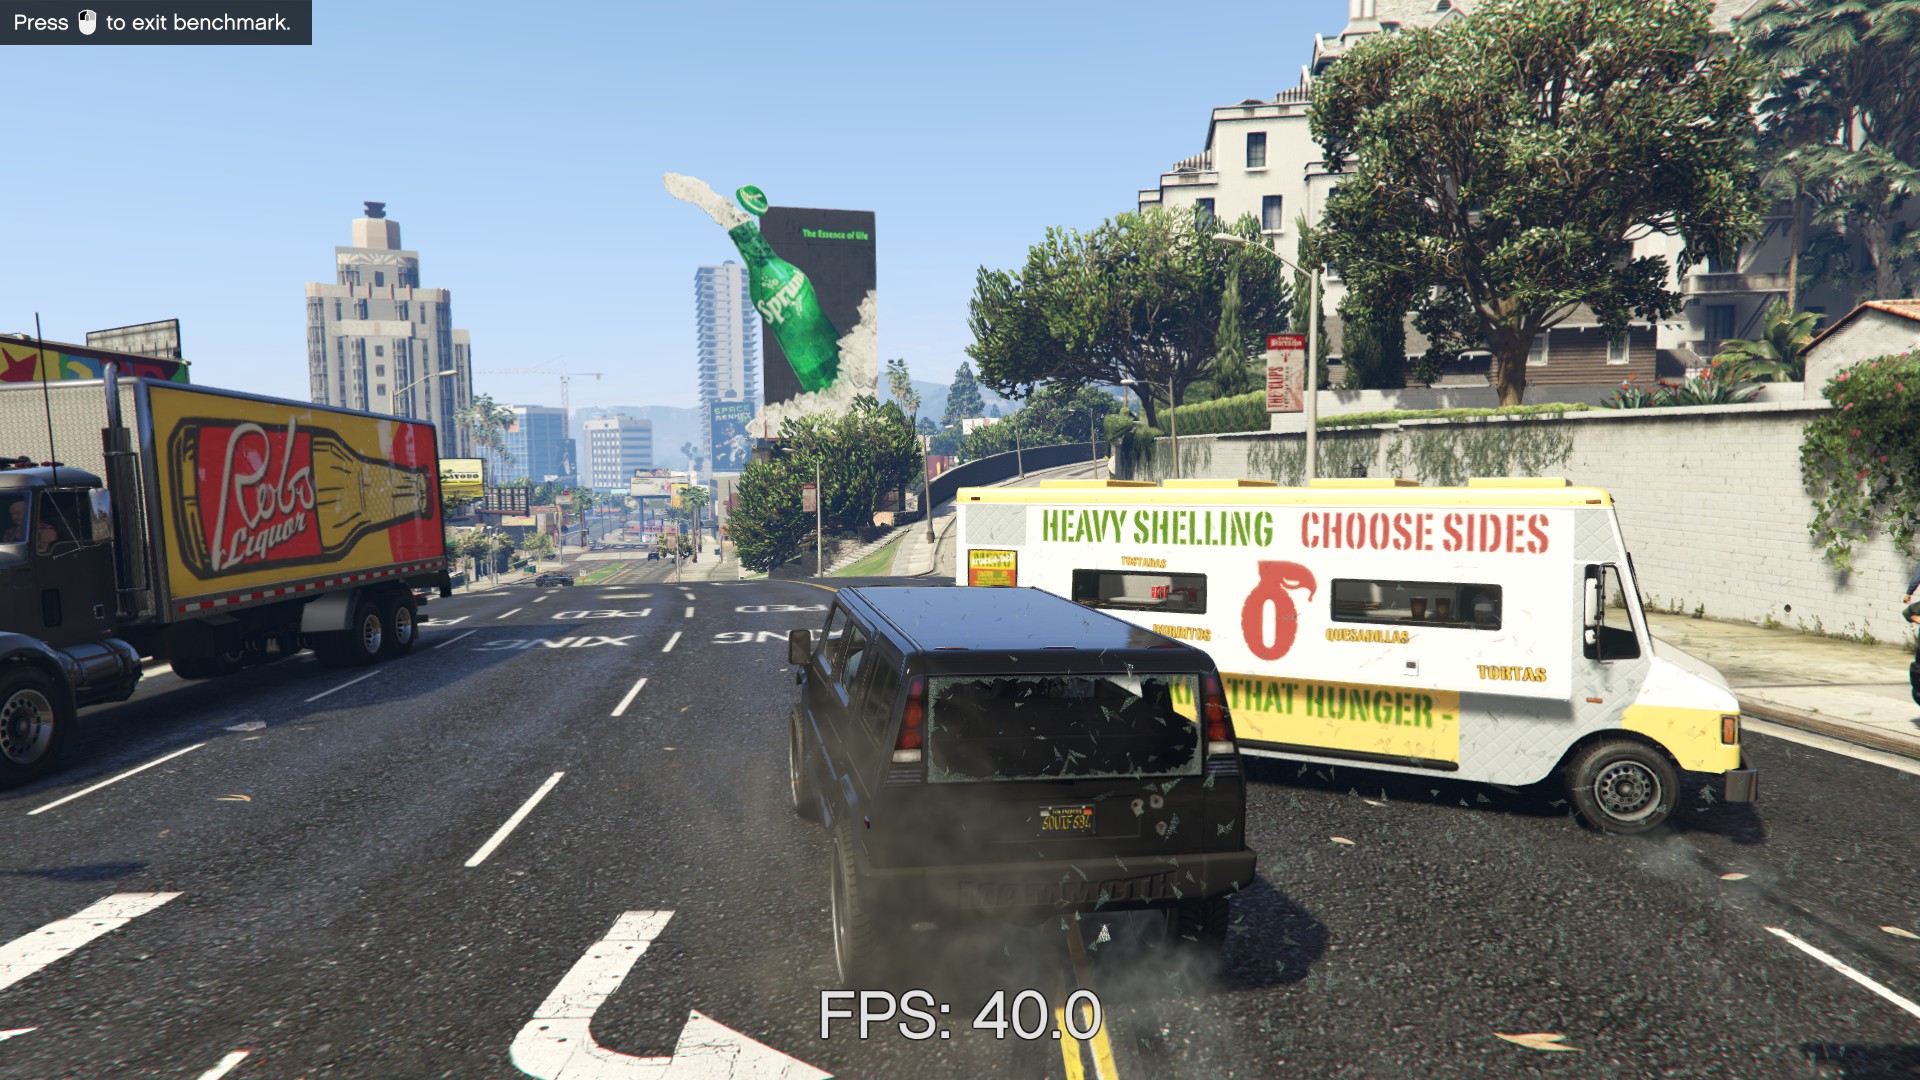
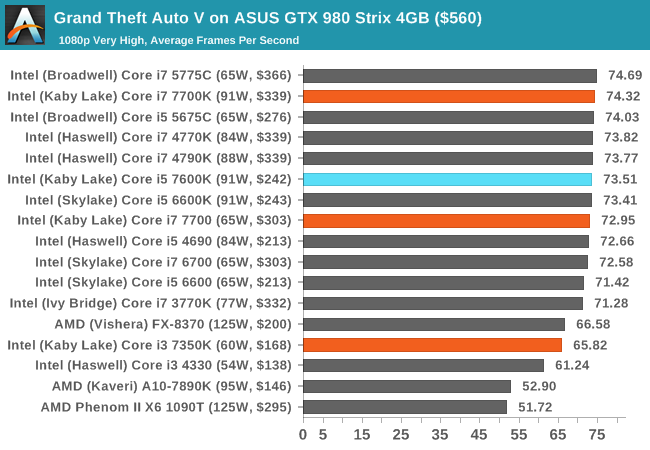
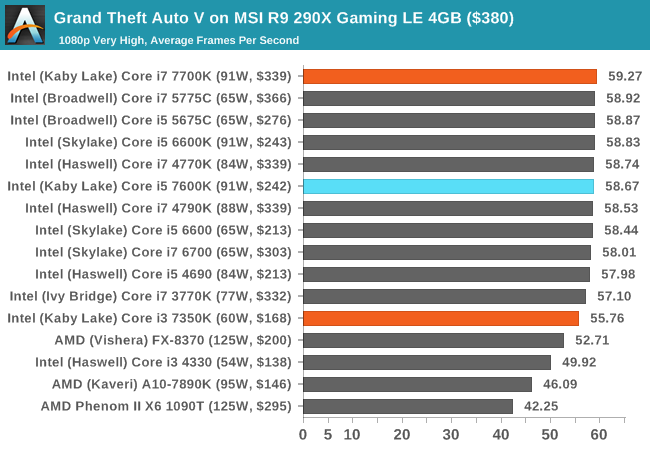
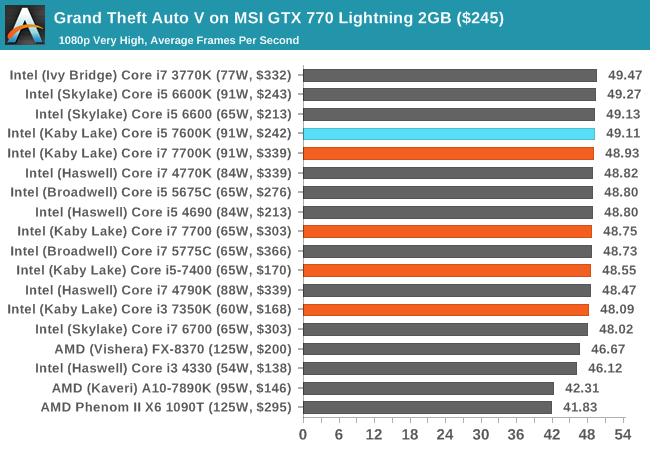
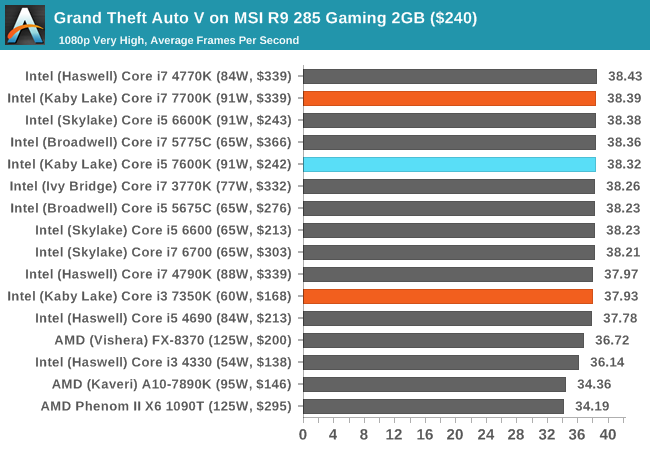
Grand Theft Auto V
The highly anticipated iteration of the Grand Theft Auto franchise finally hit the shelves on April 14th 2015, with both AMD and NVIDIA in tow to help optimize the title. GTA doesn’t provide graphical presets, but opens up the options to users and extends the boundaries by pushing even the hardest systems to the limit using Rockstar’s Advanced Game Engine. Whether the user is flying high in the mountains with long draw distances or dealing with assorted trash in the city, when cranked up to maximum it creates stunning visuals but hard work for both the CPU and the GPU.
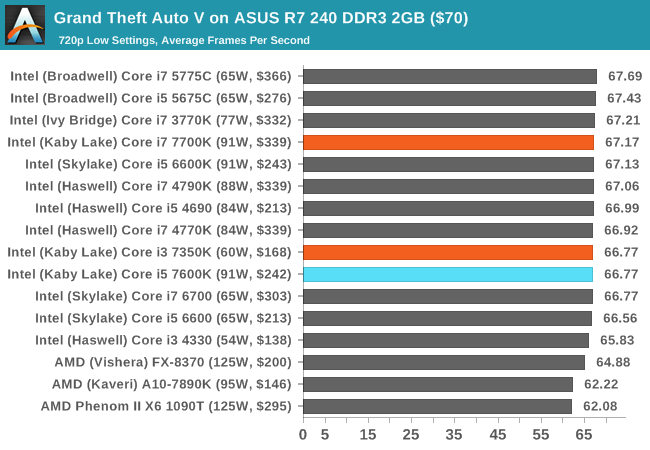
For our test we have scripted a version of the in-game benchmark, relying only on the final part which combines a flight scene along with an in-city drive-by followed by a tanker explosion. For low end systems we test at 720p on the lowest settings, whereas mid and high end graphics play at 1080p with very high settings across the board. We record both the average frame rate and the percentage of frames under 60 FPS (16.6ms).

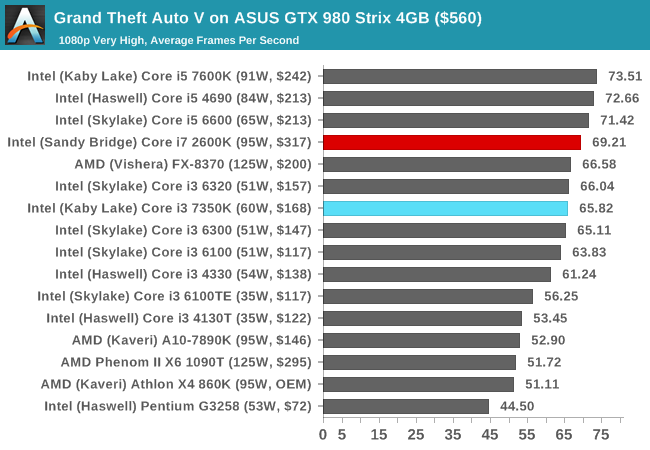
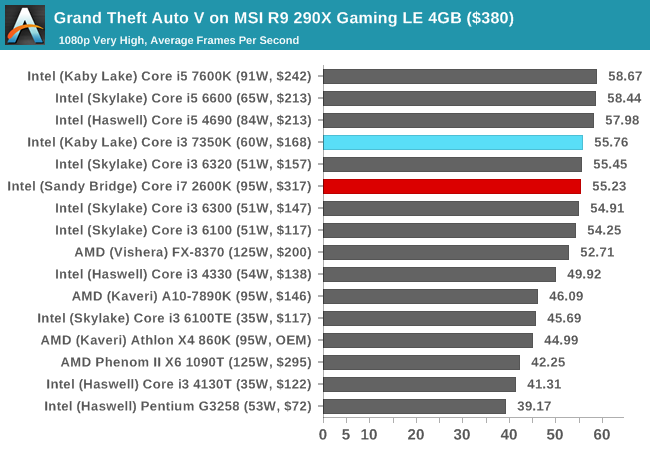
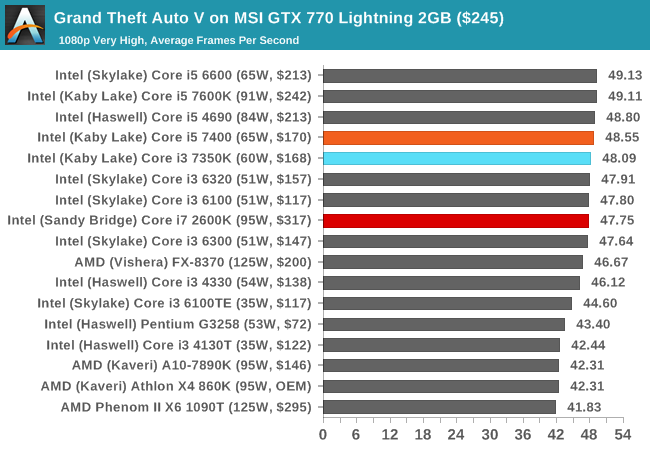
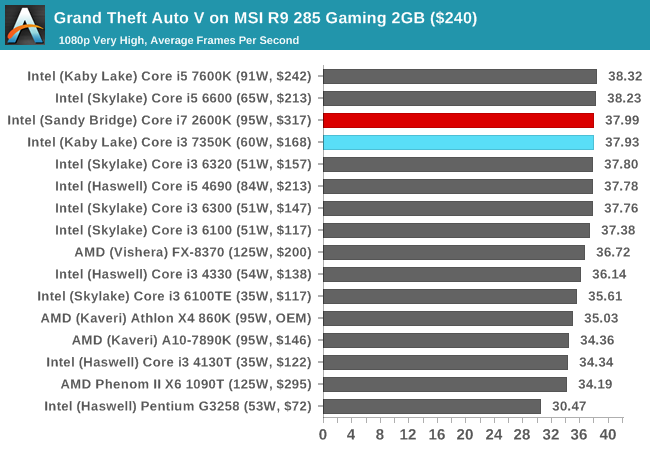
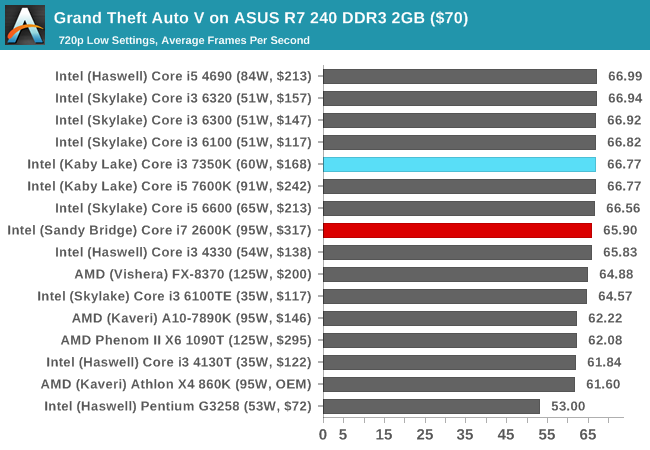
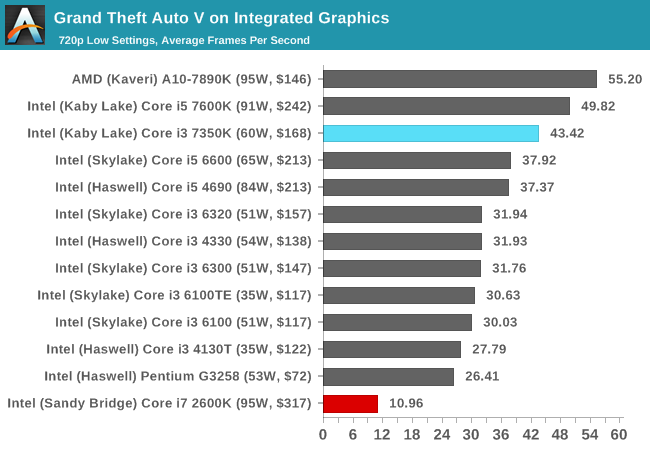
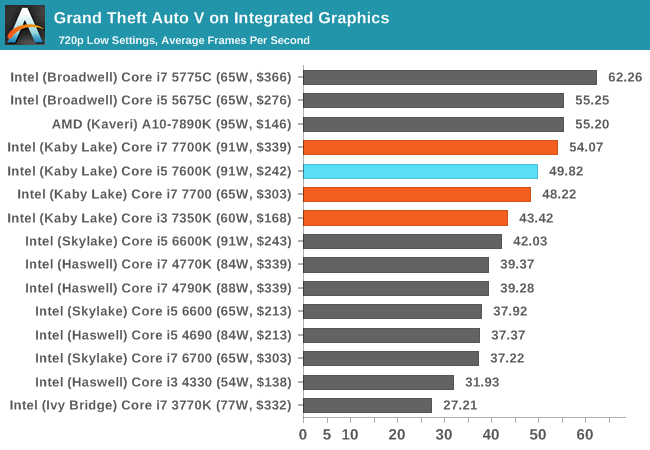
The older Core i7-2600K eeks out a small ~5 FPS advantage over the Core i3 when running a GTX 980 at 1080p maximum settings, but with all other GPUs the differences are minimal. With integrated graphics, the Core i3 shows it can pummel the older IGP into the ground.
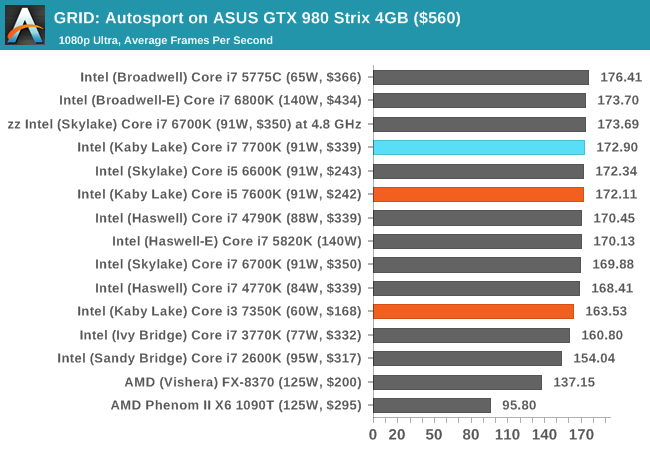
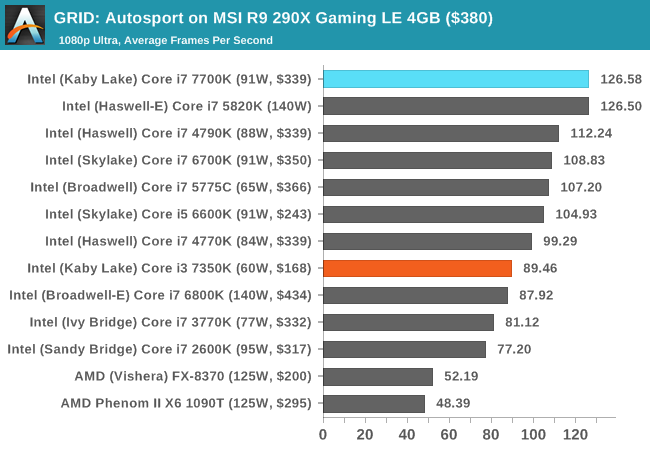
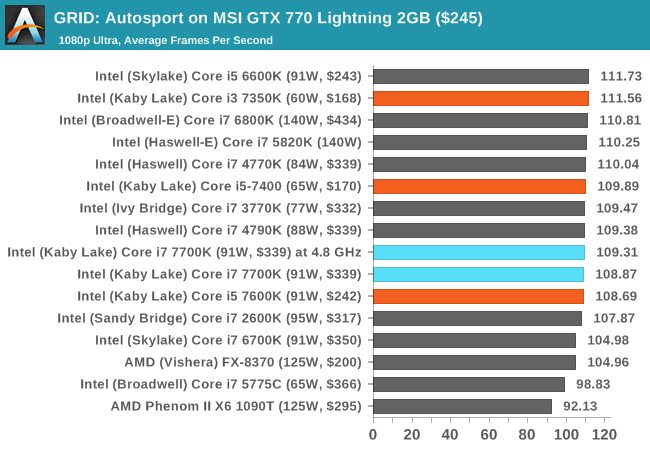
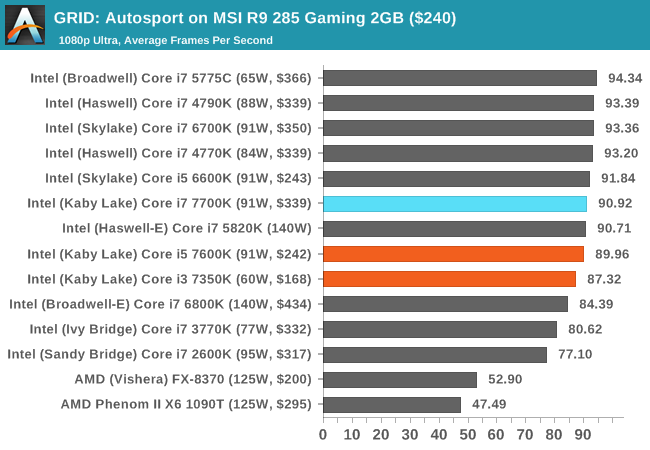
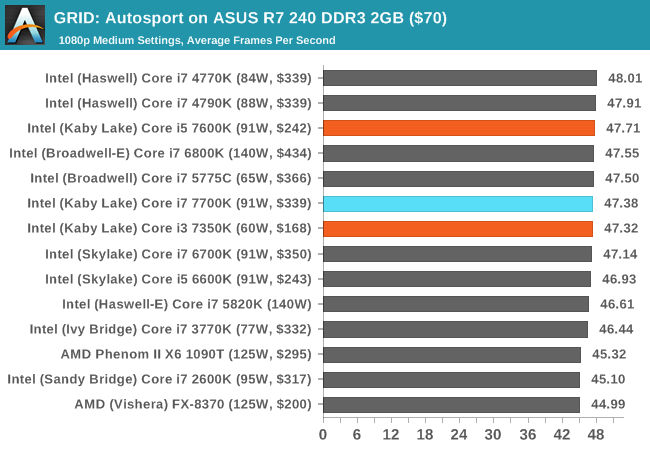
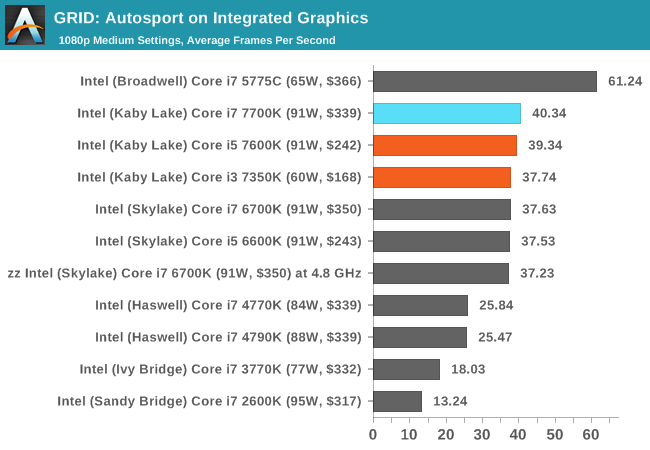
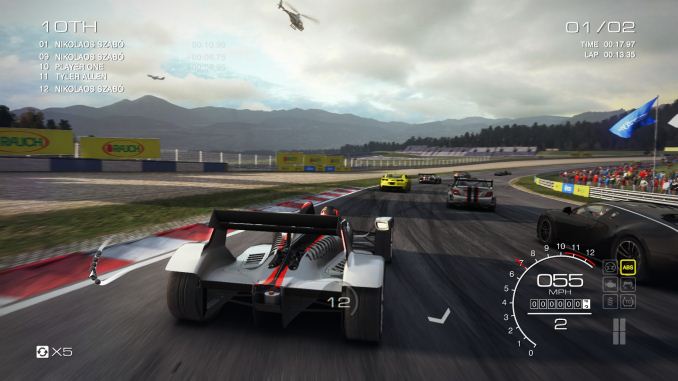
GRID Autosport
No graphics tests are complete without some input from Codemasters and the EGO engine, which means for this round of testing we point towards GRID: Autosport, the next iteration in the GRID and racing genre. As with our previous racing testing, each update to the engine aims to add in effects, reflections, detail and realism, with Codemasters making ‘authenticity’ a main focal point for this version.
GRID’s benchmark mode is very flexible, and as a result we created a test race using a shortened version of the Red Bull Ring with twelve cars doing two laps. The car is focus starts last and is quite fast, but usually finishes second or third. For low-end graphics we test at 1080p medium settings, whereas mid and high-end graphics get the full 1080p maximum. Both the average and minimum frame rates are recorded.
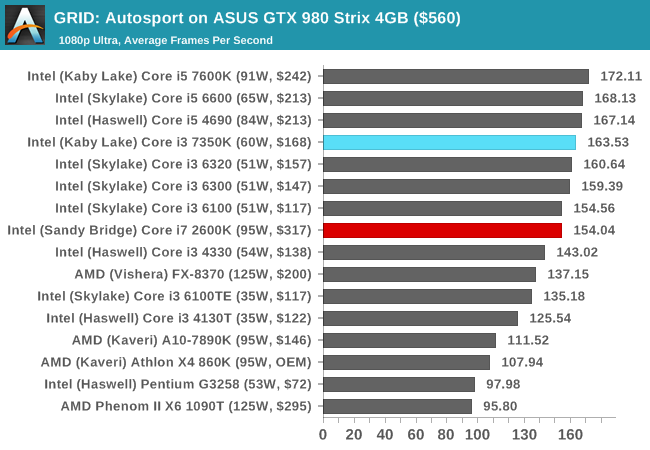
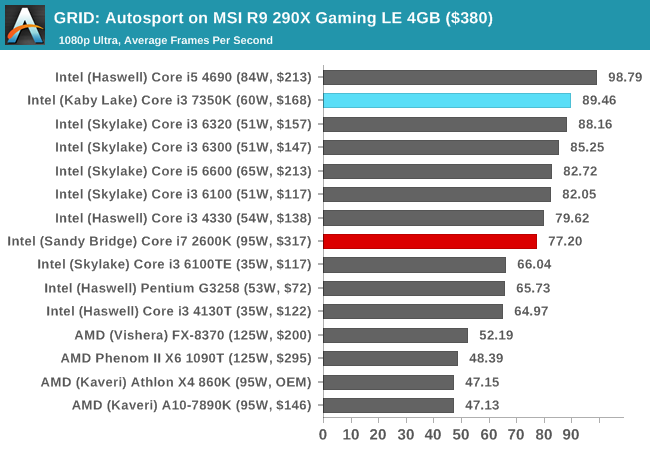
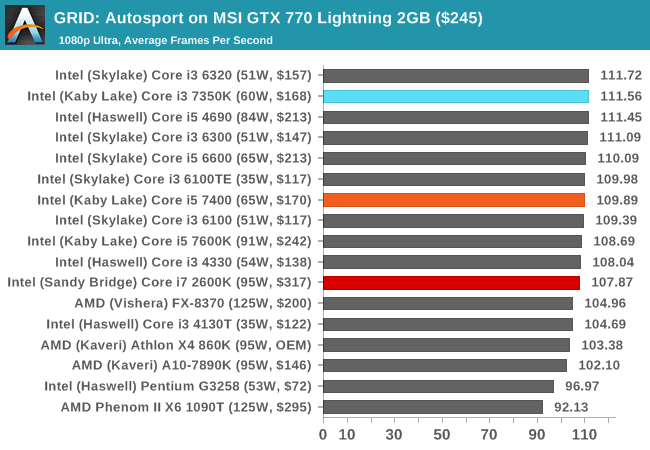
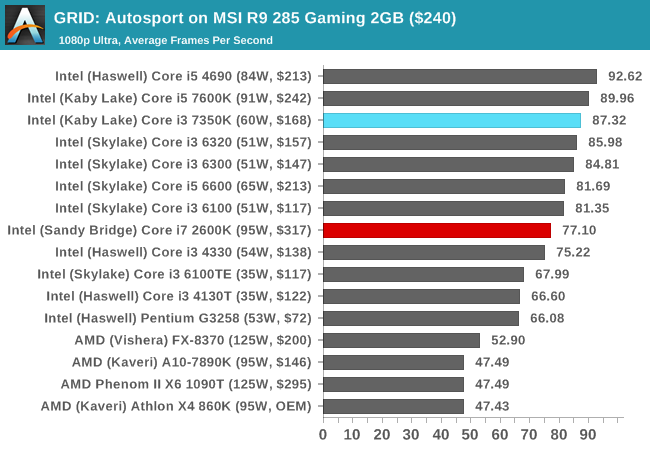
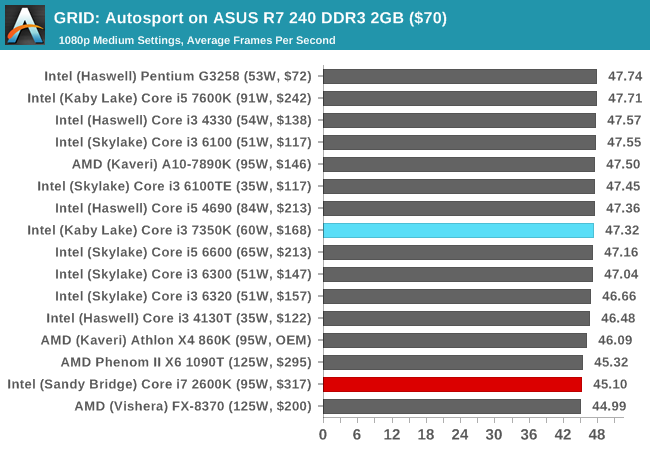
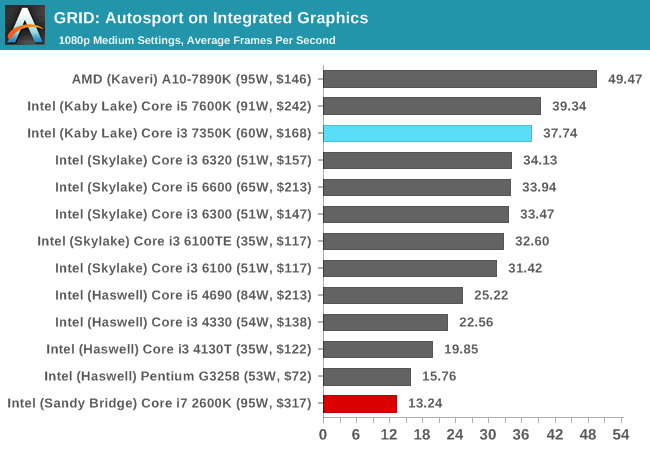
GRID prefers a high frequency and high IPC, and so we see the Core i3-7350K getting noticably better frame rates over the 2600K at 1080p using all our high-end and mid-range GPUs - only at 720p using an R7 240 did we see a minimal difference. The integrated graphs are still amusing to look at.
Shadow of Mordor
The final title in our testing is another battle of system performance with the open world action-adventure title, Shadow of Mordor. Produced by Monolith using the LithTech Jupiter EX engine and numerous detail add-ons, SoM goes for detail and complexity to a large extent, despite having to be cut down from the original plans. The main story itself was written by the same writer as Red Dead Redemption, and it received Zero Punctuation’s Game of The Year in 2014.
For testing purposes, SoM gives a dynamic screen resolution setting, allowing us to render at high resolutions that are then scaled down to the monitor. As a result, we get several tests using the in-game benchmark. For low-end graphics we examine at 720p with low settings, whereas mid and high-end graphics get 1080p Ultra. The top graphics test is also redone at 3840x2160, also with Ultra settings, and we also test two cards at 4K where possible.

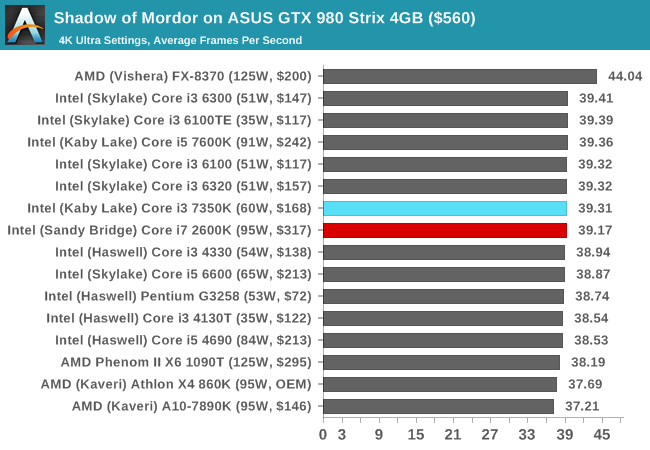
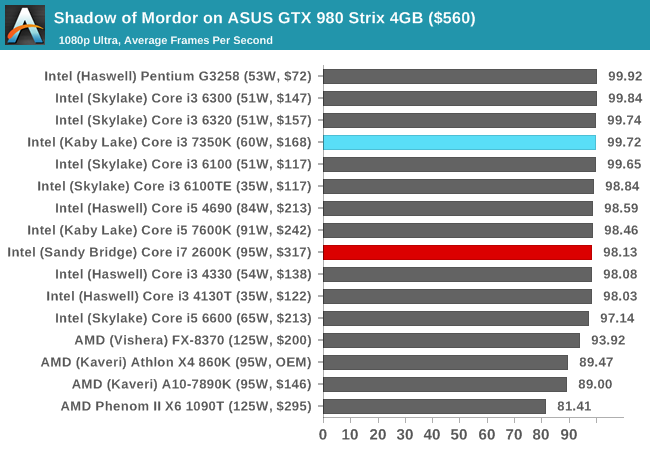
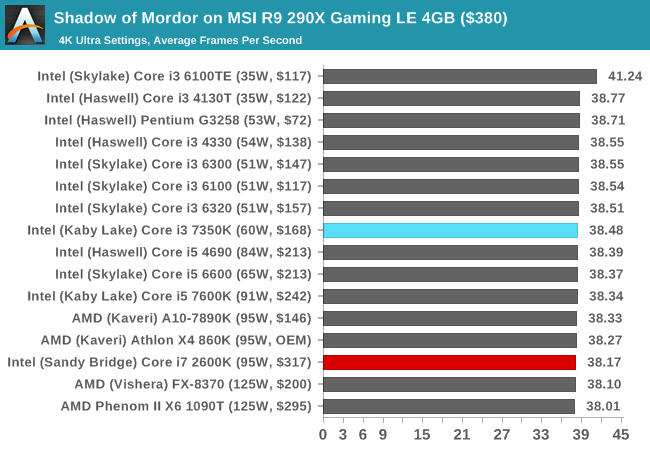
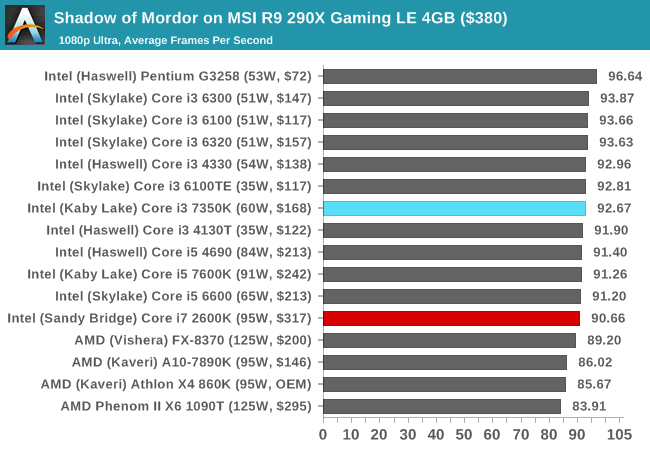
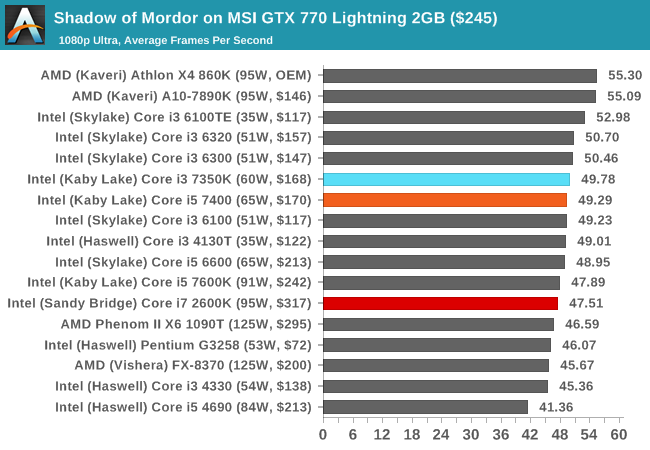
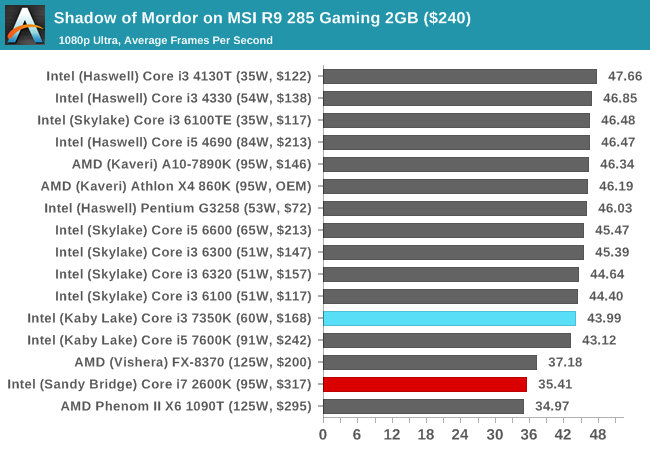
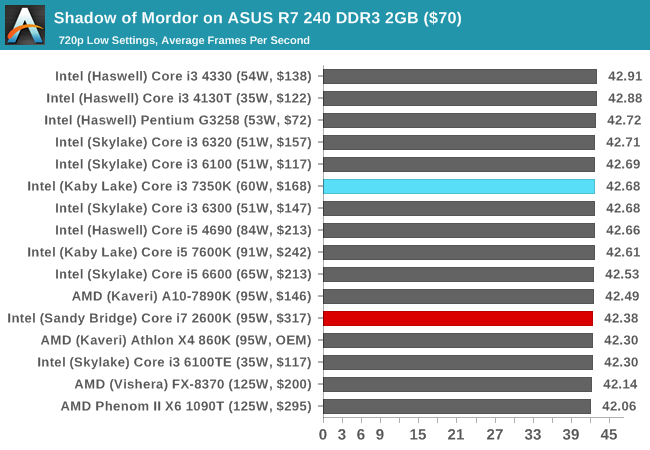
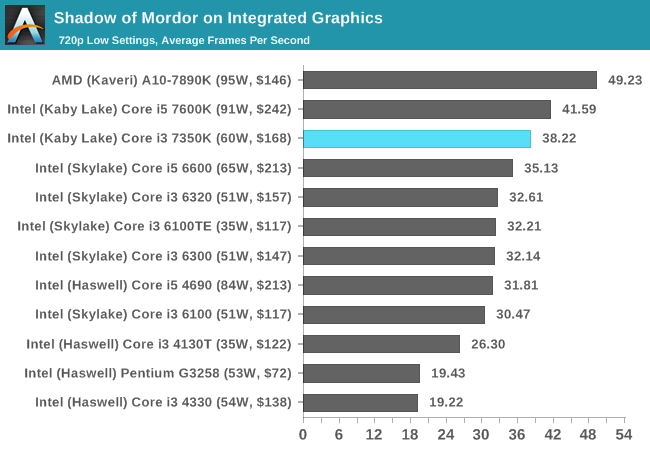
The only real difference here between the newer Core i3-7350K and the older Core i7-2600K is with our mid-range cards (GTX 770 and R9 285), whereby the older CPU seems to have a deficit 'in general' to the other CPUs we've tested. This might be CPU instruction related, although these results aren't seen on the other cards.
출처 - http://www.anandtech.com
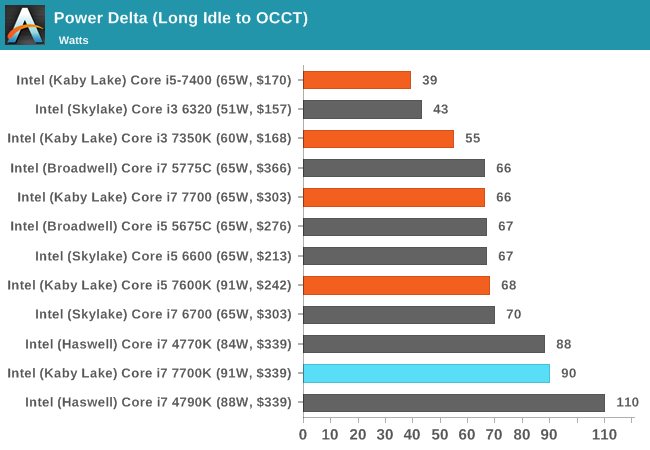
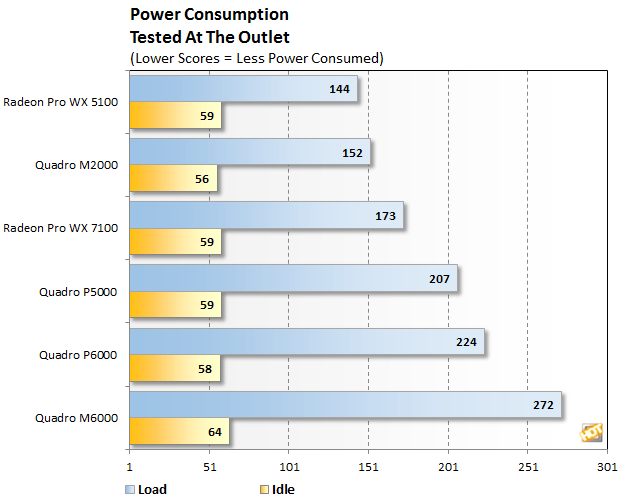
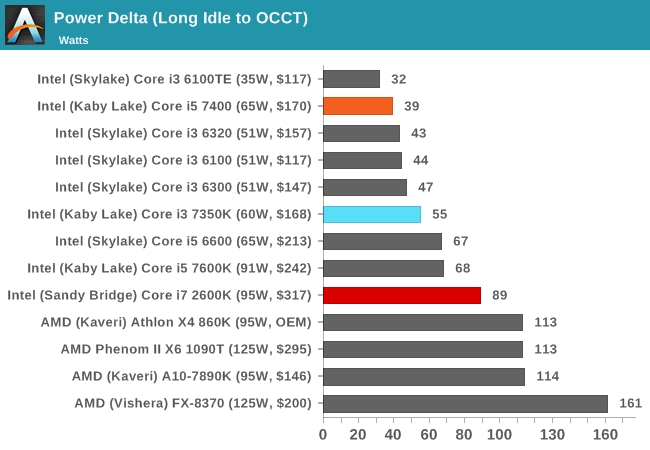
싱글 스레드 퍼포먼스는 7350K가 모든 벤치마크에서 평균적으로 25% 높은 성능, 모든 코어를 활용하는 멀티 스레드 테스트에서는 7350K가 평균적으로 18% 낮은 성능, 전력소모는 7350K가 30와트 이상 적게 소모.