'월드 벤치마크'에 해당되는 글 109건

  1. 2015.09.15 최고의 공랭 cpu 쿨러 벤치마크 by 랩터 인터내셔널
  2. 2015.09.15 스카이레이크vs하스웰 리프레시(Core i7-6700K,4790K) by 랩터 인터내셔널
  3. 2015.09.15 AMD 라데온R9 퓨리X 성능 확인 by 랩터 인터내셔널
  4. 2015.09.15 인텔 아톰x7-Z8700 체리트레일 성능 (서피스3) by 랩터 인터내셔널
  5. 2015.09.15 마이크론 크루셜 MX200 1TB SSD 리뷰 by 랩터 인터내셔널
  6. 2015.09.15 인텔 컴퓨트 스틱 리뷰:베이트레일-T (intel compute stic) by 랩터 인터내셔널
  7. 2015.09.15 GTA5 PC버전을 통한 GPU 벤치마크 (Grand Theft Auto PC) by 랩터 인터내셔널
  8. 2015.09.15 인텔SSD 750 PCIe 리뷰 by 랩터 인터내셔널
  9. 2015.09.15 마이크론 크루셜 BX100 1TB SSD 리뷰 by 랩터 인터내셔널

Top Tier CPU Air Coolers Q3 2015: 9-Way Roundup Review / www.anandtech.com


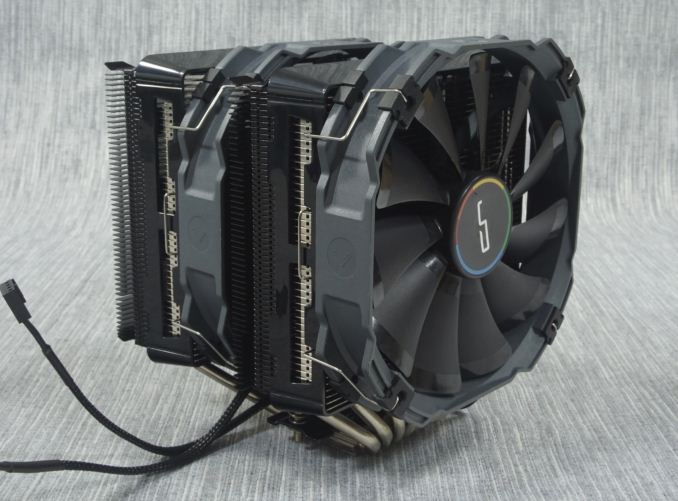
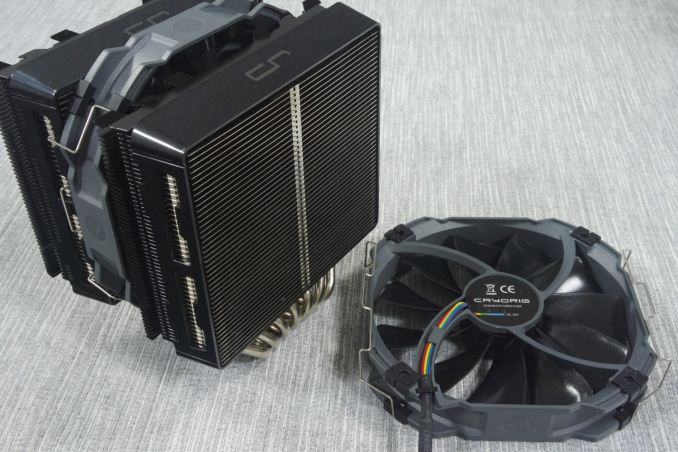
오늘의 출전 선수


CRR_26_575px.jpg


The Be Quiet! Dark Rock Pro 3


The Cryorig R1 Ultimate


The Logisys (DeepCool) Gamer Storm Assassin


The Noctua NH-D15


CRR_40.JPG


The Phanteks PH-TC14PE


The Raijintek Tisis


The Reeven Okeanos RC-1402


The SilentiumPC Grandis XE1236


[ 쿨링 테스트 ]


Testing results, maximum fan speed (12 Volts)

Average thermal resistance, 60 W to 340 W

Core temperature (60 W Load)


Core Temperature, Constant Thermal Load


Noise level

Fan Speed (12 Volts)


Testing results, low fan speed (7 Volts)

Average thermal resistance, 60 W to 340 W

Core temperature (60 W Load)


Core Temperature, Constant Thermal Load


Noise level

Fan Speed (7 Volts)


[ 결론 ]


9-Way CPU Cooler Quick Conclusions
Priority Cooler Reason
Best Thermal
Performance
Noctua NH-D15
$93
Reeven Okeanos
60€ (≈$54*)
If raw thermal performance is the only concern, these two air-based coolers offer the best there is. Arguably, the Okeanos is far too loud but, even though the high performance solely comes from strong fans, it retails for nearly half the price of the NH-D15. Therefore, the final selection depends on secondary targets and the budget.
Quietest Thermalright Macho Zero
$65 (no fan)
Be Quiet! Dark Rock Pro 3
$86.50
When low noise is the primary selection factor, Thermalright wins hands down. Be Quiet!'s Dark Rock Pro 3 would be our next choice, as it is a complete solution with fans and offers better thermal performance at comparatively low noise levels.
Best Value SilentiumPC Grandis XE1236
£34.90 (≈$45*)
Phanteks TC14PE
$80
Out of the nine coolers of this review, the Grandis may not be the best performer but it is by far the cheapest. For those that are satisfied with good performance and just want a good cooler, it will not disappoint. For those in the US, Phanteks' TC14PE offers very good quality and performance at a competitive price.
Realistic selection
(or what I, as an enthusiast/overclocker, would buy)
Noctua NH-D15
$93
To my eyes, Noctua's NH-D15 is the most balanced product of this review. It offers excellent thermal performance at reasonable noise levels, the quality is exceptional, all while the retail price is not extravagant.


출처 - http://www.anandtech.com


최고 성능 = Noctua NH-D15 / Reeven Okeanos
정숙성 = Thermalright Macho Zero / Be Quiet! Dark Rock Pro 3
가성비 = SilentiumPC Grandis XE1236 / Phanteks TC14PE
현실적인 선택 = Noctua NH-D15 

반응형
Posted by 랩터 인터내셔널
img_01_s.png

Core i7-6700K


인텔은 8월 5일 코드 네임 "스카이레이크(Skylake-S)"의 이름으로 개발된 데스크탑 버전 6세대 Core프로세서와 이 CPU에 대응하는 새로운 소켓 LGA1151 및 Intel Z170 칩셋을 채용하는 새 플랫폼을 발표했다.


Skylake-S는 "Core i7-6700K"와 "Core i5-6600K"의 2제품이 등장했지만 이번에는 상위 모델 "Core i7-6700K"와 MSI의 Intel Z170 칩셋 채용 마더보드 "Z170A GAMING M7"을 차용할 기회를 얻어 벤치마크 테스트로 새로운 제품의 성능을 체크한다.


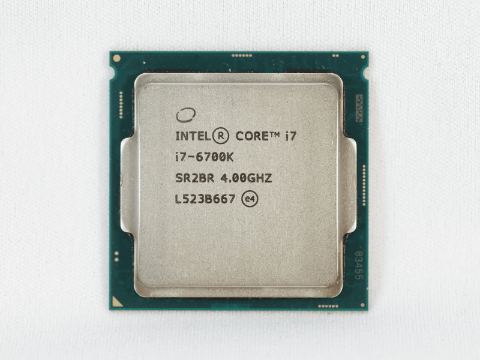
정격 4GHz 동작의 Core i7-6700K

Skylake-S 6세대 Core프로세서는 14nm공정으로 제조된 CPU로 데스크탑으로는 새로운 CPU 소켓인 LGA1151을 채용하는 신규 플랫폼에서 제공하며 Haswell에서 Broadwell까지 이어진 LGA1150과 호환성은 없어졌다.


Skylake-S는 CPU에 통합되는 메모리 컨트롤러가 DDR4-2133과 DDR3L-1600의 2가지 규격에 대응, 각각 듀얼 채널 동작이 가능하다. 다만 이는 사용자가 임의로 메모리 규격을 선택할 수 있다는 것이 아니라 이용 가능한 메모리는 메인보드의 메모리 슬롯 사양 나름이라고 한다. (보드 제조사가 결정)


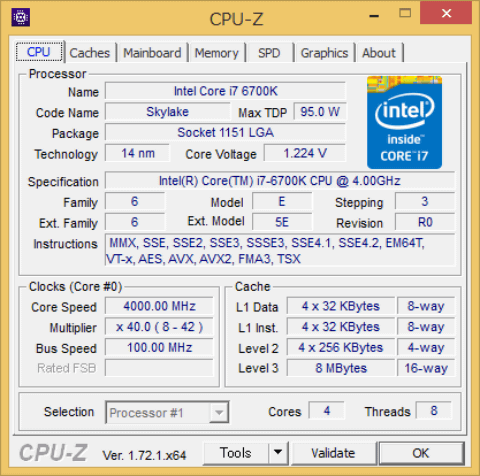
Core i7-6700K는 Hyper-Threading에 대응한 4개의 CPU 코어를 가진 4코어 8스레드 CPU. CPU 코어의 동작 클럭은 정격 4GHz, Turbo Boost시 최대 4.2GHz. 8MB의 L3캐시, 16레인의 PCI Express 3.0컨트롤러, DirectX 12에 대응하는 GPU "Intel HD Graphics 530"등을 갖춘다. TDP는 91W로 제품 패키지에는 순정 CPU쿨러가 부속되지 않는다.


img_02_s.png

Core i7-6700K의 CPU-Z 실행 화면


Core i7-6700KCore i7-4790K제조 프로세스14nm22nm개발 코드 네임Skylake-SDevil's Canyon코어44스레드88CPU 클럭(정격)4.0GHz4.0GHzCPU 클럭(Turbo Boost/최대)4.2GHz4.4GHzL3 캐시8MB8MB대응 메모리DDR4-2133DDR3L-1600DDR3-1333/1600내장 GPU코어Intel HD Graphics 530Intel HD Graphics 4600GPU코어 클럭(최대)1,150MHz1,250MHzTDP91W88W배수락 해제○○대응 소켓LGA1151LGA1150


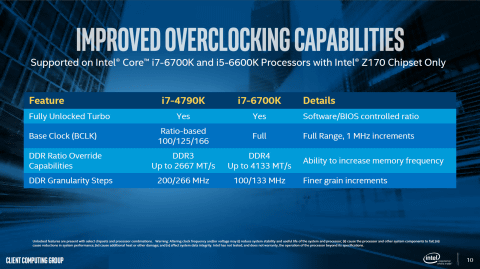
형번에 K가 주어진 Core i7-6700K는 오버클럭이 가능한 배수락 해제 모델이다. Skylake-S 세대의 K 모델은 배율만 아니라 기준 클럭을 1MHz씩 오버클럭 할 수 있어 이전 세대 CPU보다 아기자기한 튜닝이 가능했다. 또한 오버클럭 기능은 Intel Z170 칩셋과의 조합에서만 유효하다.


img_03_s.png
Core i7-6700K는 1MHz씩 기준 클럭 변경이 가능한 점 외에 메모리 관련 설정도 더 세세하게 설정이 가능하다

LGA1151 대응의 새로운 칩셋 "Intel Z170"

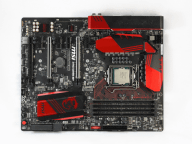
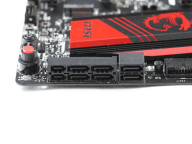
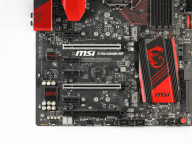
이번에 차용한 MSI 마더보드 Z170A GAMING M7은 Intel 100시리즈 칩셋 오버클럭 대응 모델 "Intel Z170"을 탑재하는 ATX 메인보드다. 4기의 메모리 슬롯은 DDR4에 대응하고 있다.

img_04_s.png
MSI Z170A GAMING M7
img_05_s.png
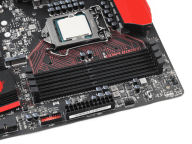
DDR4 메모리 대응 슬롯을 4기 탑재


Intel Z170칩셋에서는 6기의 SATA 6Gbps포트, 최대 10기의 USB 3.0포트를 지원하고 있으며 최대 20레인의 PCI Express 3.0을 제공한다. 이 중 칩셋이 제공하는 PCI Express버스는 Intel Z97 Express(최대 8레인, PCI Express 2.0)에서 대폭 증강됐다.


MSI Z170A GAMING M7은 이 증강된 PCI Express 3.0레인을 살려서 접속에 PCI Express를 이용하는 신세대 스토리지용 인터페이스인 M.2와 SATA Express를 각 2기씩 장착하고 있다.


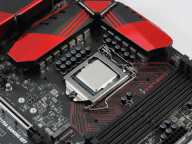
새로운 소켓 LGA1151은 전술한 대로 Haswell/Broadwell세대의 LGA1150과 호환성은 없지만 CPU 쿨러를 고정하기 위한 구멍의 위치는 LGA1150과 같으므로 기본적으로는 LGA1150 대응의 CPU 쿨러를 사용할 수 있다.


img_06_s.png
Intel Z170 칩셋의 블럭 다이어그램
img_07_s.png
Intel Z170칩셋의 S-ATA 포트
img_08_s.png
32Gbps 대응의 M.2 슬롯을 2기 장비
img_09_s.png
LGA1151의 CPU 소켓 주변. CPU쿨러는 LGA1150 대응의 것을 설치 가능.

하이엔드 GPU를 탑재한 벤치마크 테스트 결과

그럼 벤치마크 테스트 결과를 옮긴다.      

이번에는 Core i7-6700K와 Z170A GAMING M7의 검증을 실시하면서 Skylake-S에서 동작이 확인 된 센츄리 마이크로 DDR4-2133 메모리와 NVIDIA의 GM200코어 채용의 하이엔드 GPU "GeForce GTX 980 Ti"를 차용했다.

img_10_s.png
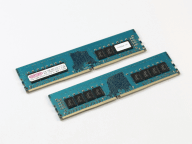
센츄리 마이크로 DDR4-2133 메모리. 이번에는 8GB의 메모리를 2장 사용했다
img_11_s.png
이번에 차용한 센추리 마이크로 DDR4 메모리는 칩의 배치나 기판 설계를 개선하고 전송 효율을 높인 것. 기존의 DDR4메모리와 칩의 배치가 다른 점이 두드러진다
img_12_s.png
NVIDIA에서 차용한 GeForce GTX 980 Ti 레퍼런스 보드


또 이번에는 Devil's Canyon(Haswell)의 최상위 CPU "Core i7-4790K"와 2011년 발매된 Sandy Bridge "Core i7-2600K"를 비교용 제품으로 준비했다.


그 동안 빠른 4코어 8스레드 CPU인 Core i7-4790K와 성능 차이, 대박 CPU인 Core i7-2600K의 교체 모델로서의 성능 2가지 관점에서 Core i7-6700K를 가늠하는 척도로 진행한다.


[표 2] 테스트 환경
CPU Core i7-6700K Core i7-4790K Core i7-2600K
마더보드 Z170A GAMING M7 ASUS MAXIMUS VII GENE ASUS MAXIMUS V GENE
칩셋 Intel Z170 Intel Z97 Intel Z77
메모리 DDR4-2133 8GB×2 (15-15-15、1.20V) DDR3-1600 8GB×2 (9-9-9-24、1.50V) DDR3-1333 8GB×2 (9-9-9-24、1.50V)
스토리지 Intel SSD 510시리즈 120GB
비디오 카드 NVIDIA GeForce GTX 980 Ti
그래픽 드라이버 GeForce Driver 353.62
전원 Antec HCP-1200(1,200W 80PLUS GOLD)
OS Windows 8.1 Pro Update 64bit


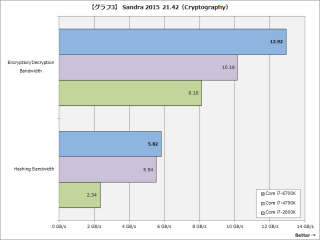
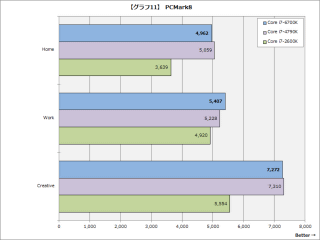
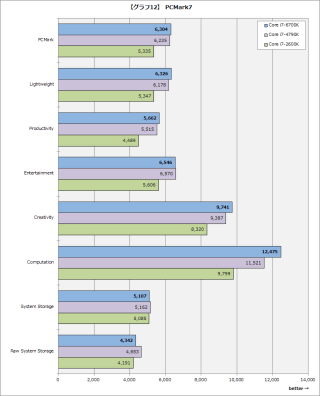
우선 CPU 벤치마크 테스트 결과 확인한다. 실시한 벤치 마크 테스트는 SiSoftware Sandra 2015 21.42(그래프 1~3,7~10), CINEBENCH R15(그래프 4), x264 FHD Benchmark 1.01(그래프 5), Super PI(그래프 6), PCMark 8(그래프 11), PCMark 7(그래프 12).


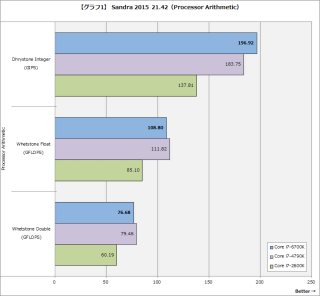
CPU 연산 성능을 측정하는 Sandra 2015 "Processor Arithmetic"에서는 Core i7-6700K가 정수 연산(Dhrystone Integer)에서 Core i7-4790K을 웃돌았지만 부동 소수점 연산(Whetstone)에서는 반대로 3% 정도 뒤지고 있다.


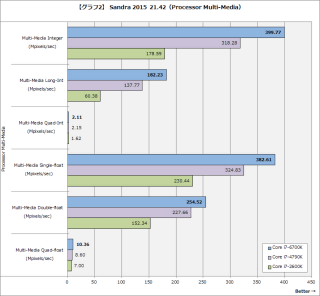
한편 확장 명령 세트를 이용한 "Processor Multi-Media"에서는 역전되어 "Multi-Media Quad-Int"를 제외하고 정수 연산(Integer)에서 25~30%, 부동 소수점 연산(Float)에서 11~20%의 차로 Core i7-6700K가 승리했다.


01_s.png
[그래프 1]Sandra 2015 21.42(Processor Arithmetic)
02_s.png
[그래프 2]Sandra 2015 21.42(Processor Multi-Media)
03_s.png
[그래프 3]Sandra 2015 21.42(Cryptography)


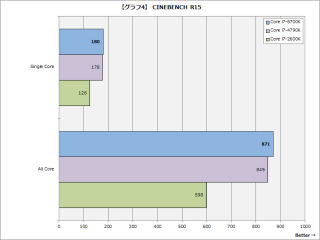
3DCG의 렌더링 성능을 측정한 CINEBENCH R15에서는 1~2%로 박빙이면서도 Core i7-6700K가 Core i7-4790K를 넘어섰다.


이때의 CPU 클럭을 모니터링한 결과 모든 코어를 이용하는 테스트에서 Core i7-4790K가 상시 4.2GHz로 동작한 반면 Core i7-6700K는 거의 4.0GHz에서 동작하고 있었다. 벤치마크 중인 동작 클럭에 5%의 차이가 있음을 감안하면 Skylake-S의 클럭당 처리 능력이 높은 것.


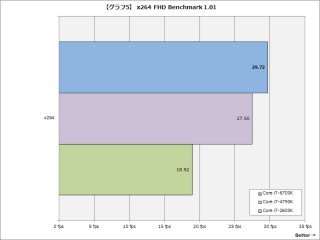
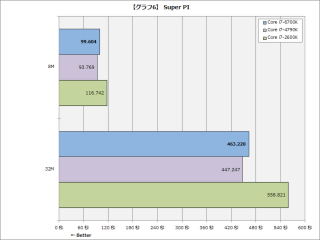
AVX를 이용하는 x264 FHD Benchmark 1.01에서는 약 8%의 차로 Core i7-4790K을 넘어선 Core i7-6700K지만 최신 확장 명령 세트를 이용하지 않는 Super PI에서는 거꾸로 3~6% 뒤처졌다.


04_s.png
[그래프 4]CINEBENCH R15
05_s.png
[그래프 5]x264 FHD Benchmark 1.01
06_s.png
[그래프 6]Super PI


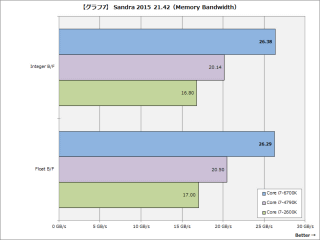
메모리 대역폭을 측정하는 Sandra 2015의 "Memory Bandwidth"에서는 DDR4-2133 메모리에 대응하는 Core i7-6700K가 26GB/sec이상을 기록해 DDR3-1600 메모리 대응의 Core i7-4790K보다 6GB/sec정도로 큰 메모리 대역을 실현하고 있다.


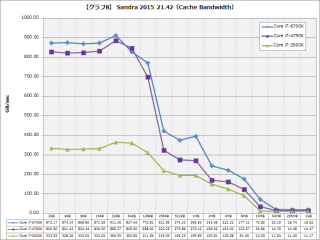
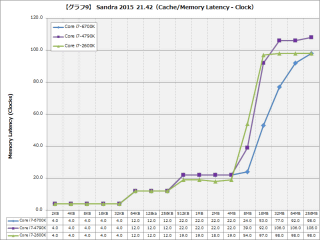
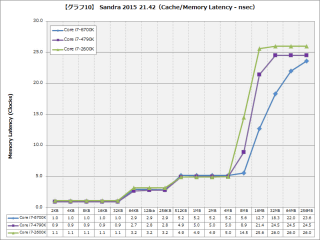
CPU가 갖춘 캐시의 대역폭을 측정하는 "Cache Bandwidth"에서는 CPU 클럭이 떨어진 Core i7-6700K가 L2캐시~L3캐시 영역인 256KB~8MB의 범위에서 Core i7-4790K보다 30~40% 가량 넓은 대역폭을 기록했다. 메모리와 캐시의 대역폭 향상이 Core i7-6700K의 연산 성능을 높이고 있다고 생각된다.


07_s.png
[그래프 7]Sandra 2015 21.42(Memory Bandwidth)
08_s.png
[그래프 8]Sandra 2015 21.42(Cache Bandwidth)
09_s.png
[그래프 9]Sandra 2015 21.42(Cache/Memory Latency-Clock)
10_s.png
[그래프 10]Sandra 2015 21.42(Cache/Memory Latency-nsec)


PCMark 8에서는 "Work"에서 약 3%가량 Core i7-4790K을 넘어선 Core i7-6700K지만 "Creative"과 "Home"에서는 약간 Core i7-4790K의 뒤를 쫓고 있다. PCMark 7에서도 "Computation"에서는 약 8%로 비교적 큰 차이가 있었는데 다른 테스트는 1~3% 차이로 우열이 나뉘어 두 CPU사이에 큰 차이는 없다.


11_s.png
[그래프 11]PCMark 8
12_s.png
[그래프 12]PCMark 7


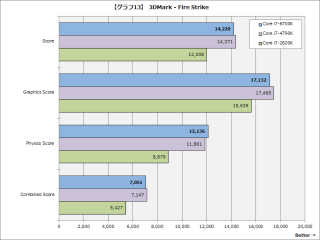
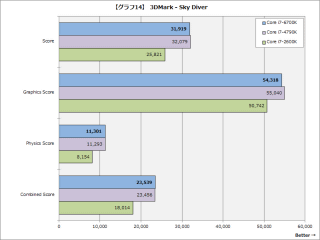
이어 3D 계열 벤치마크 테스트 결과를 소개한다. 실행한 벤치마크 테스트는 3DMark(그래프 13~16), 3DMark 11(그래프 17), 파이널 판타지 XIV(그래프 18), MHF벤치마크(그래프 19), PSO2 실 체험판 ver. 2.0(그래프 20).


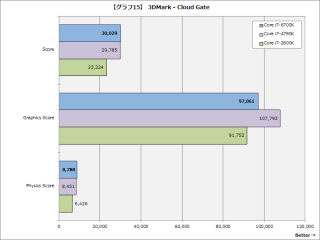
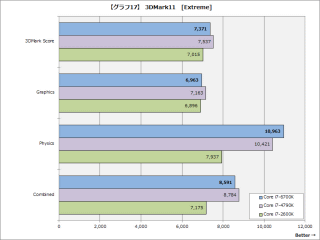
3DMark에서는 Fire Strike, Sky Diver, Cloud Gate 3가지 테스트의 종합 점수에서 Core i7-6700K와 Core i7-4790K의 차이는 1% 안팎으로 우열했다. 3DMark 11에서도 Core i7-4790K에 뒤처졌지만 그 차이는 3% 미만에 머물고 있으며 크게 불리한건 없다.


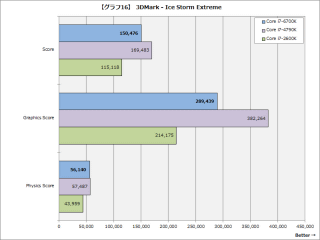
3DMark에서 Ice Storm Extreme은 Graphics Score에 10만 정도의 큰 차이가 있어 종합 스코어도 12%의 차이가 났다. 


13_s.png
[그래프 13]3DMark-Fire Strike
14_s.png
[그래프 14]3DMark-Sky Diver
15_s.png
[그래프 15]3DMark-Cloud Gate
16_s.png
[그래프 16]3DMark-Ice Storm Extreme
17_s.png
[그래프 17]3DMark 11[Extreme]


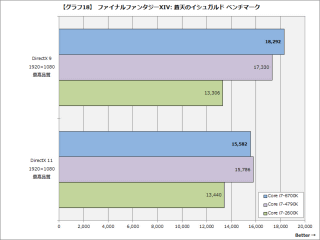
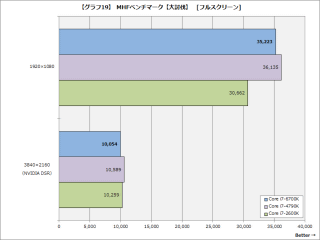
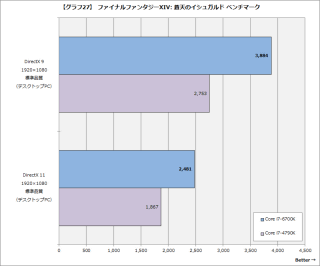
파이널 판타지 XIV에서는 DirectX 9에서 테스트를 실행했을때 5% 포인트 차로 Core i7-4790K를 웃돌았지만 DirectX 11에서는 역전되고 있다. MHF 벤치마크에서는 NVIDIA DSR을 이용한 4K 해상도로 스코어는 Core i7-2600K를 밑돌았다.


CPU의 성능에 따른 차이가 붙어 있다는 점에서 좀 이상한 결과가 발견된다. 이미 드라이버 및 UEFI도 성숙되고 있는 기존의 플랫폼과 비교하면 Skylake-S의 LGA1151플랫폼은 아직 개선 될 여지가 남아 있는 것처럼 생각된다. 이 부근은 향후의 개선을 기대하고 있다.


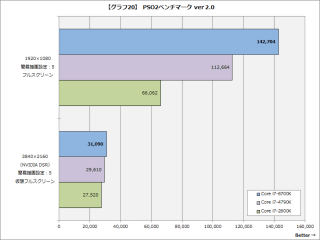
또한 PSO2 벤치 마크에서는 1,920×1,080에서 26%의 스코어 차로 제쳐 Core i7-4790K을 웃돌지만 이 벤치마크 테스트는 프레임 레이트의 변화에 대한 스코어의 상승이 크기 때문에 실제 게임에서 20% 이상 뛰어난 성능을 발휘한다는 것은 아니다.


18_s.png
[그래프 18]파이널 판타지 XIV 벤치 마크
19_s.png
[그래프 19]MHF벤치 마크
20_s.png
[그래프 20]PSO2벤치 마크 ver 2.0[1,920×1,080]


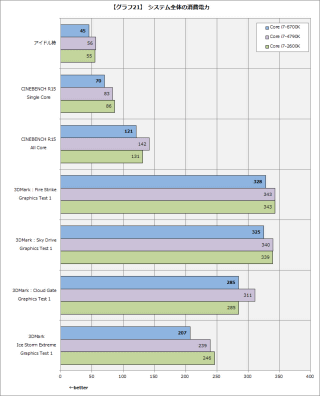
벤치마크 테스트 실행 중 최대 소비 전력을 측정한 것이 다음의 그래프다. 각각 사용하고 있는 메인 보드가 다르기 때문에 CPU 차이에 의한 전력 차이가 아닌 점에 주의.


21_s.png


아이들시 소비 전력은 Core i7-6700K가 45W를 기록해 비교용 2제품보다 약 10W 낮은 전력을 기록했다. 소비 전력의 차로 10W는 크지만 이 숫자는 마더보드에 따라서 크게 좌우되는 부분이기도 하다. 이번 테스트 시스템 편성에서 Core i7-6700K 환경의 아이들시 소비 전력이 낮다고 말하는 것이 타당하다.


벤치마크 중 소비 전력에 대해 비교한 3가지 제품 중에서 Core i7-6700K가 가장 낮은 소비 전력을 기록하고 있다. CPU 처리 중심의 CINEBENCH R15도 Core i7-4790K에 13~22W, Core i7-2600K에 10~16W의 차이를 보였다. Core i7-4790K보다 TDP가 3W 높아진 Core i7-6700K지만 CPU의 소비 전력 자체는 그리 증가하지 않았다고 보는 것이 좋을 것 같다.


CPU 내장 GPU를 사용한 벤치마크 테스트

다음 CPU 내장 GPU을 이용해 실행한 3D 벤치마크 테스트 결과를 소개한다. 또한 여기에서는 Core i7-2600K의 스코어는 생략했다.


CPUCore i7-6700KCore i7-4790K메인보드MSI Z170A GAMING M7ASUS MAXIMUS VII GENE칩셋Intel Z170Intel Z97메모리DDR4-2133 8GB×2(15-15-15、1.20V)DDR3-1600 8GB×2(9-9-9-24、1.50V)스토리지Intel SSD 510 シリーズ 120GB그래픽Intel HD Graphics 530Intel HD Graphics 4600드라이버10.18.15.4186 Beta10.18.14.4206파워Antec HCP-1200(1,200W 80PLUS GOLD)OSWindows 8.1 Pro Update 64bit


실행한 벤치마크 테스트는 3DMark(그래프 22~25)3DMark 11(그래프 26), 파이널 판타지 XIV 벤치마크(그래프 27), MHF벤치마크(그래프 28), PSO2 실 체험판 ver. 2.0(그래프 29).


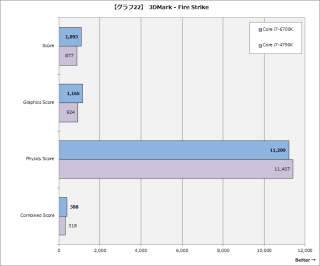
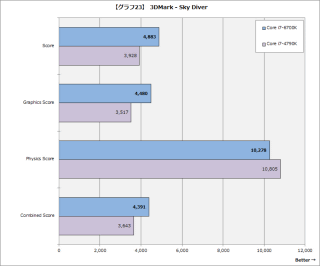
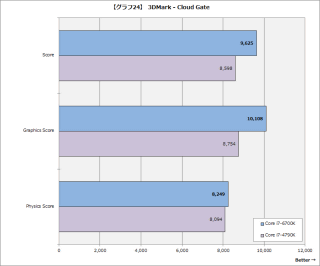
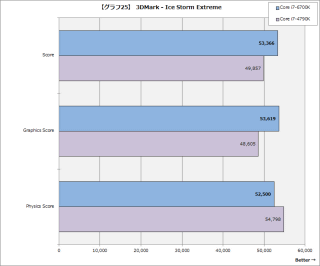
3DMark에서는 Intel HD Graphics 530을 갖춘 Core i7-6700K가 Intel HD Graphics 4600을 갖춘 Core i7-4790K에 10~25% 정도의 차이로 승리했다. 렌더링 부하가 가벼운 Cloud Gate, Ice Storm Extreme보다 Fire Strike와 Sky Diver등에서 큰 차이를 보이고 있는 것이 인상적이다.


22_s.png
[그래프 22]3DMark-Fire Strike
23_s.png
【그래프23】3DMark - Sky Diver
24_s.png
【그래프24】3DMark - Cloud Gate
25_s.png
【그래프25】3DMark - Ice Storm Extreme
26_s.png
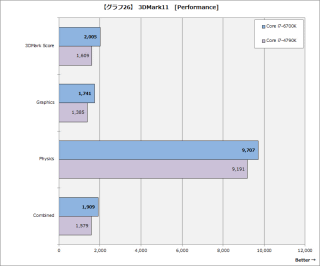
【그래프26】3DMark 11 [Performance]


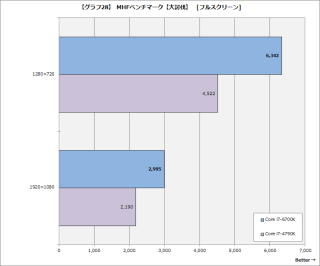
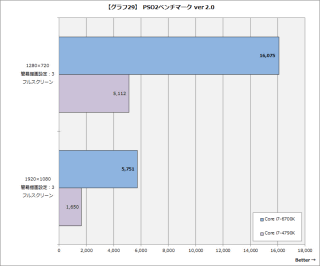
파이널 판타지 XIV와 MHF 벤치마크에서 Core i7-4790K와의 점수 차이는 30~40%로 3DMark보다 더 큰 차이가 났다. PSO2 벤치마크에서는 3배 이상의 점수 차이가 났지만 프레임 레이트의 차로 말하면 1.5배 정도의 차이로 실제로 발휘되는 성능은 파이널 판타지 XIV 등의 벤치마크 결과에 가깝다.


27_s.png
[그래프 27]파이널 판타지 XIV 벤치 마크
28_s.png
[그래프 28]MHF벤치 마크
29_s.png
[그래프 29]PSO2벤치마크 ver 2.0[1,920×1,080]


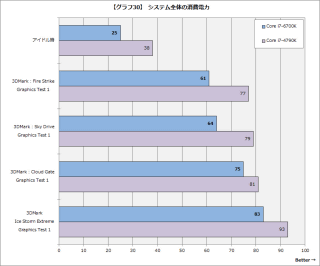
벤치마크 중 소비 전력은 Core i7-6700K이 모든 조건에서 Core i7-4790K를 밑돌았다.

CPU 내장 GPU 이용시 소비 전력 비교에서 메모리와 마더보드 등 CPU 이외의 장치가 소비하는 전력의 차이가 차지하는 비중이 큰 점에 주의가 필요하지만 벤치마크 테스트에서 20%, 40%의 차이를 보였다는 이 결과는 Core i7-6700K의 전력 효율이 높은 것.


30_s.png
[그래프 30]시스템 전체의 소비 전력

4코어 8스레드 최고봉의 성능과 강화된 칩셋 기능이 매력

이상과 같이 Core i7-6700K의 성능을 체크했다. Devil's Canyon Core i7-4790K을 압도하는 성능이라고는 할 수 없지만 동등 이상의 성능을 가지면서 칩셋 기능의 강화에 의해 고속의 차세대 스토리지의 이용이 용이하게 된 것이 Core i7-6700K와 Intel Z170 칩셋의 매력이다.


이번에는 Core i7-4790K와의 비교에 초점을 맞추고 소개했지만 CPU 계열 벤치마크 테스트에서 구형 샌디브릿지 Core i7-2600K보다 20~40% 차이를 보인다는 점도 빼놓을 수 없다. Core i7-4790K가 특별한 고 클럭 CPU였기에 Core i7-6700K에 상응하는 것이지 다른 4코어 8스레드 CPU에서 업그레이드를 한다면 큰 성능 향상이 기대된다.


최근 발매된 Windows 10에 맞추어 PC를 장만하고 싶은 유저에게 Core i7-6700K와 Intel Z170 칩셋의 조합은 성능과 확장성이 뛰어나며 장기간 사용할 수 있는 PC를 구축하는데 적합한 선택 사항이 될 것이다.


출처 - http://pc.watch.impress.co.jp/docs/topic/review/20150805_715220.html

반응형
Posted by 랩터 인터내셔널

img_1709.jpg


AMD가 야심차게 발표한 차세대 GPU "라데온 R9 퓨리X"


The Fiji based Radeon R9 Fury X has a TDP set at, give or take, 275 Watts. You power it by using two 8-pin PCI-Express graphics card headers. Combined they allow for 300 Watts with another 75 Watts coming from the PCIe slot, so that is 375 Watts of power delivery at your disposal, handy for a bit of tweaking I'd say.


If we zoom in a little, up top you will see a micro DIP switch; the card has two BIOSes, both equal. One simply functions as a fail-safe should you mess up a firmware flash. So there's no 'uber' performance mode like the 290X had here.


The backside of the card is also completely covered. So yeah, thermal imaging is going to be a challenge today! So the backside is a thing of preference for many of you these days. It allows for a better protected product in the critical areas yet also makes a card more sturdy. 


The Fury X comes with a liquid cooling solution, from this perspective it might look a little bulky, but it's all good really. The radiator is roughly 4cm thick and with the fan on top of it, 6.5 cm. It follows the standard 120mm form factor so this unit will be easy to house pretty much anywhere inside a chassis.


제품 외형 : 수냉 쿨링 기본 장착, 8-pin 보조 전원 2개, 바이오스 전환 스위치


So yeah - it's all a little bit different alright, a closed-loop liquid cooling solution, the smaller form factor, some new lighting options. But overall from an aesthetic point of view, a very decently designed product if you ask me.


Here we can see the connectors; as explained, Display Port 1.2a x 3, one HDMI 1.4a connector and thus lacking is a DVI connector. Obviously, Eyefinity works here perfectly fine as well, DP recommended of course. It might be a very interesting card with which to set up a desktop multi-monitor setup.


The card comes with two BIOSes. One stores a STANDARD reference BIOS, and another one that functions as fail-safe. The micro DIP switch is just above the Radeon logo. Below the two 8-pin PCI-Express power connectors you can see an array of red LEDs, these are in fact GPU load indicators. All red for full GPU utilization, half of them at 50% load. Once in IDLE or zero power mode, one LED will remain active. 


Now, if you looked closely (and as a Guru3D reader we assume you already did), you would have noticed a set of micro switches on the back side as well. This card has phase load LEDs, full load and a series of LEDs will activate. These switches allow you to configure the colors. 8+1 LEDs located above the PCIe power connectors that indicate the intensity level of the GPU operation. For example, during a typical gaming session all 8 LEDs will be lit, and while typically idling on the desktop a single LED will be lit. These 8 LEDs are user configurable to either red and/or blue by the physical dip-switch located on the back side of the graphics card. The 1 green LED located alongside the 8 LEDs indicates when the graphics card is in ZeroCore Power operation.


The top side Radeon logo is now LED lit as well, especially for PCs with a side see-through panel, that will be very visible


GPU 주위로 HBM 메모리  확인


AMD Radeon R9 Fury X AMD Radeon R9 390X
Fabrication Process 28nm 28nm
GPU Fiji Hawaii / Grenada
Streaming Processors 4096 2816
Graphics memory 4 GB HBM 8 GB GDDR5
Memory Clock up-to 500 MHz / 1.0 Gbps 6.0 Gbps
Core Clock 1050 MHz 1050 MHz
Memory Bandwidth up-to 512 GB/s 384 GB/s
Power Connectors 2 x 8-pin 1 x 6-pin - 1 x 8-pin
Form Factor Full Height, Dual slot Full Height, Dual slot
Freesync  Yes Yes
DirectX 12 Support  Yes Yes


390X와 퓨리X 비교, 동일한 28나노 공정, 증가된 SP, 하이닉스 HBM 적용, 메모리 대역 상승, 증가된 트랜지스터, 향상된 컴퓨트 성능 등


GCN 1.2 아키텍처

  • Engine has Dual Geometry engines / Asynchronous Compute engines
  • 16 render backends / 64 color ROPs per clock cycle / 256 Z/Stencil ROPs per clock
  • Engine ties to 2048 KB R/W L2 cache (Upto16 64 KB L2 cache partition)
  • Fiji GPU has up-to 64 Compute Units
  • 4 Geometry processors (4 primitives per clock cycle)
  • 64 Pixel Output/clock


라데온 퓨리X 전력소모 : 지포스980TI, 타이탄X 보다 높은 전력 소모량


라데온 퓨리X 온도 : 수랭 쿨링 탑재로 가장 낮은 온도


이하 라데온 퓨리X 그래픽 성능


출처 - http://www.guru3d.com

반응형
Posted by 랩터 인터내셔널

01_s.png


마이크로소프트가 발표 Surface 3


마이크로 소프트는 622g의 태블릿 서피스3를 발표했다. 그 개요 등에 관해서는 별도의 기사를 참조하기로 하며 여기에서는 서피스3에 탑재되고 있는 SoC, Atom x7-Z8700의 성능을 벤치마킹한다.


실제로 테스트하고 나타난 결과는 Atom x7-Z8700은 윈도우7 시대의 하이엔드 노트북과 비슷한 성능을 갖추고 있어 Web을 보거나 Office 어플리케이션 정도면 충분한 성능을 갖고 있다는 것이다.


베이트레일에 비해 GPU 강화가 큰 포인트가 되는 체리트레일

서피스3에 채택된 Atom x7-Z8700은 개발 코드 네임 Cherry Trail(체리트레일)로 알려진 Intel의 최신 모바일 SoC다. Cherry Trail은 2013년 9월에 발표된 Atom Z3700 시리즈(개발 코드 네임:Bay Trail)의 후계 제품으로 3월 스페인 바르셀로나에서 열린 MWC 2015에서 발표됐다. 두 제품을 비교하면 다음과 같다.


[표 1] Cherry Trail / Bay Trail 비교
개발 코드 네임 Cherry Trail Bay Trail
제품명 Atom x5/x7 Atom Z3700
제조 프로세스 14nm 22nm
CPU Airmont Silvermont
CPU 코어 개수 4 4
GPU Intel GMA Gen8 Intel GMA Gen7
그래픽스 API OpenGL4.2/Direct 3D 11.1/OpenCL 1.2/OpenGL ES 3.0 OpenGL3.2/Direct 3D11/OpenCL 1.1
최대 EU 수 16 4
QSV 대응 대응
메모리 2x64 LPDDR3 1600-8GB 2x64 LPDDR3 1066 4GB
최대 대역 폭 25.6GB/sec 17.1GB/sec
스토리지 I/O eMMC4.51 eMMC4.51


기존 제품인 Bay Trail과 가장 큰 차이는 GPU가 대폭 강화되고 있다는 것이다. Bay Trail의 GPU는 Intel이 자체 설계한 내장 GPU(Intel GMA) 제 7세대로 불리는 디자인과 제 3세대 Core 프로세서(개발 코드 네임:Ivy Bridge)와 같은 아키텍처다. EU로 불리는 실행 엔진은 4개로 다소 적다.


이에 비해서 Cherry Trail의 내장 GPU는 제 8세대로 강화되고 있다. 제 8세대 GMA는 제 5세대 Core 프로세서(Broadwell)에도 채용되고 있는 내장 GPU로 최신 디자인이다. 또한 EU는 한번에 4배인 16개로 늘리고 있다. 또, 소프트웨어적으로는 OpenGL 4.2, Open CL 1.2, OpenGL ES 3.0등에 새롭게 대응했다.


16개의 EU을 실현하기 위해서 제조 프로세스는 제 5세대 Core 프로세서와 같은 14nm으로 강화되고 있다. 이것에 아울러 CPU도 14nm 세대용 Airmont 코어로 변경되고 있지만 이 Airmont 코어는 22nm 프로세스용 Silvermont 코어의 미세화 버전으로 CPU의 성능 자체에는 큰 변화가 없다. 이 때문에 CPU 성능에 관해서는 Bay Trail 세대와 비슷하다.


I/O 주변도 기본적으로 큰 변화가 없다. 스토리지는 Bay Trail과 같은 eMMC 4.51 이다. 다만 메모리는 Bay Trail이 LPDDR3-1066의 듀얼 채널 구성인 것에 비해 Cherry Trail은 LPDDR3-1600의 듀얼 채널로 강화되고 있다. 최대 구성시 메모리 대역폭은 Bay Trail이 17.1GB/sec인 반면 Cherry Trail은 25.6GB/sec로 증가하고 있다.


Core 프로세서와 큰 차이는 CPU의 성능과 스토리지 인터페이스

이 Cherry Trail은 상위 버전인 Core 프로세서와는 뭐가 다를까. 이미 말한 대로 GPU의 아키텍처는 Cherry Trail도 Intel GMA의 제 8세대로 되어 차이는 EU 수에 지나지 않는다. 그래서 최대 차이는 CPU다. 다음은 Core 프로세서로 Atom의 최신 세대를 비교한 표다. 


【표2】Core 프로세서(Broadwell)와 Atom 프로세서(Cherry Trail)의 차이
제 5세대 Core 프로세서(U 프로세서) Atom x5/x7
개발 코드 네임 Boradwell Cherry Trail
CPU 아키텍처 - Airmont
CPU 코어수(논리 스레드) 2(4) 4(4)
L1캐시(명령/데이터)/코어 32KB/32KB 32KB/32KB
L2캐시/코어 512KB 512KB
LLC 4MB -
GPU 아키텍처 Intel GMA Gen8 Intel GMA Gen8
EU 24/48기 16기
메모리 구성 DDR3L-1600/LPDDR3-1866×2 LPDDR3-1600×2
메모리 대역폭(최대) 25.6GB/sec 25.6GB/sec
스토리지 PCI Express/SATA eMMC4.51
소비전력 TDP15W/28W SDP2W


현재 노트 PC 용으로 제공된 제 5세대 Core 프로세서는 듀얼 코어(2코어)로 Cherry Trail은 쿼드 코어(4코어)로 되어 있어 Cherry Trail이 빠른 것이 아니냐고 착각하는 사람도 없지는 않을것(본지의 독자에게는 없다고 생각하지만 혹시 모른다). 실제로 CPU의 처리 능력이라는 것은,


(1) CPU의 코어 개수
(2) IPC(Instruction Per Clock cycle)
(3) 클럭 주파수


라는 몇 가지의 파라미터로 결정된다. 이들의 곱셈으로 결정되어 코어 수가 많아도 클럭 주파수와 IPC가 낮으면 성능은 높지 않다. 현재의 CPU 주파수는 1~3GHz 정도로 비교적 비슷한 클럭 주파수로 되는 경우가 많다. 그래서 주로 성능은 IPC에서 결정된다.


IPC란 요컨대 1클럭에 실행시킬 수 있는 명령수다. 캐시는 각 코어 주위에 32KB(명령)+32KB(데이터)L1캐시, 512KB의 L2캐시(Atom은 실제로 2개의 CPU 코어가 1MB의 L2캐시를 공유하는 구조)라는 곳까지는 두 제품 모두 같지만 Broadwell에는 LLC로 불리는 L3캐시가 준비되고 더 높은 IPC를 실현할 수 있다. 이 밖에도 실행 엔진의 효율 등 다양한 부분에서 Core 프로세서는 IPC를 높이는 구조가 포함되고 있다.


그러나 IPC가 올라갈수록 소비 전력은 증가하기 때문에 Core 프로세서는 15W와 28W라는 TDP(Thermal Design Power, 열 설계 전력, 제품을 디자인할 때 상정하는 전력량)이 설정되어 있다. 이것에 비해 Cherry Trail 쪽은 SDP(TDP가 SoC 온도가 90도까지 견딘다고 했을 때의 전력인 반면 SDP는 SoC가 70도까지 견딜 수 있다고 했을때의 제품 디자인 참조 전력량)이 2W로 압도적으로 낮게 설계되고 있다. Core 프로세서라면 기본적으로 냉각용 팬이 있어야 하는데 Cherry Trail은 팬리스로 설계할 수 있다.


또 다른 차이는 스토리지 인터페이스다. Core 프로세서가 PCI Express나 Serial ATA 등을 이용하고 SSD를 접속할 수 있는 반면 Cherry Trail은 eMMC로 불리는 태블릿과 스마트폰 등에서 일반적으로 이용되는 인터페이스를 이용하고 있다. PCI Express가 수 GB/sec, SATA가 600MB/sec으로 매우 높은 대역이 되는 반면 Cherry Trail에서 지원되는 eMMC 4.51은 200MB/sec로 고속은 아니다. 원래 eMMC 용으로 판매하는 플래시 메모리들은 고속은 아니므로 이것으로 충분한 것이지만 PC 용으로 보면 다소 더디다. 다만 eMMC는 압도적으로 소비 전력이 낮은 모바일 기기에는 적합하다.


테스트에 의하면 베이트레일의 1.5 ~ 3.6배, 몇 년전 하이엔드 PC 성능을 갖나?

그럼 실제 Cherry Trail의 성능은 얼마나 될까. 그것을 보기 위해 필자의 수중에 있던 3개 제품과 벤치 마크를 이용해 비교했다.


비교한 것은 Bay Trail을 탑재한 "ThinkPad 8"(2014년 발매) 제 4세대 Core 프로세서(Haswell)를 탑재한  "VAIO Duo 13"(2013년 발매), 또 제 1세대(라고는 말하지 않지만) Core 프로세서(Arrandale)를 탑재한 "ThinkPad T410s"(2010년 발매) 3가지를 준비했다.


또한 이용한 Surface 3는 전회의 기사에서 소개한 미국판 Surface 3(4GB/128GB모델, Wi-Fi), 테스트 환경은 표3, 결과는 표4.


[표3] 테스트 환경
ThinkPad T410s(Core i5-M540) VAIO Duo 13(Core i5-4200U) ThinkPad 8(Atom Z3770) Surface 3(Atom x7-Z8700)
모델 ThinkPad T410s VAIO Duo 13 ThinkPad 8 Surface 3
CPU Core i5-M540(2.53GHz) Core i5-4200U(1.6GHz) Atom Z3770(1.46GHz) Atom x7-Z8700(1.6GHz)
메모리 4GB 4GB 2GB 4GB
스토리지 Samsung MMDPE56G8DXP Samsung MZNTD128HAGM SanDisk SEM128 Samsung MDGACC
OS Windows 7 SP1 Windows 8.1 Update Windows 8.1 Update Windows 8.1 Update
발매시기 2010년 2013년 2014년 2015년


ThinkPad T410s(Core i5-M540) VAIO Duo 13(Core i5-4200U) ThinkPad 8(Atom Z3770) Surface 3(Atom x7-Z8700)
3DMark ICE storm Umlimited
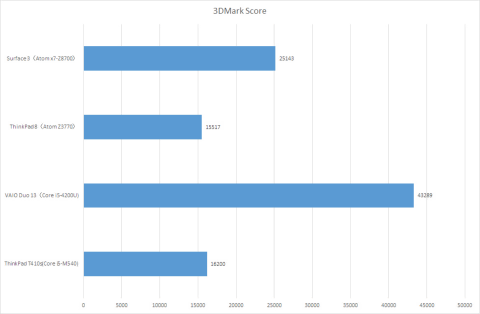
Score 16200 43289 15517 25143
Graphics Score 14491 49290 14541 27417
Physics Score 27600 30355 20289 19487
Graphics test 1(fps) 90.37 313.65 77.72 135.42
Graphics test 2(fps) 48.36 162.76 53.29 106.64
PCMark8 v2
Physics test(fps) 87.62 96.37 64.41 61.87
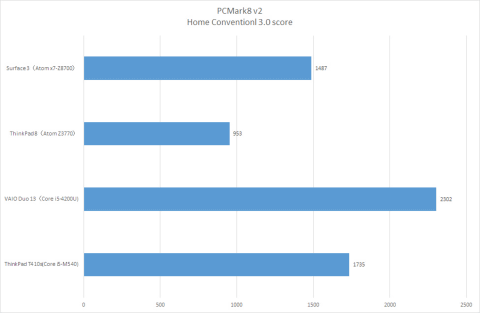
Home Conventionl 3.0 score 1735 2302 953 1487
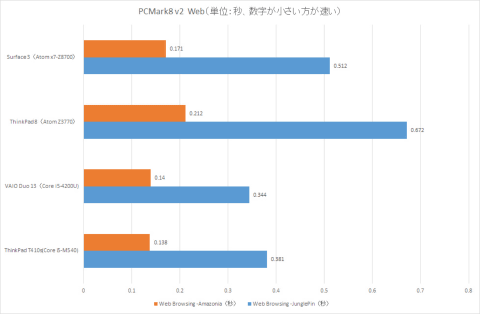
Web Browsing -JunglePin 0.381 0.344 0.672 0.512
Web Browsing -Amazonia 0.138 0.14 0.212 0.171
Writing 4.59 4.91 10.28 9.57
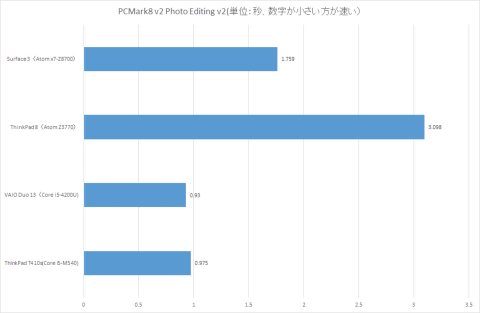
Photo Editing v2 0.975 0.93 3.098 1.759
Video Chat v2/Video Chat playback 1 v2(fps) 30 30 30 30
Video Chat v2/Video Chat encoding v2(ms) 183.7 142 393.7 212
WinSAT 5.3 23.8 4.1 14.2
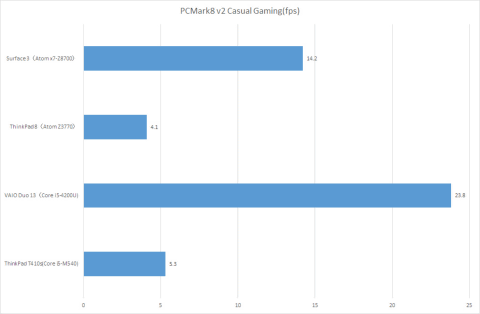
Casual Gaming(fps) 5.3 23.8 4.1 14.2
CrystalMark 4.0.3
Benchmark Duration 34分31秒 33分49秒 57分32秒 43分4秒
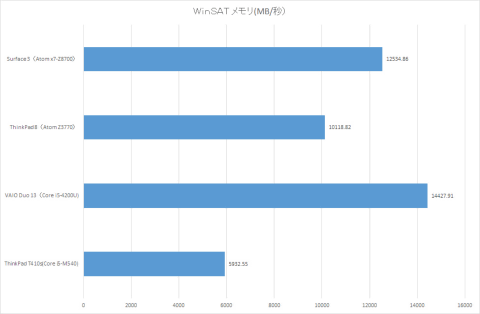
メモリ(MB/sec) 5932.55 14427.91 10118.82 12534.86
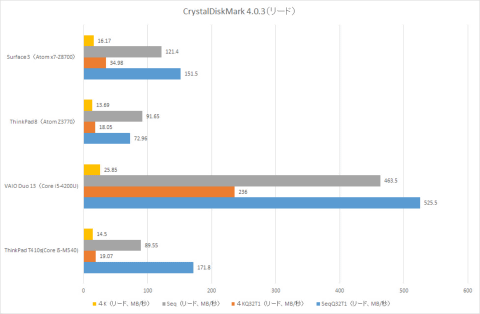
SeqQ32T1(リード、MB/sec) 171.8 525.5 72.96 151.5
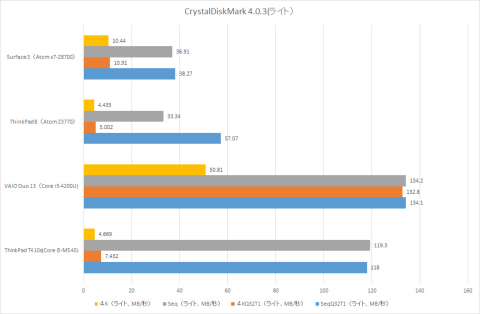
SeqQ32T1(ライト、MB/sec) 118 134.1 57.07 38.27
4KQ32T1(リード、MB/sec) 19.07 236 18.05 34.98
4KQ32T1(ライト、MB/sec) 7.432 132.8 5.002 10.91
Seq(リード、MB/sec) 89.55 463.5 91.65 121.4
Seq(ライト、MB/sec) 119.3 134.2 33.34 36.91
4K(リード、MB/sec) 14.5 25.85 13.69 16.17
4K(ライト、MB/sec) 4.669 50.81 4.435 10.44


g1_s.png

[그래프 1] PCMark8 v2

g2_s.png
[그래프 2] PCMark8 v2 Photo Editing v2
g3_s.png
【그래프 3] PCMark8 v2 Web
g4_s.png
[그래프 4] PCMark8 v2 Casual Gaming
g5_s.png
[그래프 5] 3DMark Score
g6_s.png
[그래프 6] WinSAT 메모리
g7_s.png
[그래프 7] CrystalDiskMark 4.0.3(읽기)
g8_s.png
【그래프 8] CrystalDiskMark 4.0.3(쓰기)


이를 보고 알 수 있는 것은 Bay Trail에서 Cherry Trail로의 성능 향상은 사실 꽤 크다는 것이다. 이번 비교에 준비한 ThinkPad 8은 Atom Z3770이라는 기본 클럭이 1.46GHz의 Bay Trail을 탑재하고 있으며 Surface 3에 탑재되고 있는 Atom x7-Z8700의 기본 클럭 1.6GHz에 비하면 CPU 클럭은 약간 낮다. 그래서 그 부문은 약간 에누리라고 생각할 수 있지만 그래도 PCMark8 v2의 종합 스코어(그래프 1)가 1.5배가 된 것은 충분히 주목할만 하다.


또, 5년 전의 하이엔드 PC인 ThinkPad T410s에 꽤 가까운 종합 성능이 됐으며 필자의 체감 지수는 Windows 8로 기동 속도 등이 많이 개선되고 있으므로 오히려 Surface 3가 쾌적하게 쓸 수 있다고 느꼈을 정도다.


다만 순수하게 CPU의 처리 성능을 필요로 하는 사진 편집 등은 역시 Core 프로세서 쪽이 빠르다는 것은 그래프 2의 PCMark8 v2 Photo Editing v2의 결과로 알수있다. 사진 편집과 같은 작업에서는 CPU 자체의 처리 능력과 클럭 주파수가 필요하기 때문에 Bay Trail이나 Cherry Trail은 다소 불리한 결과다. 그래도 Cherry Trail을 탑재한 Surface 3는 Bay Trail의 ThinkPad 8의 절반 시간으로 끝났고 역시 여기서도 큰 성능 향상을 확인했다.


GPU의 성능은 그래프 4와 그래프 5를 참고로 하면 Bay Trail이 초대 Core i5와 거의 비슷한 성능인 반면 Cherry Trail을 탑재한 Surface 3은 크게 성능이 향상 된 것으로 나타났다. 특히 PCMark v2의 캐주얼 게임 순위는 3.46배로 나타나 큰 성능 향상을 이루었다.


그래프 6의 WinSAT의 메모리 대역을 봐도 알 수 있듯이 메모리 대역은 얼마 올라가지 않았다. 3DMark가 상정하는 무거운 3D 게임에서는 메모리 대역에 대한 부하가 있는데 내장 GPU의 경우 메모리 대역폭을 CPU와 공유하고 있는 한편 독립 GPU처럼 메모리 대역을 충분히 확보하고 있다고 말하기 어려운 상황이다. 이 때문에 모처럼 EU가 4배가 늘어나도 성능은 4배 처럼은 안 된다.


같은 문제는 Core 프로세서의 GT2와 GT3에서도 있어 eDRAM이 탑재되지 않은 GT3의 GPU는 EU의 수가 배로 되어 있는데 역시 3DMark의 스코어는 배가 안 되는 것은 잘 알고 있다. 이 점은 향후 세대의 과제라 할 수 있다.


마지막으로 그래프 9의 스토리지에 대해서 언급하고 싶다. VAIO Duo 13의 내장 스토리지는 PCI Express SSD가 아니라 SATA 6Gbps의 SSD지만 그래도 꽤 빠른 부류의 SSD를 채용하고 있다. 그것과 비교하면 역시 eMMC 플래시 메모리는 너무 느리다. 특히 쓰기는 크게 떨어지는 결과가 엿보인다. 그러나 eMMC는 PCI Express SSD와 SATA에 비해서 소비 전력이 낮기 때문에 트레이드 오프라고 할 수밖에 없다. 물론 쾌적하게 쓸 수 있다고 보기는 어렵지만 읽기는 T410s에 저장된 초기의 SATA SSD보다 다소 늦어도 쓰기 랜덤은 T410s에 비해서 고속이다. 즉, HDD 보다는 쾌적하게 이용할 수 있고 몇 년전의 SSD 수준의 성능은 갖고 있으니 충분하다.


디지털 펜도 사용할 수 있고, 비즈니스 애플리케이션 중심의 사용자에 추천

이상과 같이 벤치마크 결과에서 보듯 Cherry Trail은 Bay Trail세대보다 크게 성능이 향상됐다. 이전의 기사에서도 말했지만 대부분의 Bay Trail 사용자는 동의하는 것으로 대용량 메모리를 사용하는 애플리케이션을 많이 실행하지 않는다면 Bay Trail의 Windows 태블릿은 충분히 쓸만했다. 즉 CPU와 GPU 성능은 Windows 8/8.1이 필요로 하는 최저 조건은 해결하고 있다고 할 수 있을 것이다. 다만 많은 제품이 메모리가 2GB, 제품에 따라서는 1GB 밖에 메모리가 탑재되지 않아 역시 대용량 메모리를 필요로 하는 어플리케이션이나 많은 애플리케이션을 동시에 실행하면 다소 힘들었던게 사실이다.


그러나 Surface 3에 탑재되고 있는 Atom x7-Z8700과 4G 메모리의 조합은 꽤 강력하고, GPU의 성능이 향상되고 있기 때문에 Bay Trail 보다 쾌적하게 이용할 수 있고, ThinkPad T410s와의 비교를 보면 몇 년전의 하이엔드 PC 수준 이상으로 Windows를 이용할 수 있다.


다만 사진 편집이나 동영상 편집과 같은 용도가 메인이라면 Surface 3은 별로 맞지 않을지도 모른다. 그것들은 CPU와 GPU의 성능을 더 필요로 하고 메모리도 8GB, 16GB 등으로 쾌적하게 조작할 수 있다. 그 의미에서 그러한 용도에도 쓰겠다고 하면 Surface Pro 3 등 Core 프로세서 + 8GB 메모리를 탑재한 제품을 선택하는 것이 행복할 것이다.


그러면 Surface 3는 누구에게 맞는 것인가 하면 역시 메인은 Office 어플리케이션이나 텍스트 에디터, 가끔 사진 편집도 한다는 비즈니스 유저다. 특히 옵션으로 준비된 디지털 펜을 이용하면 펜으로 메모를 따내기도 그렇지만 PDF 파일에 쓰고 사람에게 보내거나 하는 사용법도 가능하며 비즈니스의 생산성 향상에 큰 도움이 될 것이다. 집에서 사용하고 있는 메인 PC와 함께 이동 태블릿 겸 노트 PC로 사용하겠다는 서브 노트북적인 사용법이 상정 될 것으로 보인다.


필자 개인적으로는 역시 4GB의 메모리가 있는 편이 쾌적하게 쓸 수 있다고 생각하고 있으므로 좀 비싸도 4GB/128GB 모델을 구입하는 것을 추천으로 이 기사를 요약하고 싶다.


출처 - http://pc.watch.impress.co.jp/docs/column/ubiq/20150519_702621.html

반응형
Posted by 랩터 인터내셔널

mx.jpg


마이크론 크루셜 MX200 SSD 시리즈는 모두 Marvell 88SS9189 컨트롤러와 마이크론의 16나노 MLC 낸드 플래시가 탑재됩니다. 시퀀셜 읽기와 쓰기 모두 각각 555 MB/s, 500 MB/s, 랜덤 읽기와 쓰기도 100,000 IOPS, 87,000 IOPS로 동일 합니다. 워런티는 3년 입니다.


01_w_600.png


2.png


S-ATA 인터페이스와 2.5인치 폼팩터의 외형 입니다.


 3.png


마벨 컨트롤러와 마이크론의 16나노 MLC가 장착된 PCB 기판 입니다.


Sequential Read

4.png


Sequential Write

5.png


Random Read

6.png


Random Write

7.png

80% Read Sequential Mixed Workload

Our mixed workload testing is described in detail here, and our steady state tests are described here.


80% Read Random Mixed Workload


50.png

Notebook Battery Life

For more information on how we test notebook battery life, click here.


출처 - http://www.tomshardware.com/


마이크론 크루셜 MX200 SSD는 역시 가격대 성능비가 높은 제품 입니다.

반응형
Posted by 랩터 인터내셔널


인텔의 초소형 PC, 컴퓨트 스틱의 어낸드텍 리뷰


Intel PPSTCK1A32WFC Specifications
Processor Intel Atom Z3735F
(4C/4T x 1.33 GHz, 22nm, 2MB L2, 2.2W SDP)
Memory 1x 2GB DDR3L-1333 C9
Graphics Intel HD Graphics
Disk Drive(s) Samsung MBG4GC 32 GB eMMC
Networking 1x1 Realtek RTL8723BS 802.11n W-Fi
Audio Capable of 5.1/7.1 digital output with HD audio bitstreaming (HDMI)
Operating System Windows 8.1 with Bing x86
Pricing (As configured) USD 150
Full Specifications Intel PPSTCK1A32WFC Specifications


컴퓨트 스틱의 메인 프로세서는 인텔 베이트레일 아톰 Z3735F(4코어 4스레드,1.33GHz, 22나노, 2MB L2, 2.2W SDP), 메모리 2GB (DDR3L-1333 C9), 인텔 HD 그래픽, 삼성 32GB eMMC, 리얼텍 와이파이, 윈도우8.1, 가격 150달러


구성품 - 본체, 케이블, 변환기, 어댑터 등


Futuremark PCMark 8 - Home OpenCL

Futuremark PCMark 8 - Creative OpenCL

Futuremark PCMark 8 - Work OpenCL

Miscellaneous Futuremark Benchmarks

Futuremark PCMark 7 - PCMark Suite Score

Futuremark 3DMark 11 - Entry Score

Futuremark 3DMark 2013 - Ice Storm Score

Futuremark 3DMark 2013 - Cloud Gate Score

In the other Futuremark benchmarks evaluating 3D performance, we find the Compute Stick coming in last - this was to be expected, given that the GPU is clocked low at 311 MHz and also happens to operate mostly in the thermal limits put in place for a tablet platform.

We now move on to look at the benchmark modes in programs used on a day-to-day basis, i.e, application performance and not synthetic workloads.

x264 Benchmark

First off, we have some video encoding benchmarks courtesy of x264 HD Benchmark v5.0. This is simply a test of CPU performance. The Compute Stick manages to score better than the ECS LIVA in most of these tests thanks to the four cores (compared to the two in the latter).

Video Encoding - x264 5.0 - Pass 1

Video Encoding - x264 5.0 - Pass 2

7-Zip

7-Zip is a very effective and efficient compression program, often beating out OpenCL accelerated commercial programs in benchmarks even while using just the CPU power. 7-Zip has a benchmarking program that provides tons of details regarding the underlying CPU's efficiency. In this subsection, we are interested in the compression and decompression MIPS ratings when utilizing all the available threads. Again, the advantages of a quad-core SoC come through.

7-Zip LZMA Compression Benchmark

7-Zip LZMA Decompression Benchmark

TrueCrypt

As businesses (and even home consumers) become more security conscious, the importance of encryption can't be overstated. CPUs supporting the AES-NI instruction for accelerating the encryption and decryption processes have, till now, been the higher end SKUs. However, with Bay Trail, even the lowly Atom series has gained support for AES-NI. It is quite unlikely that any usage scenario for the Compute Stick is going to involve extensive encryption capabilities. However, the presence of AES-NI support in the Compute Stick's SoC piqued our interest.

TrueCrypt, a popular open-source disk encryption program can take advantage of AES-NI. Its internal benchmark provides some interesting cryptography-related numbers to ponder. In the graph below, we can get an idea of how fast a TrueCrypt volume would behave in the Intel PPSTCK1A32WFC and how it would compare with other select PCs. This is a purely CPU feature / clock speed based test. Interestingly, the Atom Z3735F is the only Bay Trail SoC in the graph below to have AES-NI capabilities.

TrueCrypt Benchmark


Futuremark PCMark 8 Storage Bench - Score

Futuremark PCMark 8 Storage Bench - Bandwidth

Note that we are benchmarking a microSDXC card with write speeds of the order of 40 MBps and read speeds of around 90 MBps - the results are not surprising, and should only be taken at face value. That said, in order to get an idea of the eMMC performance, we ran ATTO and CrystalDiskMark on the Samsung MBG4GC. A screenshot of the results is presented below.

On the networking side, we restricted ourselves to the evaluation of the WLAN component. Our standard test router is the Netgear R7000 Nighthawk configured with both 2.4 GHz and 5 GHz networks. The router is placed approximately 20 ft. away, separated by a drywall (as in a typical US building). A wired client (Zotac ID89-Plus) is connected to the R7000 and serves as one endpoint for iPerf evaluation. The PC under test is made to connect to either the 5 GHz (preferred) or 2.4 GHz SSID and iPerf tests are conducted for both TCP and UDP transfers. It is ensured that the PC under test is the only wireless client for the Netgear R7000. We evaluate total throughput for up to 32 simultaneous TCP connections using iPerf and present the highest number in the graph below.

Wi-Fi TCP Throughput

In the UDP case, we try to transfer data at the highest rate possible for which we get less than 1% packet loss.

Wi-Fi UDP Throughput (< 1% Packet Loss)

The numbers appear downright bad even when we consider that we are looking at a 1x1 802.11n connection. Surprisingly, when connected to another router in the same place, we were getting transfer rates in the order of 48 - 50 Mbps. However, the results graphed above have the numbers from the same router with the clients at the same location. Users will probably be seeing a wide range in the performance of the WLAN component.


YouTube Streaming - HTML5: Power Consumption


Netflix Streaming - Windows 8.1 Metro App: Power Consumption


Idle Power Consumption

Load Power Consumption (Prime95 + FurMark)


출처 - http://www.anandtech.com

반응형
Posted by 랩터 인터내셔널

pcmichael_full.jpg


pcvinewood_full.jpg


글로벌 화제의 게임 GTA5(Grand Theft Auto) PC 버전을 통한 GPU(VGA) 벤치마크 테스트 자료 입니다.


출처 - www.guru3d.com


우선 GTA5 PC 버전의 하드웨어 사양 입니다.


Minimum Specs

  • OS: Windows 8.1 64 Bit, Windows 8 64 Bit, Windows 7 64 Bit Service Pack 1, Windows Vista 64 Bit Service Pack 2* (*NVIDIA video card recommended if running Vista OS)
  • Processor: Intel Core 2 Quad CPU Q6600 @ 2.40GHz (4 CPUs) / AMD Phenom 9850 Quad-Core Processor (4 CPUs) @ 2.5GHz
  • Memory: 4GB
  • Video Card: NVIDIA 9800 GT 1GB / AMD HD 4870 1GB (DX 10, 10.1, 11)
  • Sound Card: 100% DirectX 10 compatible
  • HDD Space: 65GB


Recommended Specs

  • OS: Windows 8.1 64 Bit, Windows 8 64 Bit, Windows 7 64 Bit Service Pack 1
  • Processor: Intel Core i5 3470 @ 3.2GHZ (4 CPUs) / AMD X8 FX-8350 @ 4GHZ (8 CPUs)
  • Memory: 8GB
  • Video Card: NVIDIA GTX 660 2GB / AMD HD7870 2GB
  • Sound Card: 100% DirectX 10 compatible
  • HDD Space: 65GB


상기 최소 사양에는 켄츠필드 6600 및 AMD 페넘 9850과 4GB 메모리, 지포스 9800GT / 라데온 4870이라 표기 되고 있으나 실제 저 사양으로는 최저 옵션 구성으로도 힘들며 하단 권장 사양 급 이상은 되야 원할한 플레이가 가능합니다.


벤치마크 테스트에 사용된 하드웨어 구성은 8코어 Intel Core i7-5960X Extreme Edition 과 드라이버는 지포스(GeForce cards use the latest 350.12 WHQL driver) / 라데온(AMD Radeon graphics cards we used the latest 15.4 Beta driver) 버전이 적용 됐습니다.


GTA5 PC 버전은 콘솔 보다도 뛰어난 퀄리티를 자랑 합니다.


1600x1200 (UXGA mode) 테스트 입니다. 상위 타이탄X부터 라데온 295X2 - 라데온 290X - 지포스 980 - 라데온 290X - 지포스 970등의 서열을 보이고 있습니다.


1920x1080/1200 (Full HD) 테스트 입니다. 상위 타이탄X부터 라데온 295X2 - 지포스 980 - 라데온 290X 시리즈 - 지포스 970으로 이어집니다.


2560x1440 (WHQD) 테스트 입니다. 라데온 295X2가 타이탄X를 넘어서는 결과를 보입니다. 이어 타이탄X - 980 - 라데온 290X 시리즈 - 지포스 970 - 라데온 290 순 입니다.


3840x2160 (Ultra HD) 테스트 입니다. 역시나 라데온 295X2가 최고 성능, 이어 타이탄X - 라데온 290X - 지포스 980 - 라데온 290X - 라데온 290 순으로 이어집니다.


향후 GTA4 PC 버전에 맞춰 시스템 구매를 예정하고 있는 분들은 참고하여 구매하시기 바랍니다.

반응형
Posted by 랩터 인터내셔널


I don't think it's an overstatement to say that Intel introduced us to the era of modern SSDs back in 2008 with the X25-M. It wasn't the first SSD on the market, but it was the first drive that delivered the aspects we now take for granted: high, consistent and reliable performance. Many SSDs in the early days focused solely on sequential performance as that was a common performance metric for hard drives, but Intel understood that the key to better user performance wasn't the maximum throughput, but the small random IOs that take unbearably long to complete on HDDs. Thanks to Intel's early understanding of real world workloads and implementing the knowledge to a well designed product, it took several years before others were able to fully catch up with the X25-M.

But when the time came to upgrade to SATA 6Gbps, Intel missed the train. The initial SATA 6Gbps drives had to rely on third party silicon because Intel's own SATA 6Gbps controller was still in development, and to put it frankly the SSD 510 and SSD 520 just didn't pack the same punch as the X25-M did. The others had also done their homework and gone back to drawing board, which meant that Intel was no longer in the special position it was in 2008. Once the SSD DC S3700 with in-house Intel SATA 6Gbps controller finally materialized in late 2012, it quickly built back the Intel image that the company had in the X25-M days. The DC S3700 wasn't as revolutionary as the X25-M was, but it again focused on areas where other manufacturers had been lacking, namely performance consistency.


Intel SSD 750 Specifications
Capacity 400GB 1.2TB
Form Factor 2.5" 15mm SFF-8639 or PCIe Add-In Card (HHHL)
Interface PCIe 3.0 x4 - NVMe
Controller Intel CH29AE41AB0
NAND Intel 20nm 128Gbit MLC
Sequential Read 2,200MB/s 2,400MB/s
Sequential Write 900MB/s 1,200MB/s
4KB Random Read 430K IOPS 440K IOPS
4KB Random Write 230K IOPS 290K IOPS
Idle Power Consumption 4W 4W
Read/Write Power Consumption 9W / 12W 10W / 22W
Encryption N/A
Endurance 70GB Writes per Day for Five Years
Warranty Five Years
MSRP $389 $1,029


모델명 - Intel SSD 750

폼팩터 - 2.5" 15mm SFF-8639 / PCIe Add-In Card (HHHL)

인터페이스 - PCIe 3.0 4배속 - NVMe

컨트롤러 - Intel CH29AE41AB0

낸드 플래시 - Intel 20nm 128Gbit MLC

시퀀셜 읽기 : 2,200MB/s - 2,400MB/s

시퀀셜 쓰기 : 900MB/s - 1200MB/s

4KB 랜덤 읽기 : 430K IOPS / 440K IOPS

4KB 랜덤 쓰기 : 230K IOPS / 290K IOPS

아이들 전력소모 : 4W

로드 전력소모 : 9W / 12W - 10W / 22W

워런티 : 5년

가격 : 400GB = 389달러 / 1.2TB = 1029달러


PCB 기판 레이아웃


[ 테스트 시스템 ]


AnandTech 2015 SSD Test System
CPU Intel Core i7-4770K running at 3.5GHz (Turbo & EIST enabled, C-states disabled)
Motherboard ASUS Z97 Deluxe (BIOS 2205)
Chipset Intel Z97
Chipset Drivers Intel 10.0.24+ Intel RST 13.2.4.1000
Memory Corsair Vengeance DDR3-1866 2x8GB (9-10-9-27 2T)
Graphics Intel HD Graphics 4600
Graphics Drivers 15.33.8.64.3345
Desktop Resolution 1920 x 1080
OS Windows 8.1 x64


Performance Consistency


Steady-State 4KB Random Write Performance

Given the higher over-provisioning and an enterprise-oriented controller, it's no surprise that the SSD 750 has excellent steady-state random write performance. 

Steady-State 4KB Random Write Consistency


Intel SSD 750 1.2TB (PCIe 3.0 x4 - NVMe)
Default Intel SSD 750 1.2TB (PCIe 3.0 x4 - NVMe)Samsung SM951 512GB (PCIe 3.0 x4 - AHCI)Samsung XP941 512GB (PCIe 2.0 x4 - AHCI)Corsair Neutron XT 480GBCrucial MX100 512GBOCZ Vector 180 960GBSamsung SSD 850 Pro 512GBSanDisk Extreme Pro 480GB

At the initial cliff the performance drops to around 15K IOPS, but it quickly rises and seems to even out at about 22-23K IOPS. It actually takes nearly an hour for the SSD 750 to reach steady-state, which isn't uncommon for such a large drive but it's still notable. 

I couldn't run tests with added over-provisioning because NVMe drives don't support the usual ATA commands that I use to limit the LBA of the drive. There is similar command set for NVMe as well, but I'm still trying to figure out how to use them as there's isn't too much public info about NVMe tools.

Intel SSD 750 1.2TB (PCIe 3.0 x4 - NVMe)
Default Intel SSD 750 1.2TB (PCIe 3.0 x4 - NVMe)Samsung SM951 512GB (PCIe 3.0 x4 - AHCI)Samsung XP941 512GB (PCIe 2.0 x4 - AHCI)Corsair Neutron XT 480GBCrucial MX100 512GBOCZ Vector 180 960GBSamsung SSD 850 Pro 512GBSanDisk Extreme Pro 480GB


AnandTech Storage Bench - The Destroyer (Data Rate)

In terms of throughput, the SSD 750 is actually marginally slower than the SM951, although when you look at latency the SD 750 wins by a large margin. The difference in these scores is explained by Intel's focus on random performance as Intel specifically optimized the firmware for high random IO performance, which does have some impact on the sequential performance. As I've explained above, data rate has more emphasis on large IO size transfers, whereas latency treats all IOs the same regardless of their size.

AnandTech Storage Bench - The Destroyer (Latency)

The number of high latency IOs is also excellent and in fact the best we have tested. The SSD 750 is without a doubt a very consistent drive.

AnandTech Storage Bench - The Destroyer (Latency)

AnandTech Storage Bench - The Destroyer (Latency)


AnandTech Storage Bench - Heavy (Data Rate)


AnandTech Storage Bench - Heavy (Latency)

AnandTech Storage Bench - Heavy (Latency)

AnandTech Storage Bench - Light (Data Rate)


AnandTech Storage Bench - Light (Latency)

AnandTech Storage Bench - Light (Latency)


Iometer - 4KB Random Read


Iometer - 4KB Random Write


Iometer - 128KB Sequential Read


Iometer - 128KB Sequential Write


Iometer - Mixed 4KB Random Read/Write


Iometer - Mixed 128KB Sequential Read/Write


Incompressible Sequential Read Performance

Incompressible Sequential Write Performance


출처 - http://www.anandtech.com


어낸드텍의 공식 추천 SSD 선정. 5년의 워런티와 일반 컨슈머용 고성능 SSD

반응형
Posted by 랩터 인터내셔널

01_w_600.png


탐스 하드웨어(www.tomshardware.com)의 마이크론 크루셜 BX100 SSD 리뷰 입니다.


TABLE.png


BX100은 120GB부터 1테라바이트 모델까지 라인업 됩니다. 실리콘 모션의 SM2246EN 컨트롤러, 마이크론의 16나노 낸드 플래시가 탑재되고, 모두 보증 기간은 3년 입니다.  


랜덤 읽기 성능은 250GB까지 87,000 IOPS, 500GB 모델부터는 90,000 IOPS, 랜덤 쓰기 성능은 하위 모델부터 43,000 IOPS -  70,000 IOPS - 70,000 IOPS - 70,000 IOPS 입니다.


99_w_600.png


마이크론 SSD 관리 툴 Storage Executive 소프트웨어.


BX100.png


SM2246EN 컨트롤러와 2개의 DRAM 패키지, 16 NAND 패키지


40_w_600.png


41_w_600.png


50_w_600.png


57_w_600.png


58_w_600.png


출처 - http://www.tomshardware.com

반응형
Posted by 랩터 인터내셔널