'월드 벤치마크'에 해당되는 글 109건

  1. 2017.12.25 인텔 옵테인 SSD 900p 480GB 리뷰 : Diving Deeper Into 3D XPoint by 랩터 인터내셔널
  2. 2017.12.23 엔비디아 타이탄 V 리뷰 - Titanomachy: War of the Titans by 랩터 인터내셔널
  3. 2017.11.18 애플 아이폰X vs 안드로이드 스마트폰 성능비교 by 랩터 인터내셔널
  4. 2017.10.22 커피레이크 i5 8600k, 8400, i3 8350K, 8100 vs AMD 라이젠 승부 by 랩터 인터내셔널
  5. 2017.10.06 인텔 커피레이크 i7 8700K 성능, 새로운 시대의 왕권 강화 by 랩터 인터내셔널
  6. 2017.09.29 인텔 18코어 Core i9-7980XE, 16코어 Core i9-7960X 성능 확인 by 랩터 인터내셔널
  7. 2017.09.02 배틀그라운드 CPU 성능비교, 인텔 7700K vs 라이젠 1800X by 랩터 인터내셔널
  8. 2017.08.15 AMD 라데온RX 베가 56 & 64 성능 확인 by 랩터 인터내셔널
  9. 2017.08.15 AMD 라데온 베가 RX 64 8GB vs. 지포스GTX 1080 성능비교 by 랩터 인터내셔널
  10. 2017.08.11 공식) AMD 라이젠 스레드리퍼 1950X 성능 확인 by 랩터 인터내셔널


optane.jpg


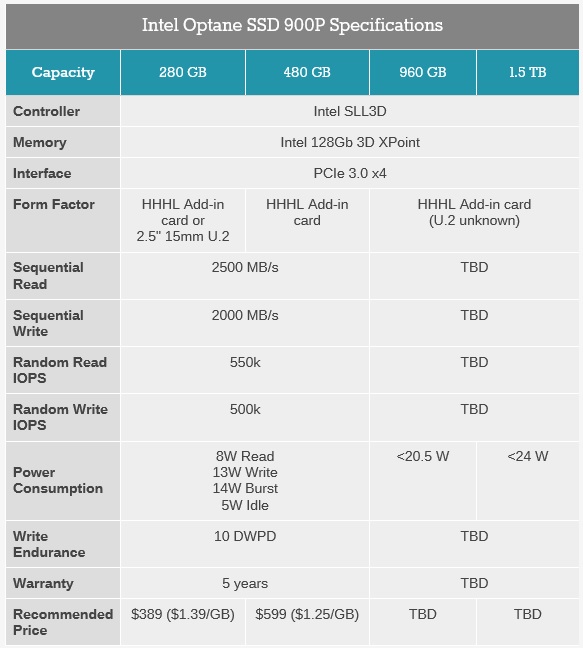
인텔 옵테인 SSD 900p 480GB 스펙


컨트롤러 : 인텔 SLL3D 

메모리 : 인텔 128Gb 3D XPoint 테크놀로지

인터페이스 : PCIe 3.0 x4

폼팩터 : HHHL Add-in card or 2.5" 15mm U.2 / HHHL Add-in card / HHHL Add-in card (U.2 unknown)

시퀀셜 읽기 : 2500MB/s

시퀀셜 쓰기 : 2000MB/s

랜덤 읽기 : 550k
랜덤 쓰기 : 500k
전력소모 : 읽기 : 8W / 쓰기 : 13W / 버스트 : 14W / 아이들 : 5W

워런티 : 5년

가격 : 280GB = 389달러 / 480GB = 599달러


테스트 시스템


AnandTech 2017 SSD Testbed
CPUIntel Xeon E3 1240 v5
MotherboardASRock Fatal1ty E3V5 Performance Gaming/OC
ChipsetIntel C232
Memory4x 8GB G.SKILL Ripjaws DDR4-2400 CL15
GraphicsAMD Radeon HD 5450, 1920x1200@60Hz
SoftwareWindows 10 x64, version 1703
Linux kernel version 4.12, fio version 2.21


ATSB - The Destroyer (Data Rate)

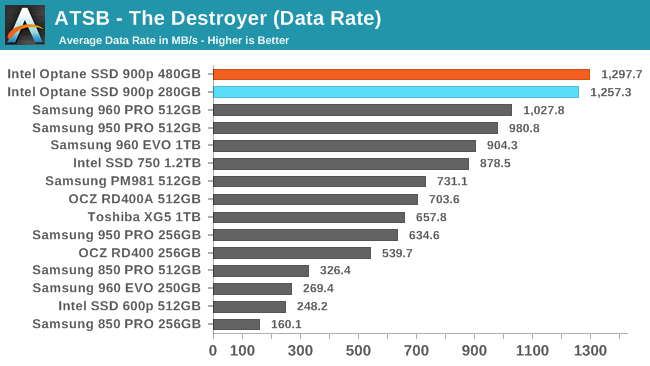
The average data rate of the 480GB Optane SSD 900p on The Destroyer is a few percent higher than the 280GB model scored, further increasing the lead over the fastest flash-based SSDs.

ATSB - The Destroyer (Average Latency)ATSB - The Destroyer (99th Percentile Latency)

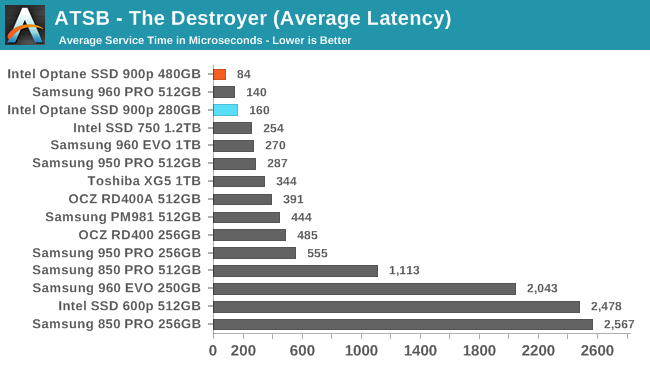
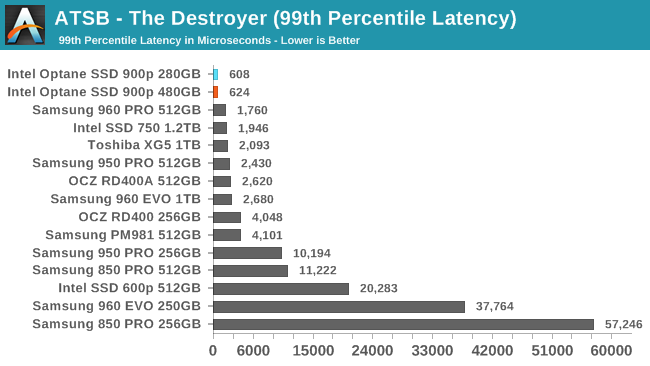
The 480GB Optane SSD 900p shows a substantial drop in average latency relative to the 280GB model, allowing it to score better than any flash-based SSD. For 99th percentile latency the 480GB model scores slightly worse than the 280GB, but both are still far ahead of any competing drive.

ATSB - The Destroyer (Average Read Latency)ATSB - The Destroyer (Average Write Latency)

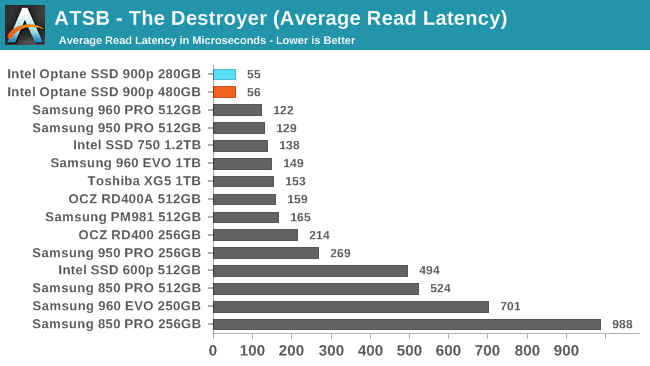
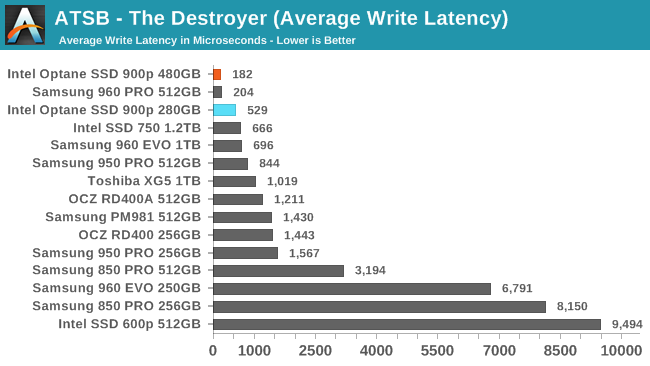
The two capacities of Optane SSD 900p have essentially the same average read latency that is less than half that of any flash-based SSD. For average write latency, the 480GB model sets a new record while the 280GB performed worse than it did the first time around, but still faster than anything other than the Samsung 960 PRO.

ATSB - The Destroyer (99th Percentile Read Latency)ATSB - The Destroyer (99th Percentile Write Latency)

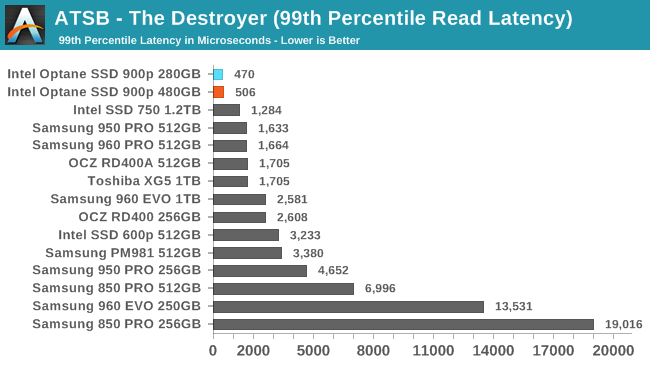
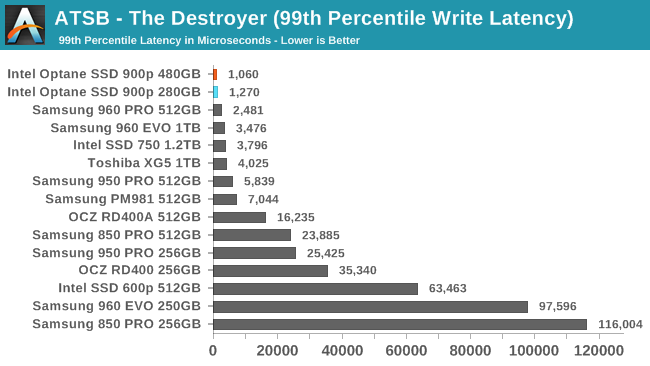
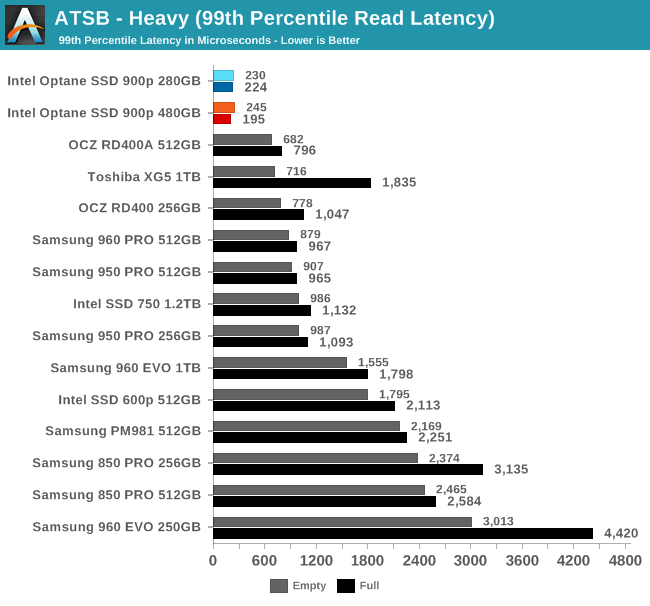
The 99th percentile read and write latency scores for the Optane SSD 900p are all substantially better than any flash-based SSD, even though the 280GB's results again show some variation between this test run and our original review. The 99th percentile read latency scores are particularly good, with the Optane SSDs around 0.5ms while the best flash-based SSDs are in the 1-2ms range.


ATSB - Heavy (Data Rate)

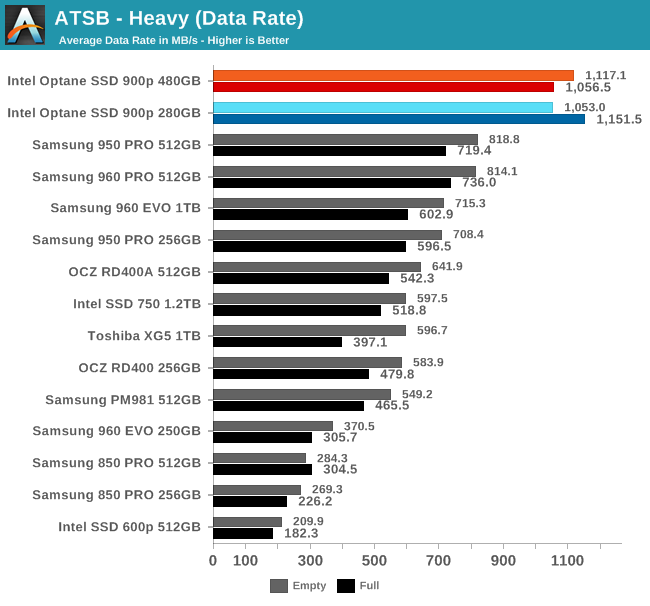
The Optane SSD 900p in either capacity delivers a much higher average data rate on the Heavy test than any flash-based SSD. As with the original review, the 280GB model is a bit faster when the drive is pre-filled than when the test is run on a freshly-erased drive; the opposite is almost always true of flash-based SSDs. The 480GB's results look more normal and fall in the same range as the 280GB's scores.

ATSB - Heavy (Average Latency)ATSB - Heavy (99th Percentile Latency)

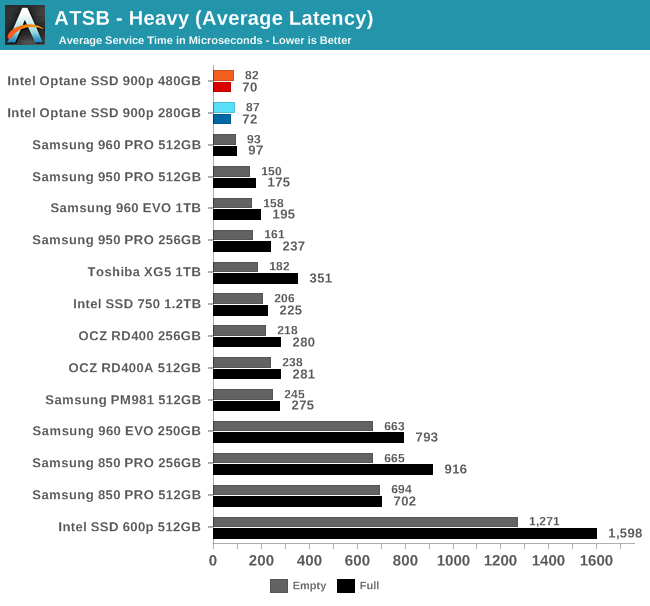
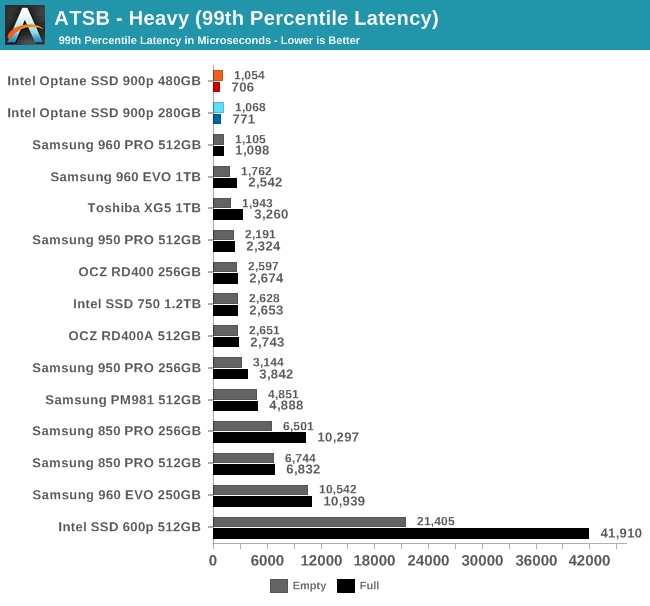
The average and 99th percentile latency scores of both Optane SSD capacities are slightly ahead of the fastest flash-based SSDs. Both models also show lower latency when the drive is filled than when it is freshly erased.

ATSB - Heavy (Average Read Latency)ATSB - Heavy (Average Write Latency)

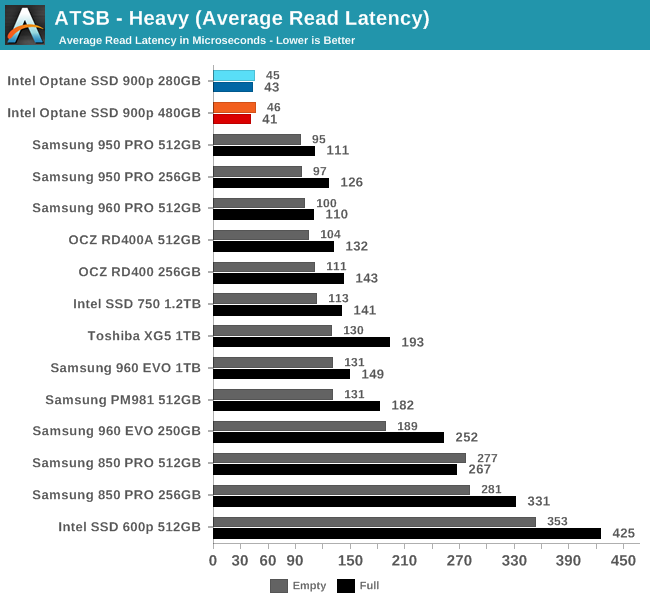
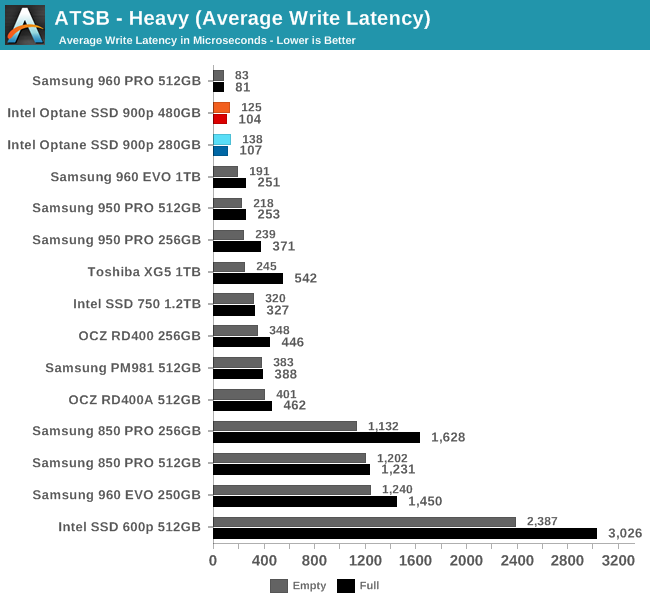
The average read latency of the Optane SSD 900p on the Heavy test is about the same for both capacities, and about half that of any flash-based SSD. The average write latencies are a bit worse than the Samsung 960 PRO but still clearly better than the 960 EVO or anything else.

ATSB - Heavy (99th Percentile Read Latency)ATSB - Heavy (99th Percentile Write Latency)

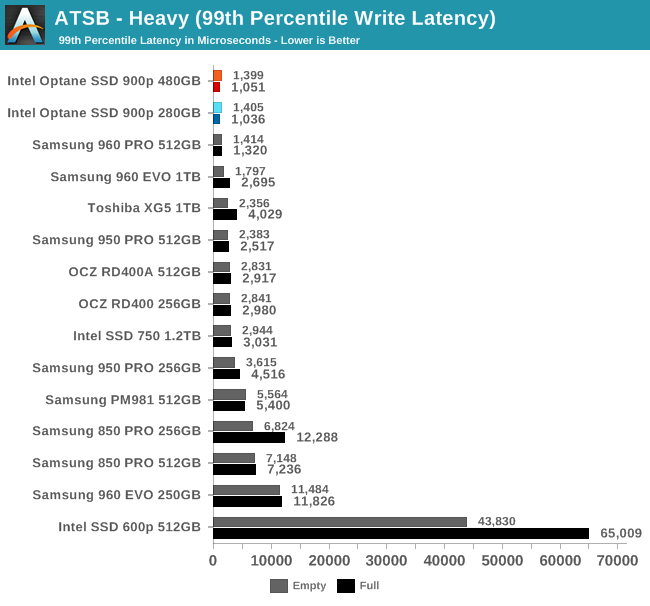
The 99th percentile read latency scores for the Optane SSDs are a fraction of the latency of any other drive, and both capacities of the 900p score about the same. The 99th percentile write latency is barely faster than the Samsung 960 PRO.

ATSB - Heavy (Power)

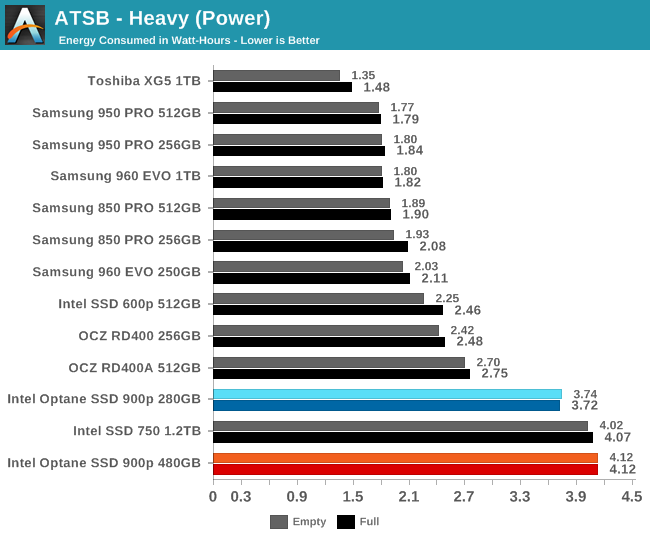
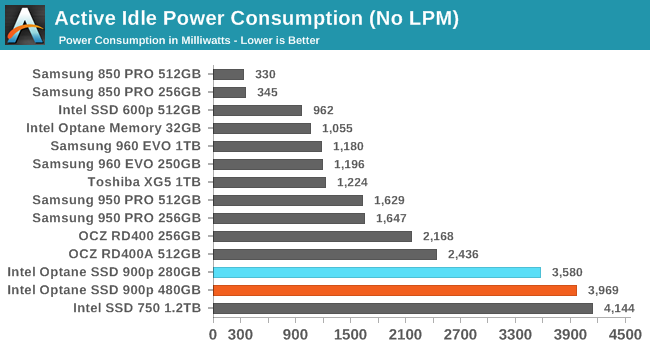
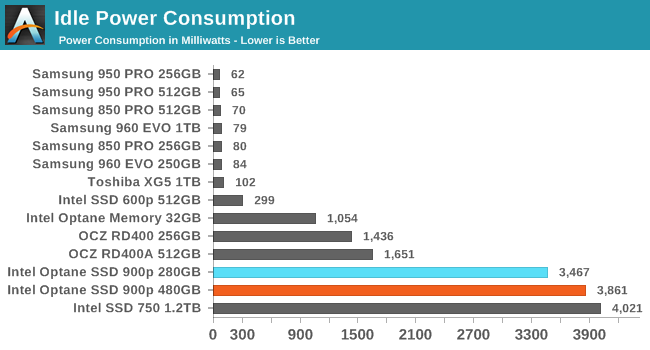
The power consumption of the Optane SSDs fits their heritage as derivatives of an enterprise drive. The only other consumer SSD this power hungry is the Intel SSD 750, another enterprise derivative. Even the M.2 PCIe SSDs with relatively poor power management and low performance use much less energy over the course of the test.

The 480GB 900p uses about 10% more energy than the 280GB model while performing about the same.


ATSB - Light (Data Rate)

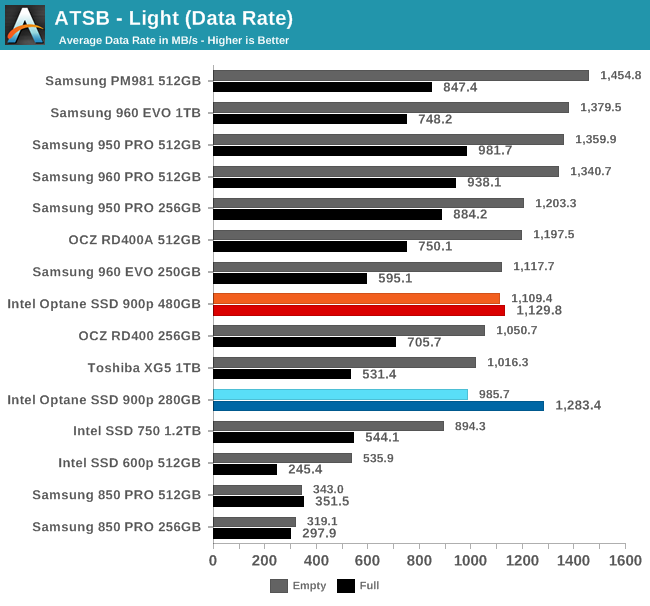
The Light test shows much greater differences between full and empty drive performance, for both flash SSDs and for the rather variable 280GB Optane SSD 900p. The 480GB model shows less variation in its average data rater between the full and empty runs. Overall, the Optane SSDs outperform a full flash-based SSD but are unimpressive compared to a fresh out of the box flash-based SSD.

ATSB - Light (Average Latency)ATSB - Light (99th Percentile Latency)

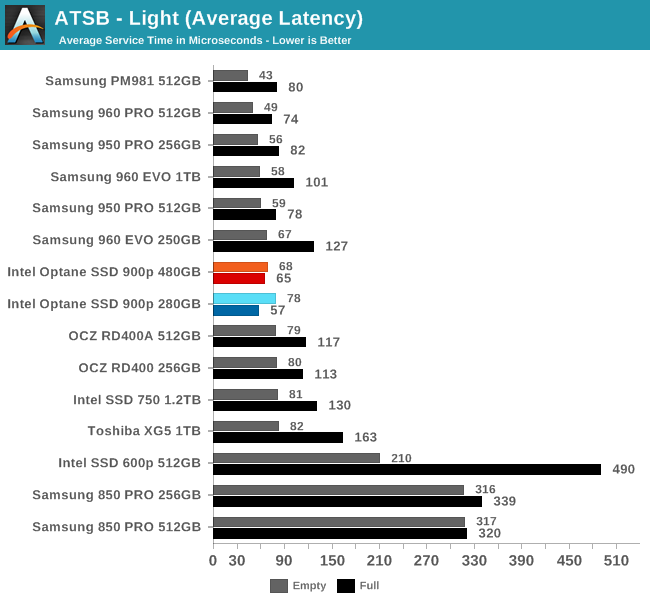
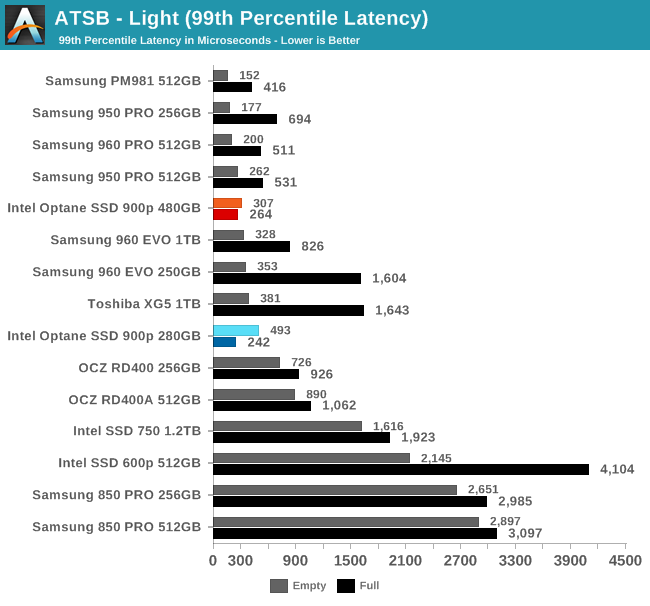
Aside from the different behavior of full vs empty, the average and 99th percentile latency scores of the Optane SSDs are not too interesting. The best-case performance is not quite as fast as the best from a flash based SSD, but once the flash drive is slowed down by being full, the Optane SSD shows a meaningful latency advantage.

ATSB - Light (Average Read Latency)ATSB - Light (Average Write Latency)

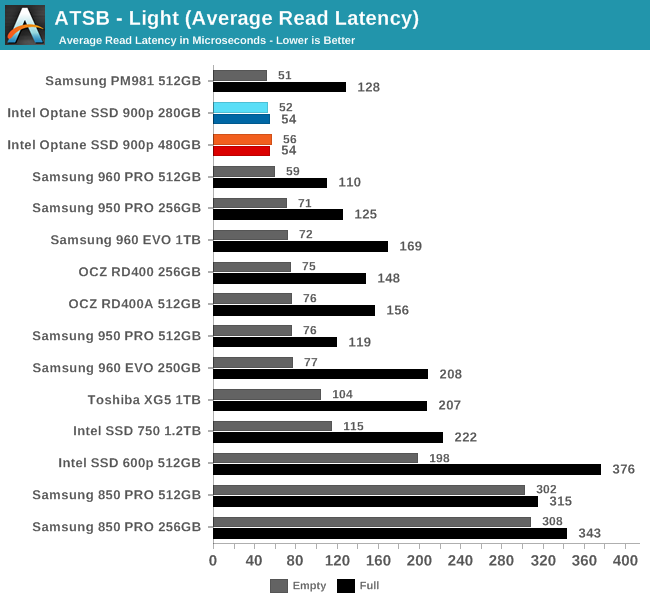
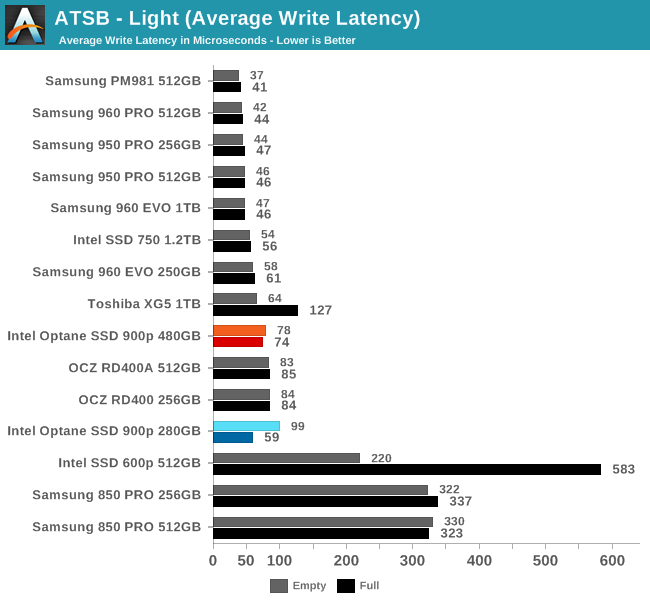
The average read latency of the Optane SSDs on the Light test is not hurt by filling the drive, giving it much better latency in the worst case scenario than any flash-based SSD. When the Light test is run on freshly-erased drives, the Optane SSD's average read latency is about the same as the best flash-based drives. Neither Optane SSD sets a record for average write latency, and Samsung's fastest NVMe drives have a clear advantage.

ATSB - Light (99th Percentile Read Latency)ATSB - Light (99th Percentile Write Latency)

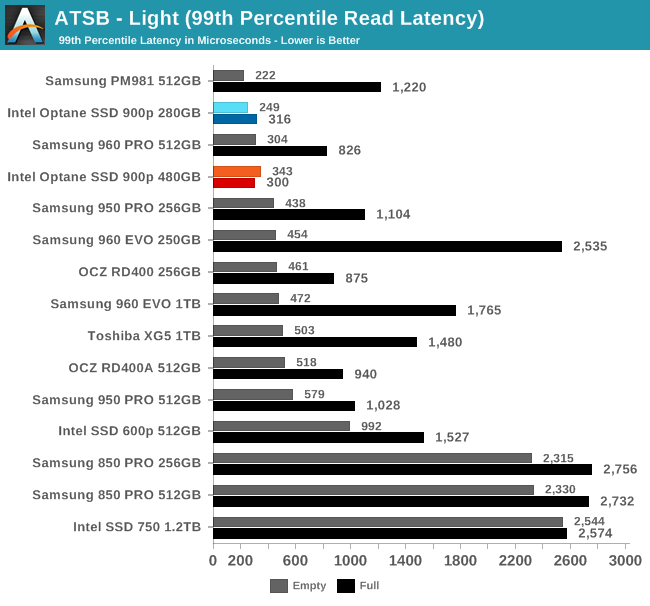
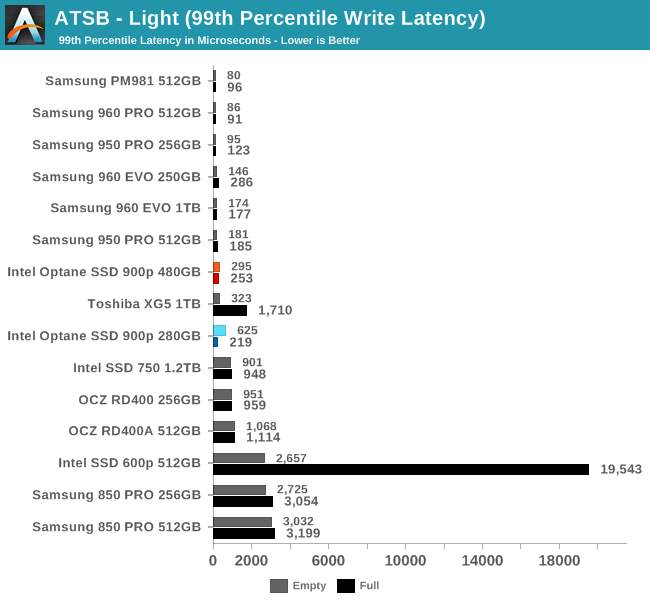
As with the average read latency, the 99th percentile read latency of the Optane SSDs on the Light test only impresses when compared to the performance of flash-based SSDs in unfavorable conditions like being completely full. Otherwise, the Samsung PM981 performs just as well, and the 960 PRO isn't far behind. The 99th percentile write latency of the Optane SSDs is clearly worse than Samsung's top NVMe SSDs.

ATSB - Light (Power)

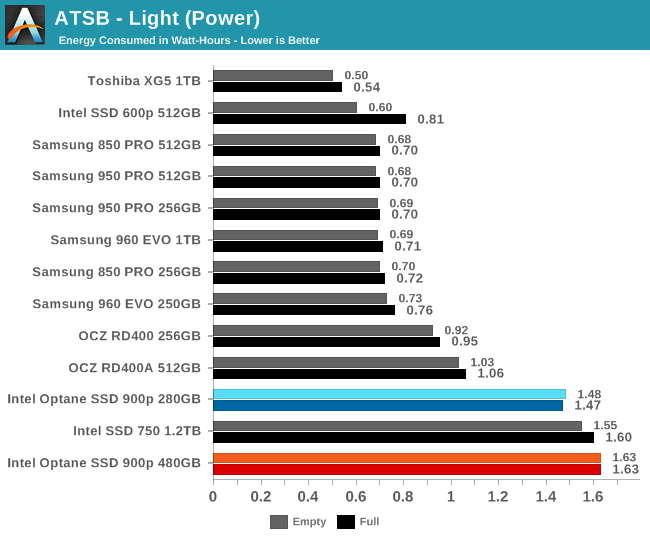
The Optane SSD 900p again requires much more energy than most NVMe SSDs, and the larger Optane drive requires significantly more power—three times as much as the most efficient NVMe SSD we've tested.


Burst 4kB Random Read (Queue Depth 1)

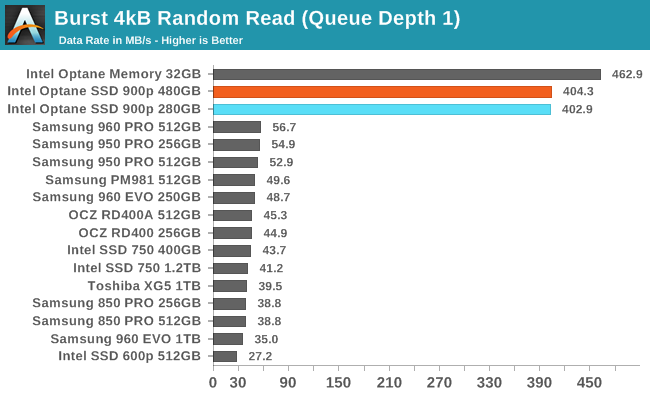
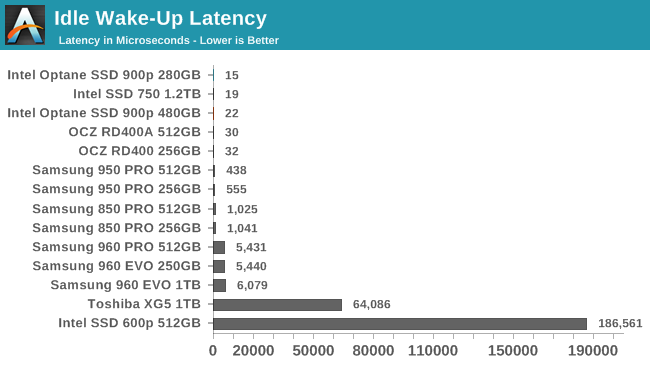
Random reads at queue depth 1 are where Intel's Optane products shine. Compared to the fastest NVMe SSDs using MLC NAND flash, the Optane SSDs aren't quite an order of magnitude faster, but only because the latency of the NVMe protocol over PCIe becomes the bottleneck. Intel's tiny Optane Memory M.2 cache drive is slightly faster in this one benchmark, but the difference hardly matters.

Our sustained random read performance is similar to the random read test from our 2015 test suite: queue depths from 1 to 32 are tested, and the average performance and power efficiency across QD1, QD2 and QD4 are reported as the primary scores. Each queue depth is tested for one minute or 32GB of data transferred, whichever is shorter. After each queue depth is tested, the drive is given up to one minute to cool off so that the higher queue depths are unlikely to be affected by accumulated heat build-up. The individual read operations are again 4kB, and cover a 64GB span of the drive.

Sustained 4kB Random Read

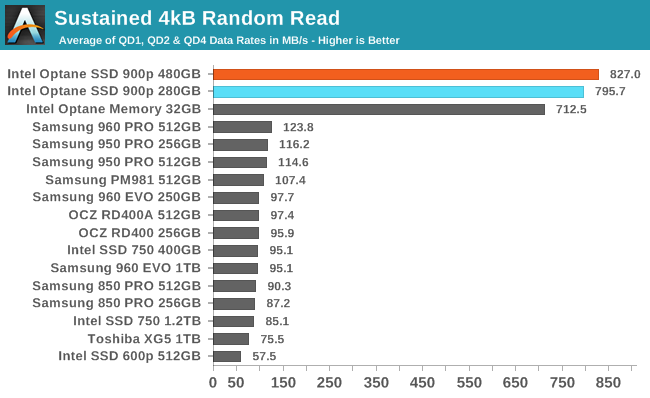
Adding some higher queue depths to the average shows a small speed advantage for the 480GB Optane SSD over the 280GB model, and the Optane Memory M.2 starting to fall behind the larger Optane SSDs. The NAND flash-based SSDs also pick up speed as queue depths grow, but they need to go far beyond QD4 to catch up.

Sustained 4kB Random Read (Power Efficiency)

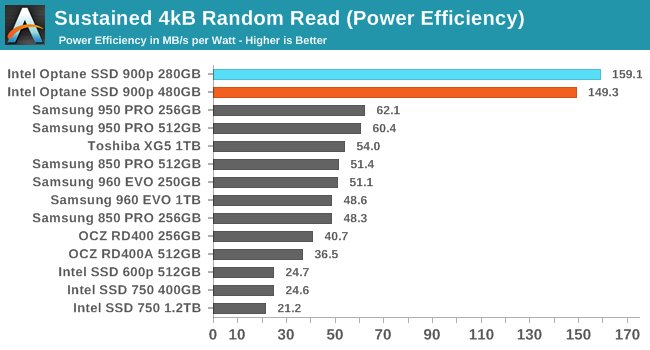
Given how thoroughly the Optane SSDs have shattered the record for random read performance, it's not too surprising to see them at the top of the charts for power efficiency when performing random reads. The 480GB Optane SSD is a bit less efficient than the smaller model because it has to power significantly more 3D XPoint memory chips with only a small performance boost to show for it. Compared to the flash-based SSDs, the Optane SSDs are only about 2.5 times more efficient, despite being about 7 times faster. The performance doesn't come for free.


At low queue depths the two Optane SSDs offer nearly the same random read performance. When they both reach saturation at QD8, the 480GB model has slightly higher performance, and is drawing about 0.85W more power—a 13% power increase for a 7% performance boost.

Random Write Performance

Our test of random write burst performance is structured similarly to the random read burst test, but each burst is only 4MB and the total test length is 128MB. The 4kB random write operations are distributed over a 16GB span of the drive, and the operations are issued one at a time with no queuing.

Burst 4kB Random Write (Queue Depth 1)

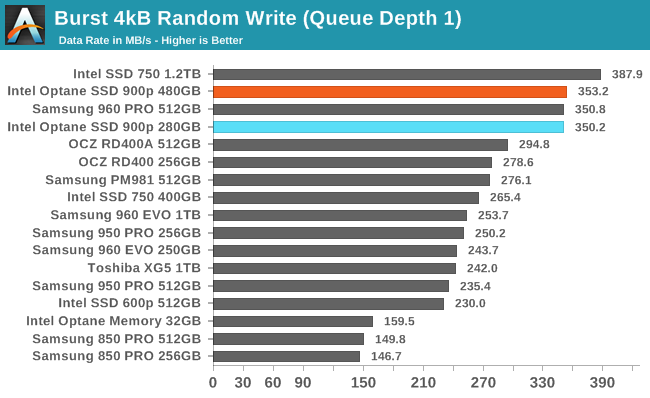
The random write performance at queue depth 1 of the Optane SSDs is great, but not record-setting. Flash-based SSDs can cache write operations in their DRAM and report the command as complete before the data has actually made it to the flash memory. This means that for most flash-based SSDs the burst random write speed is more of a controller benchmark than a test of the storage itself. The Optane SSDs don't have large DRAM caches on the drive and are actually writing to the 3D XPoint memory almost as quickly as the Intel SSD 750 can stash the writes in its DRAM.

As with the sustained random read test, our sustained 4kB random write test runs for up to one minute or 32GB per queue depth, covering a 64GB span of the drive and giving the drive up to 1 minute of idle time between queue depths to allow for write caches to be flushed and for the drive to cool down.

Sustained 4kB Random Write

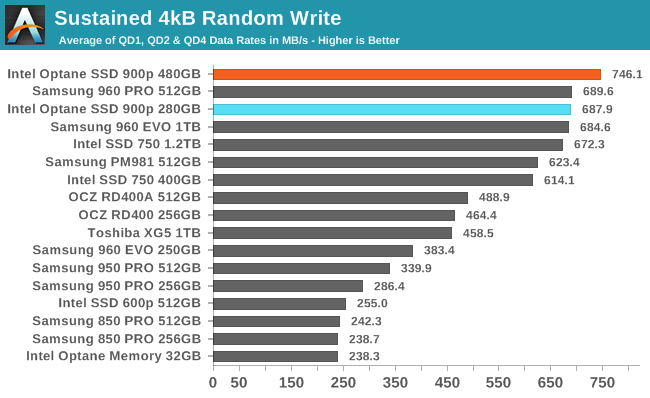
With larger queue depths and test durations long enough to defeat any DRAM-based write caching and many SLC write caches, the Optane SSDs rise to the top. With this second round of testing, the 280GB Optane SSD performed slightly worse than the first run, but it's still essentially tied with the fastest flash-based SSDs. The 480GB model is a tiny bit faster than even the previous record from the 280GB model, putting it about 8% faster than the Samsung 960 PRO.

Sustained 4kB Random Write (Power Efficiency)

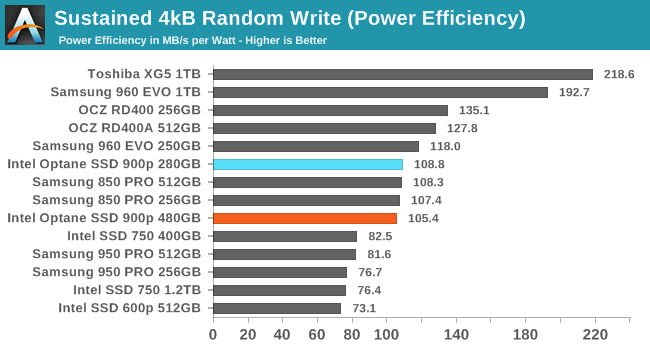
Without a huge performance lead, the high power consumption of the Optane SSDs takes a toll on their efficiency scores for random writes. They are ahead of early NVMe SSDs and on par with the fastest SATA SSDs, but the best current flash-based NVMe SSDs are substantially more efficient. The Toshiba XG5 prioritized efficiency over peak performance and ends up offering more than twice the power efficiency of the Optane SSDs, while the Samsung 960 EVO has a mere 77% efficiency advantage at essentially the same level of performance.


As with random reads, the performance and power consumption gap between the two Optane SSD 900p capacities widens at higher queue depths. With power consumption starting at 5W and climbing to over 10W for the larger model, the Optane SSDs are in a completely different league from M.2 NVMe SSDs, which mostly top out around 4.5W.


Burst 128kB Sequential Read (Queue Depth 1)

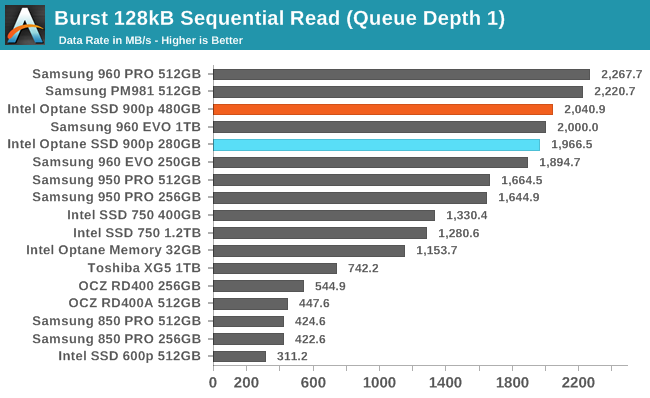
Despite having incredibly low access latency, the Optane SSD 900p doesn't beat the fastest flash-based SSDs in our burst sequential read test. The fastest flash SSDs make up for their slower initial response time through a combination of higher channel counts, prefetching and most likely larger native block sizes. The Optane SSD 900p still has a great score here, but it fails to stand out from the much cheaper flash-based drives.

Our test of sustained sequential reads uses queue depths from 1 to 32, with the performance and power scores computed as the average of QD1, QD2 and QD4. Each queue depth is tested for up to one minute or 32GB transferred, from a drive containing 64GB of data.

Sustained 128kB Sequential Read

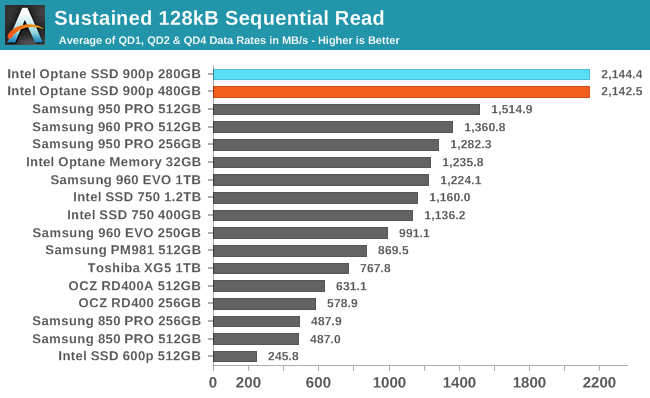
With the test of higher queue depths and longer run times, the Optane SSDs are back on top with a substantial performance lead. Unlike the burst test, this test shows almost no performance difference between the two capacities of the Optane SSD 900p.

Sustained 128kB Sequential Read (Power Efficiency)

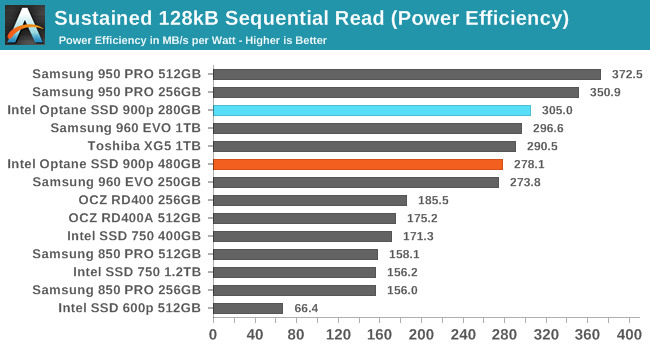
The performance lead of the Optane SSD 900p isn't enough to make up for its higher power consumption, so the 900p ends up in the second tier of drives for sequential read power efficiency, alongside Samsung's 960 generation and the Toshiba XG5.


The 480GB Optane SSD 900p draws about 0.6–0.75W more than the 280GB model during the sequential read test, putting it just over 8W total when operating at full speed. Even the smaller 900p is still over 6W at QD1, while the flash-based SSDs are mostly in the 4-5W range. (The Intel SSD 750 breaks 9W at higher queue depths.)

Sequential Write Performance

Our test of sequential write burst performance is structured identically to the sequential read burst performance test save for the direction of the data transfer. Each burst writes 128MB as 128kB operations issued at QD1, for a total of 1GB of data written to a drive containing 16GB of data.

Burst 128kB Sequential Write (Queue Depth 1)

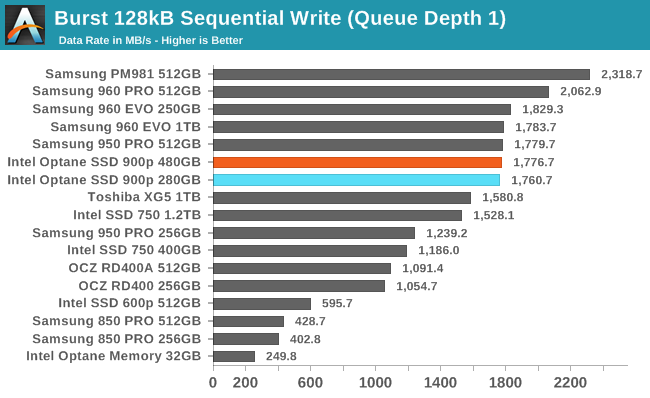
The burst sequential write performance of the Intel Optane SSD 900p is on par with some of Samsung's older NVMe SSDs, but is exceeded by the 960 generation and the PM981.

Our test of sustained sequential writes is structured identically to our sustained sequential read test, save for the direction of the data transfers. Queue depths range from 1 to 32 and each queue depth is tested for up to one minute or 32GB, followed by up to one minute of idle time for the drive to cool off and perform garbage collection. The test is confined to a 64GB span of the drive.

Sustained 128kB Sequential Write

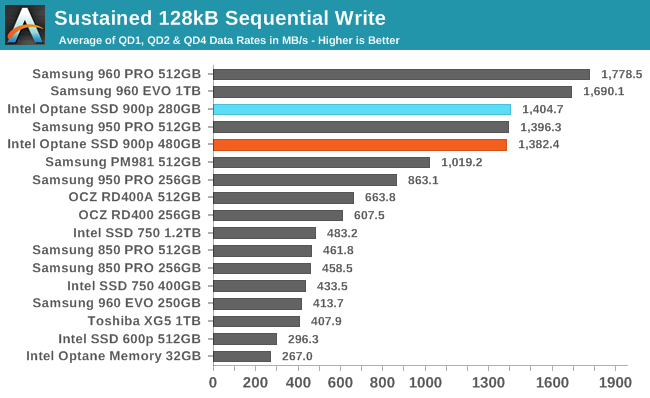
On the longer sequential write test, the Samsung PM981 falls out of first place and ends up substantially slower than the Optane SSD 900p, but the Samsung 960 PRO and EVO are still faster than the 900p.

Sustained 128kB Sequential Write (Power Efficiency)

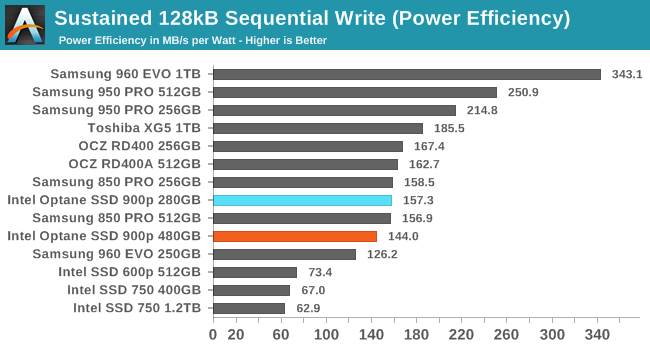
The power efficiency of the Optane SSD 900p during sequential writes is worse than most M.2 NVMe SSDs, though not as bad as the extremely power-hungry Intel SSD 750.


The two capacities of the Optane SSD 900p offer essentially identical sequential write performance. As with sequential reads, the difference in power consumption between the two capacities is about 0.75W, but the writes require about than 2W more than the reads.


Mixed 4kB Random Read/Write

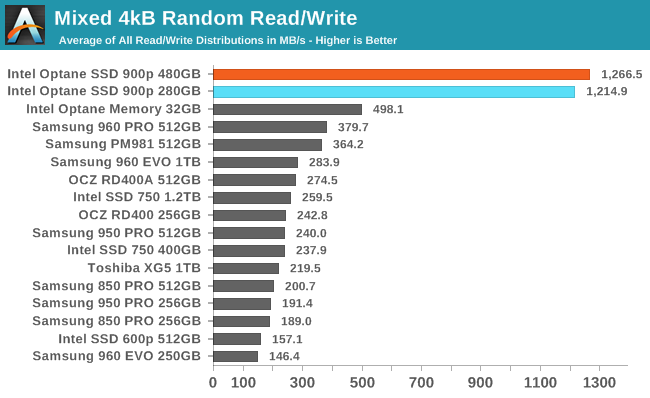
Since this mixed random I/O test is conducted at the relatively low queue depth of four, the Optane SSDs have a large performance advantage, and even the tiny Optane Memory M.2 does well (though it has to run a slightly modified version of the test due to its low capacity). The Optane SSDs are more than three times faster overall than the highest-scoring flash-based SSD.

Mixed 4kB Random Read/Write (Power Efficiency)

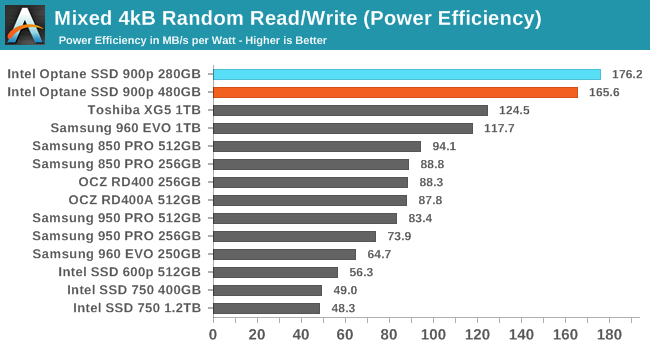
The Optane SSDs have a substantial power efficiency lead on the mixed random I/O test, but it is small enough that flash-based SSDs could conceivably catch up with a generation or two of improvements. As usual, the 480GB model has clearly lower efficiency because its minor performance advantage doesn't outweigh the power cost the extra 3D XPoint memory chips.


Both capacities of the Intel Optane SSD 900p show a modest decline in performance as the workload becomes more write-heavy, and a fairly linear increase in power consumption. The  480GB model's power consumption grows slightly faster than the 280GB model, leading to a 0.9W gap at the end of the test.

Even the Intel SSD 750 draws substantially less power for most of the test, though it catches up at the very end. The flash-based M.2 NVMe SSDs are mostly drawing a fraction of what the Optane SSDs require. In terms of performance, none of the flash-based SSDs come at all close to the Optane SSDs until the very end of the test, where many are able to deliver good random write speed.

Mixed Sequential Performance

Our test of mixed sequential reads and writes differs from the mixed random I/O test by performing 128kB sequential accesses rather than 4kB accesses at random locations, and the sequential test is conducted at queue depth 1. The range of mixes tested is the same, and the timing and limits on data transfers are also the same as above.

Mixed 128kB Sequential Read/Write

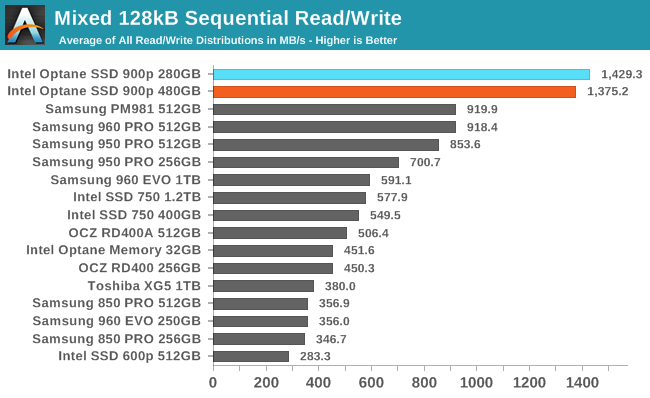
The Intel Optane SSD 900p is much faster on the mixed sequential I/O test than any consumer flash-based SSD. Samsung's best drives are slower by a third, and it's downhill from there for NAND flash. The 480GB model actually performed slightly worse on this test than the 280GB model, but the difference is small enough it may simply be due to variation between runs.

Mixed 128kB Sequential Read/Write (Power Efficiency)

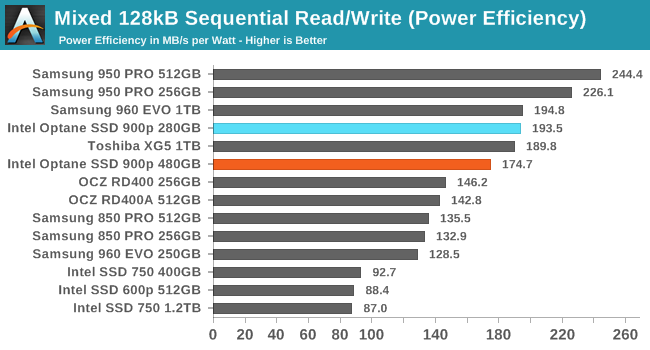
The power efficiency of the Optane SSD 900p on the mixed sequential I/O test is good but not quite at the top of the charts. Instead, it is on par with the Samsung 960 EVO, which sacrificed a bit of efficiency to improve performance relative to the Samsung 950 PRO.


The 280GB Optane SSD 900p was a bit faster than the 480GB overall but a bit less steady over the course of the test. The scaling of the Optane SSDs is quite similar to the results from the mixed random test: a gradual decline in performance as the proportion of writes increases, and a linear increase in power consumption. The overall performance level is significantly higher than for the random I/O test.

The flash-based SSDs can get much closer to competing with the Optane SSDs on this mixed sequential test than on the mixed random test. Several drives have sequential read speeds that approach that of the Optane SSDs, and a few have higher sequential write performance. But through the middle portions of the test, the flash-based SSDs all lose a lot of their performance for at least a few phases of the test, while the Optane SSD has no acute performance weakness.


Active Idle Power Consumption (No LPM)Idle Power Consumption

(idle power)

Idle Wake-Up Latency

(idle wake-up)


출처 - https://www.anandtech.com

반응형
Posted by 랩터 인터내셔널

엔비디아의 인공지능 GPU - 타이탄 V 리뷰


NVIDIA GPU DirectX Graphics Feature Info
 Volta
(Titan V)
Pascal
(Titan Xp)
Direct3D Feature Level12_112_1
Fast FP16 ShadersNoNo
Tiled ResourcesTier 3Tier 3
Resource BindingTier 3Tier 3
Conservative RasterizationTier 3Tier 2
Resource HeapTier 1Tier 1


[ 테스트 시스템 ]


CPU:Intel Core i7-7820X @ 4.3GHz
Motherboard:Gigabyte X299 AORUS Gaming 7 (BIOS version F7)
Power Supply:Corsair AX860i
Hard Disk: OCZ Toshiba RD400 (1TB)
Memory:G.Skill TridentZ DDR4-3200 4 x 8GB (16-18-18-38)
Case:NZXT Phantom 630 Windowed Edition
Monitor:LG 27UD68P-B
Video Cards:NVIDIA Titan V
NVIDIA Titan Xp
NVIDIA GeForce GTX Titan X (Maxwell)
NVIDIA GeForce GTX Titan
Video Drivers:NVIDIA Release 388.59
OS:Windows 10 Pro (Creators Update)


Synthetic: Beyond3D Suite - Estimated FMA Latency


Compute: General Matrix Multiply Performance (GEMM)


Compute: SiSoft Sandra 2017 - GP Processing (Compute Shader)


Compute: SiSoftware Sandra 2017 - Video Shader Compute (DX11)


Compute: SiSoft Sandra 2017 - GP Financial Analysis (OpenCL)


Compute: Geekbench 4 - GPU Compute - Total Score


Compute: CompuBench 2.0 - Level Set Segmentation 256

Compute: CompuBench 2.0 - N-Body Simulation 1024K

Compute: CompuBench 2.0 - Optical Flow


Synthetic: TessMark, Image Set 4, 64x Tessellation


Synthetic: Beyond3D Suite - Pixel Fillrate


Synthetic: Beyond3D Suite - Integer Texture Fillrate (INT8)

Synthetic: Beyond3D Suite - Floating Point Texture Fillrate (FP32)


Battlefield 1 - 3840x2160 - Ultra Quality

Battlefield 1 - 99th Percentile - 3840x2160 - Ultra Quality

Ashes of the Singularity: Escalation - 3840x2160 - Extreme Quality

Ashes: Escalation - 99th Percentile - 3840x2160 - Extreme Quality

Already after Battlefield 1 (DX11) and Ashes (DX12), we can see that Titan V is not a monster gaming card, though it still is faster than Titan Xp. This is not unexpected, as Titan V's focus is quite far away from gaming as opposed to the focus of the previous Titan cards.

Doom - 3840x2160 - Ultra Quality

Doom - 99th Percentile - 3840x2160 - Ultra Quality

Ghost Recon Wildlands - 3840x2160 - Very High Quality

Deus Ex: Mankind Divided - 3840x2160 - Ultra Quality

Grand Theft Auto V - 3840x2160 - Very High Quality

Grand Theft Auto V - 99th Percentile - 3840x2160 - Very High Quality

Total War: Warhammer - 3840x2160 - Ultra Quality


Crysis: Warhead (DX10) - 3840x2160 - Enthusiast Quality, 4xSSAA


Closing out today’s preview, it’s hard not to come away impressed with what we’ve seen. But we’ve also just scratched the surface over the span of a few days. We’re going to continue looking at the Titan V, including getting some deep learning software up and running. Which is not to say that Titan V is merely a deep learning accelerator – it’s clearly much more than that – but this is definitely one of the most practical uses for the hardware right now, especially as software developers just now get their hands on Volta. Though for that matter I think it’ll be interesting to see what academics and researchers do with the hardware; they were one of the driving forces behind the original GTX Titan, and it’s no mistake that NVIDIA has a history of giving away Titans to these groups. Part of the need for a card like the Titan V in NVIDIA’s lineup is to help seed Volta in this fashion, so the launch of the Titan V is part of a much larger and longer-term plan by NVIDIA.


출처 - https://www.anandtech.com/

반응형
Posted by 랩터 인터내셔널


아이폰X의 폰아레나(www.phonearena.com) 리뷰 입니다.


아이폰X 스펙


아이폰X 제스처 테스트


아이폰X 동영상 테스트


아이폰X, 아이폰8 CPU / GPU 성능


출처 - https://www.phonearena.com/reviews/Apple-iPhone-X-Review_id4441/page/3


아이폰X와 아이폰8에 탑재된 애플 A11 바이오닉 프로세서의 성능은 독보적입니다.

반응형
Posted by 랩터 인터내셔널

화제의 인텔 커피레이크 시리즈 벤치마크 입니다.


하단 게시물은 8700K 위주이기 때문에 i5 8600K, i5 8400, i3 8350K, i3 8100 성능이 포함된 자료를 링크해 드립니다.


벤치마크 출처 - https://www.computerbase.de


커피레이크와 AMD 라이젠 외형 입니다. 커피레이크 CPU의 물리적인 크기가 작습니다.


Kerne/
Threads
Takt
(Basis)
Turbo
1 / 2 / 4 / 6 Kerne
L3-CacheGrafikGrafik-TaktSpeicherTDPPreis
Core i7-8700K6/123,7 GHz4,7 / 4,6 / 4,4 / 4,3 GHz12 MBUHD 630 (24 EU)1.200 MHzDDR4-266695 W$359
Core i7-87006/123,2 GHz4,6 / 4,5 / 4,3 / 4,3 GHz12 MBUHD 630 (24 EU)1.200 MHzDDR4-266665 W$303
Core i5-8600K6/63,6 GHz4,3 / 4,2 / 4,2 / 4,1 GHz9 MBUHD 630 (24 EU)1.150 MHzDDR4-266695 W$257
Core i5-84006/62,8 GHz4,0 / 3,9 / 3,9 / 3,8 GHz9 MBUHD 630 (23 EU)1.050 MHzDDR4-266665 W$182
Core i3-8350K4/44,0 GHz6 MBUHD 630 (23 EU)1.150 MHzDDR4-240095 W$168
Core i3-81004/43,6 GHz6 MBUHD 630 (23 EU)1.100 MHzDDR4-240065 W$117


커피레이크 시리즈의 스펙과 가격입니다.


출처 - https://www.computerbase.de

반응형
Posted by 랩터 인터내셔널


인텔이 마침내 프로세서 시장의 새로운 시대를 알리는 커피레이크 시리즈를 발표했다. 커피레이크는 물리 6코어를 i5 라인으로 투입함으로써 긴 시간동안 i5의 메인스트림이였던 4코어를 넘어선 본격적인 6코어 시대로 진입하는 중요한 이정표가 되는 프로세서


Intel Core
i7-8700K
Intel Core
i7-8700
Intel Core i5-8600K
Intel Core i5-8400
Intel Core i3-8350K
Intel Core i3-8100
Socket
LGA 1151
LGA 1151
LGA 1151LGA 1151LGA 1151LGA 1151
Cores/Threads
6 / 12
6 / 12
6 / 6
6 / 6
 4 / 4
4 / 4
Base Frequency
3.7 GHz
3.2 GHz
3.6 GHz
2.8 GHz
4.0 GHz
3.6 GHz
Boost Frequency
4.7 GHz
4.6 GHz
4.3 GHz
4.0 GHz
N/A
N/A
Memory Speed
DDR4-2666
DDR4-2666
DDR4-2666DDR4-2666DDR4-2400
DDR4-2400
Memory Controller
Dual-Channel
Dual-Channel
Dual-ChannelDual-ChannelDual-Channel
Dual-Channel
Unlocked Multiplier
Yes
No
YesNoYes
No
PCIe Lanes
x16 Gen3
x16 Gen3
x16 Gen3x16 Gen3x16 Gen3
x16 Gen3
Integrated Graphics
Intel UHD Graphics 630 (up to 1200 MHz)
Intel UHD Graphics 630 (up to 1200 MHz)Intel UHD Graphics 630 (up to 1150 MHz)Intel UHD Graphics 630 (up to 1150 MHz)Intel UHD Graphics 630 (up to 1150 MHz)Intel UHD Graphics 630 (up to 1150 MHz)
Cache (L2+L3)
13.5MB13.5MB
10.5MB10.5MB9MB
7MB
Architecture
Coffee Lake
Coffee LakeCoffee LakeCoffee LakeCoffee Lake
Coffee Lake
Process
14nm++
14nm++14nm++14nm++14nm++14nm++
TDP
95W
65W
95W
65W
91W
65W
Price
(per 1K Unit)
$359
$303
$257
$182
$168
$117


커피레이크 시리즈 라인업 및 스펙표


i7 = 8700K / 8700 (6코어 12스레드 / 13.5MB L3 캐시)

i5 = 8600K / 8400 (6코어 6스레드 / 10.5MB L3 캐시)

i3 = 8350K / 8100 (4코어 4스레드 / 9MB - 7MB L3 캐시)


프로세서는 모두 14nm++ 공정, LGA 1151 인터페이스, 듀얼 채널 메모리 컨트롤러, 내장 그래픽 탑재


각각의 동작 클럭 (베이스 - 터보 클럭 / 지원 메모리)


i7 8700K = 3.7GHz / 4.7GHz (DDR4 2666)

i7 8700 = 3.2GHz / 4.6GHz (DDR4 2666)

i5 8600K = 3.6GHz / 4.3GHz (DDR4 2666)

i5 8400 = 2.8GHz / 4.0GHz (DDR4 2666)

i3 8350K = 4.0GHz / NA (DDR4 2400)

i3 8100 = 3.6GHz / NA (DDR4 2400)


각각의 표준 TDP


i7 8700K = 95와트

i7 8700 = 65와트

i5 8600K = 95와트

i5 8400 = 65와트

i3 8350K = 91와트

i3 8100 = 65와트


각 제품의 가격은 상위 8700K부터 $359 - $303 - $257 - $182 - $168 - $117

기존 카비레이크와 비슷한 수준의 가격 형성, 높은 경쟁력


새로운 인텔 Z370 칩셋 : 더 많은 코어 및 스마트 캐시, 향상된 오버클럭 능력 등


 벤치마크 테스트 시스템

Test System and Configuration
Hardware

Germany

Intel Socket 1151 (Z370):
Intel Core i7-8700K
MSI Z370 Gaming Pro Carbon AC
2x 8GB Corsair Vengeance DDR4-3200 @ 2666

Intel LGA 2066

Intel Core i7-7800X
MSI X299 Gaming Pro Carbon AC
4x 4GB G.Skill RipJaws IV DDR4-2600

AMD Socket AM4 Workstation
AMD Ryzen 7 1800X, Ryzen 5 1600X
MSI X370 Tomahawk
4x 8GB G.Skill TridentZ DDR4-3200 @ 2667 and 3200

Intel LGA 1151 (Z270)
Intel Core i7-7700K, Core i5-7600K
MSI Z270 Gaming 7
2x 8GB Corsair Vengeance DDR4-3200 @ 2400 and 3200

All Systems
GeForce GTX 1080 Founders Edition (Gaming)
Nvidia Quadro P6000 (Workstation)

1x 1TB Toshiba OCZ RD400 (M.2, System)
2x 960GB Toshiba OCZ TR150 (Storage, Images)
be quiet! Dark Power Pro 11, 850W Power Supply
Windows 10 Pro (Creators Update)

US

Intel Socket 1151 (Z370):
Intel Core i7-8700K
MSI Z370 Gaming Pro Carbon AC
4x 8GB G.Skill RipJaws V DDR4-3200 @ 2666 and 3200

Intel LGA 2066

Intel Core i7-7800X
MSI X299 Gaming Pro Carbon AC
4x 8GB G.Skill RipJaws V DDR4-3200 @ 2666 and 3200

AMD Socket AM4
AMD Ryzen 7 1800X, Ryzen 5 1600X
MSI X370 Xpower Gaming Titanium
2x 8GB G.Skill RipJaws V DDR4-3200 @ 2667 and 3200

Intel LGA 1151 (Z270)
Intel Core i7-7700K, Core i5-7600K
MSI Z270 Gaming M7
2x 8GB G.Skill RipJaws V DDR4-3200 @ 2666 and 3200

All
EVGA GeForce GTX 1080 FE
1TB Samsung PM863
SilverStone ST1500, 1500W
Windows 10 Creators Update Version 1703
Cooling
Germany
Alphacool Eiszeit 2000 Chiller
Alphacool Eisblock XPX
Thermal Grizzly Kryonaut (For Cooler Switch)
Monitor
Eizo EV3237-BK
PC Case
Lian Li PC-T70 with Extension Kit and Mods
Configurations: Open Benchtable, Closed Case
Power Consumption Measurement
Contact-free DC Measurement at PCIe Slot (Using a Riser Card)
Contact-free DC Measurement at External Auxiliary Power Supply Cable
Direct Voltage Measurement at Power Supply
2x Rohde & Schwarz HMO 3054, 500MHz Digital Multi-Channel Oscilloscope with Storage Function
4x Rohde & Schwarz HZO50 Current Probe (1mA - 30A, 100kHz, DC)
4x Rohde & Schwarz HZ355 (10:1 Probes, 500MHz)
1x Rohde & Schwarz HMC 8012 Digital Multimeter with Storage Function
Thermal Measurement
1x Optris PI640 80Hz Infrared Camera + PI Connect
Real-Time Infrared Monitoring and Recording
Acoustic Measurement
NTI Audio M2211 (with Calibration File, Low Cut at 50Hz)
Steinberg UR12 (with Phantom Power for Microphones)
Creative X7, Smaart v.7
Custom-Made Proprietary Measurement Chamber, 3.5 x 1.8 x 2.2m (L x D x H)
Perpendicular to Center of Noise Source(s), Measurement Distance of 50cm
Noise Level in dB(A) (Slow), Real-time Frequency Analyzer (RTA)
Graphical Frequency Spectrum of Noise


출처 - http://www.tomshardware.com


※ 인텔의 신형 커피레이크 8700K 요약

1. 기존의 게이밍 최강 CPU, 7700K를 넘어선 최강 게이밍 CPU 등극

2. 6코어 12스레드로 확장되며 AMD의 8코어 16스레드 라이젠 1800X를 넘어선 최강 작업 프로그램 성능

3. 전력 소모도 준수하며 현존 "마스터 CPU" 평가

4. AMD의 라이젠 시리즈는 경쟁력 상실에 따라 전 모델의 상당한 가격 인하 필요

반응형
Posted by 랩터 인터내셔널

Gordon Mah Ung | PCWorld


인텔이 다시 시장을 강타했다. 인텔은 몇 개월 동안 자사 영역을 잠식한 AMD 라이젠 쓰레드리퍼(Threadripper)에 대항할 강력한 18코어 코어 i9-7980X와 16코어 코어 i8-7960X를 출시했다.

불의의 일격을 당한 ‘골리앗’ 인텔이 ‘다윗’인 AMD에 제대로 설욕할 수 있을지, 클럭속도와 발열 문제에 대한 소문을 잠재울 수 있을지 지금부터 확인해 본다.

먼저 코어 i9은 기사거리가 아주 많다. 따라서 가격과 기능, 특징, FAQ는 배경 정보를 얻을 수 있는 별도의 기사로 편성했다. 이번 리뷰에서는 성능과 직결되어 있지만, 감춰진 정보들을 자세히 다룰 예정이다. 또 벤치마크 결과를 소개한다.


Intel


코어 i9 속 들여다 보기
인텔은 10년 만에 처음으로 ‘코어 i’ 브랜드의 새로운 제품을 공개했다. 인텔은 비밀을 지키려 애를 썼는데, 리뷰 샘플을 포함해 첫 공개된 칩들에 일부러 ‘코어 i7’이라는 잘못된 라벨을 부착했다. 비밀이 새어 나가지 않도록 하기 위한 것이었는데, 이번에 리뷰한 16코어 및 18코어 샘플에는 정확한 라벨이 부착되어 있었다.

인텔의 다른 제품 대다수와 마찬가지로, 코어 i9은 단순히 새로운 CPU가 아니라 새로운 플랫폼이다. 새로운 칩셋인 X299와 새로운 소켓인 LGA2066이 기존 CPU와 호환되지 않는다는 의미이다.

또 과거와 다른 특징 한 가지가 있다. 2개 CPU 제품군을 통합한 플랫폼(브랜드)이다. 얼마 전까지 가장 최신 제품이었던 카비레이크 코어의 경우, LGA1151 소켓을 사용하는 메인보드를 구입해야 했다. 다시 말해, 인텔 코어 i7-6800K 같은 6코어 스카이레이크 CPU와 함께 LGA2011 V3 기반 메인보드를 구입해야 했다.

X229와 LGA2066의 경우 마음대로 선택할 수 있다. 4코어 코어 i5 카비레이크 CPU부터 스카이레이크 CPU인 18코어 코어 i9 익스트림 에디션까지 모든 것을 지원하는 플랫폼이기 때문이다. 혼동이 없도록 덧붙이면, 카비레이크-X로도 불리는 카비레이크 CPU는 코어 i5-7640X와 코어 i7-7740X이다. 나머지 코어 i7 및 코어 i9 CPU는 스카이레이크-X로 불리는 스카이레이크 CPU들이다.


코어 X 시리즈 제품군
Intel
코어 X 시리즈 제품군


이런 조합이 약간의 혼동과 혼란을 초래하기는 했다. X299 메인보드는 고가 제품군이 될 전망이다. 일부는 250달러 CPU를 설치하기 위해 350달러 메인보드를 사야 하는 것을 이해하지 못할 수도 있다.

카비레이크-X는 오버클로킹에 목적이 있다. LGA1151 소켓을 사용하는 카비레이크 칩과 달리, 카비레이크-X 칩에는 그래픽이 통합되어 있지 않다. 통합 그래픽 프로세서가 아예 없는 것으로 알려져 있다. 이런 이유로 2종의 카비레이크-X 칩은 LGA1151 버전보다 훨씬 높게 오버클러킹을 할 수 있다. 인텔은 최근 타이페이에서 열린 컴퓨덱스 전시회에서, X299 기반의 카비레이크 칩이 오버클로킹에서 ‘신기원’을 기록했다고 발표했다.

모든 사람이 18코어 CPU를 구입할 수 있다면 이상적일 것이다. 그러나 좋은 메인보드에 저렴한 CPU를 구입하는 사람들도 있다. 카비레이크-X는 이런 사람들에게 좋다.

여전히 제한적인 PCIe 레인
동일한 소켓에서 카비레이크-X와 스카이레이크-X를 지원하는 방식이 혼동을 초래할 수밖에 없다. 첫 번째 증거는 PCIe 지원 및 제한에 관한 것이다. 코어 i9-7900X는 CPU가 3세대 PCI3 레인 44개와 쿼드 채널 메모리를 지원한다. 동일한 빌드에 코어 i7-7740K를 장착할 경우, 마더보드가 듀얼 채널 메모리만 지원한다. PCIe 레인 수는 16으로 감소한다. 카비레이크 코어의 지원 한계 때문이다. 이 경우, 마더보드의 일부 슬롯을 사용할 수 없게 되거나, 성능이 저하된다.

카비레이크가 16 레인만 지원하는 이유는 CPU 설계 때문이다. 그런데 인텔은 스카이레이크-X에서도 지원하는 PCIe 레인 수를 축소했다. 10코어 버전은 44개 레인을 지원하지만, 스카이레이크-X 6코어 및 8코어는 28개 레인만 지원한다. 우리가 파악하기로 기술적인 이유는 아니다. ‘더 비싼 가격을 책정하기 위한’ 시장 세분화에 목적이 있다. .

인텔 VROC
PCIe ‘제한’보다 더 논란이 많은 것은 인텔의 VROC(Virtual RAID on CPU)이다. 사용자가 RAID에서 최대 20개의 NVMe PCIe 드라이브를 하나의 부팅 가능한 파티션으로 설정할 수 있는 스카이레이크-X의 유용한 기능이다.


X299 VROC 기능을 사용해 최대 20대의 NVMe 드라이브로 RAID를 구성하려면 전용 동글 키를 구입해야 할 수도 있다.
IDG/Gordon Mah Ung
X299 VROC 기능을 사용해 최대 20대의 NVMe 드라이브로 RAID를 구성하려면 전용 동글 키를 구입해야 할 수도 있다.


그런데 문제가 있다. 인텔은 이 기능에 가격을 책정할 계획을 갖고 있다. 아직 세부 사항은 공개되지 않았다. 그러나 컴퓨텍스에 참가한 한 업체에 따르면, RAID 0은 무료, RAID 1은 99달러, RAID 5와 RAID 10은 299달러가 될 전망이다. 돈을 지불하면, 잠긴 기능을 풀 수 있는 하드웨어 동글을 받게 된다.

더한 문제도 있다. VROC는 인텔 SSD와 값 비싼 스카이레이크-X에서만 지원된다. 카비레이크-X에서는 사용할 수 없는 기능이다. 또 CPU PCIe 레인을 통해 직접 실행되는 PCIe RAID에서만 작동한다. X299는 칩셋을 통해 다양한 RAID 0, 1, 5, 10을 지원할 예정이지만, 칩셋 RAID로는 VROC에서 얻을 수 있는 성능을 얻을 수 없다.

일단 인텔이 최종 가격을 발표하기까지 최종적인 판단을 보류한다. 컴퓨텍스에서의 논란을 감안했을 때, 앞으로의 ‘진행 상황’을 지켜볼 필요가 있다.


스카이레이크-X의 AVX 512는 코드가 지원한다면 성능을 대폭 향상시켜 준다.
Intel
스카이레이크-X의 AVX 512는 코드가 지원한다면 성능을 대폭 향상시켜 준다.


코어 i9가 스카이레이크에 가져올 변화
플랫폼이 초래하는 혼동을 극복하면 보상을 찾을 수 있다. 스카이레이크-X 칩 자체는 아주 좋다. 기존의 고가 인텔 소비자용 칩과는 다르게 만들어졌기 때문이다.

과거 ‘전문가(Enthusiast 또는 Extreme)’ CPU는 동일한 부분이 많았다. 예를 들어 4코어 하스웰 코어 i7-4770K와 8코어 하스웰-E 코어 i7-5960X의 차이점은 후자가 쿼드 채널 RAM을 지원하는 것뿐이다.

인텔은 스카이레이크-X에서 이런 전통을 무너뜨렸다. 가장 눈에 띄는 변화는 MLC(Mid-Level Cache), L2 캐시의 성능 향상이다. 지난 해 브로드웰-E와 인텔 CPU의 대부분은 코어 당 256KB를 지원했지만, 이를 4배로 증가시켜 코어 당 1MB를 지원한다. L3 캐시는 작아졌다. 기존 브로드웰-E 칩에서 2.5MB이었지만, 코어 당 1.375MB가 되었다. 대신 MLC를 키웠고, 비인클루시브(Non-inclusive) 캐시 디자인을 사용했다. 불필요한 데이터를 유지했던 브로드웰-E의 인클루시브 캐시 설계와 비교하면, 비인클루시브 캐시는 캐시에 포함되어야 하는 것을 추적하는 방식으로 가용 공간을 더 효율적으로 사용할 수 있다.


스카이레이크와 스카이레이크-X는 완전히 다른데, 갖아 큰 차이는 캐시와 AVX512, 새로운 메시 인터페이스이다.
Intel
스카이레이크와 스카이레이크-X는 완전히 다른데, 갖아 큰 차이는 캐시와 AVX512, 새로운 메시 인터페이스이다.


또 카비레이크와 스카이레이크를 포함해 몇 년 동안 사용했던 링 버스(Ring Bus) 아키텍처 대신 새로운 메시 아키텍처를 도입했다. 쿼드코어 CPU를 4개 정류장을 연결하는 버스 노선에 비유하면, 정류장이 12개 또는 18개로 추가되는 셈이다. 2개 버스 노선을 연결할 수 있다. 그러나 이 경우, 1개 노선만큼 빠르지 않다. 이것이 새로운 메시 아키텍처이다.

인텔은 이런 메시 디자인을 채택해 쓰레드리퍼(Threadripper)와 경쟁할 준비를 끝냈다. CPU에 코어를 추가할 수 있는 방식이기 때문이다. AMD 라이젠 시리즈는 초고속 메시 네트워크인 인피니티 패브릭(Infinity Fabric)이라는 기술을 사용하고 있다.


// 최근 CPU에서 사용한 링 버스 아키텍처를 버리고 코어를 더 늘릴 수 있는 메시 아키텍처를 채택했다.
Intel
// 최근 CPU에서 사용한 링 버스 아키텍처를 버리고 코어를 더 늘릴 수 있는 메시 아키텍처를 채택했다.


마지막으로 언급할 기능은 크게 강화된 터보 부스트 맥스(Turbo Boost Max) 3.0이다. 인텔은 출고 때 ‘최고 성능’의 CPU 코어를 지정하고, 이 코어의 성능을 향상시킨다. 이것이 터부 부스트 맥스 기능이다. 브로드웰-E CPU의 경우, 하나의 코어만 선택했었다. 스카이레이크-X의 경우 ‘최고 성능’ 코어가 2개이다. 몇 백 메가헤르쯔 더 빠른 성능을 발휘한다.


IDG/Gordon Mah Ung


18코어 코어 i9의 성능
PCWorld는 에이수스 프라임(Asus Prime) X-299 딜럭스 소켓에서 10코어인 코어 i9-7900X를 뺀 후, 18코어인 코어 i9-7980X를 설치해 성능을 테스트했다. 기타 부품은 최초 코어 i9-7900X 리뷰 때와 동일하다. 지포스 GTX 1080 파운더스 에디션, 32GB DDR4/2600 RAM, 하이퍼X 240GB 새비지 SATA SSD이다. 어도비 프리미어(Adobe Premiere) CC 2017 테스트에서 소스 프로젝트와 타겟 드라이브로 플렉스터(Plextor) M8pe PCIe SSD를 사용했다. 코어 i5와 라이젠 5 CPU를 제외하면 동일하다. 라이젠 5 메인보드가 플렉스터 드라이브를 인식하지 못하는 문제가 있었기 때문이다. 삼성 960 Pro NVMe SSD를 끼워 넣었다. AMD 라이젠 쓰레드리퍼 1950X는 첫 리뷰 때와 동일했다.


시간적인 제약 때문에 일부 테스트의 점수는 16코어 버전인 코어 i9-7960X의 점수이다. 한 쌍의 팔콘 노스웨스트 탈론(Falcon Northwest Talon) 시스템에서 CPU를 테스트했다. 쓰레드리퍼와 코어 i9 비교에 사용한 구성이다. GPU가 다르지만, CPU는 ‘스톡’ CPU이다. 그러니 CPU만 대상으로 하는 비교 테스트로 유효하다.


IDG


전력 소비와 클럭 속도
코어 i9-7900X의 결론 중 하나는 전력 소비량, ‘AMD보다 얼마나 더 많은 전력을 소비하는지’이다. 통상 쉽지 않은 테스트이다. 하드웨어가 동일해야 한다. 그러나 앞서 언급했듯, 부티크 PC 빌더인 팔콘 노스웨스트가 거의 동일한, 아주 강력한 탈론 PC를 제공했다. 두 PC 모두 128GB의 DDR4/2400 RAM, 삼성 960 프로 드라이브, SLI 기반 타이탄 Xp, 동일한 파워 서플라이, 쿨러, 케이스로 구성되어 있다. 차이점은 16코어 CPU와 메인보드다.

이를 통해 동일한 CPU 로드를 실행시키고, 소켓의 전력 소비량을 측정할 수 있었다. 대부분의 워크로드는 코어 전부를 사용하지 않는다. 따라서 1~32쓰레드까지 높이면서 전력 소비량을 조사했다. 그 결과는 모든 사람이 알고 있는 것과 동일하다. 코어 i9이 더 많은 전력을 소비한다.

전력 소비량 측정치는 정확하지 않다. 그러나 차이를 알 수 있을 만큼 근사치를 제공한다. 흥미로운 부분은 쓰레드리퍼 1950X의 경우 20쓰레드에서 전력 소비량이 동일해 졌지만, 코어 i9은 계속 증가했다는 점이다.


거의 동일한 16코어 시스템 두 대를 사용할 때, AMD의 쓰레드리퍼 1950X가 인텔 16코어 코어i9-7960X보다 전력 효율이 높다는 것을 증명했다.
IDG
거의 동일한 16코어 시스템 두 대를 사용할 때, AMD의 쓰레드리퍼 1950X가 인텔 16코어 코어i9-7960X보다 전력 효율이 높다는 것을 증명했다.


전력 소비량 측면에서 승자는 쓰레드리퍼이다. 그러나 이것이 큰 경쟁력이 되지는 못한다. 멀티 쓰레드 성능을 중시하는 사람에게 전력 소비량은 중요한 요소가 아니기 때문이다.

쓰레드리퍼의 게임 성능과 관련해서도 마찬가지 원칙이 적용된다. 승자는 코어 i9이다. 그러나 콘텐츠 생산이 중요한 사람들이 이런 CPU를 구입한다는 점을 감안하면 역시 중요한 부분이 아닐 수도 있다.

18코어 코어 i9-7980X에서 다양한 워크로드를 테스트했다. 쓰레드리퍼 리뷰에서도 했던 일이다. 이 칩의 성능을 이해하는 데 중요하다고 생각한다. 10코어 코어 i9-7900X와 16코어 쓰레드리퍼 1950X를 비교했을 때, 가벼운 로드는 코어 i9이, 무거운 로드는 AMD CPU가 우수했다.

새 코어 i9은 달랐다. 인텔이 가벼운 로드와 무거운 로드 모두 더 우수한 성능을 발휘했다. 아래 시네벤치 R15 테스트 결과를 보면 알겠지만, 18코어 칩은 모든 부분에서 AMD 칩에 앞섰다.

시네벤치 R15를 사용해 다양한 워크로드를 1~36쓰레드에서 실행해 성능 최고점을 확인했다.

가격
코어 i9과 코어 X 시리즈의 ‘물음표’는 ‘가치 제안’이다. 코어 i9-7900X와 쓰레드리퍼 1950X 리뷰 때부터 동일하지만, 인텔이 ‘성능’ 측면의 리더라는 점에 동의한다.

문제는 가격이다. 성능을 기준으로 한 가치는 하락한다. 성능은 상대적이기 때문이다. 쓰레드리퍼는 코어 i9보다 아주 조금 성능이 뒤진다. 그래서 코어 X와 쓰레드리퍼의 쓰레드 당 가격을 자세히 분석하기로 결정했다. 1,723달러인 10코어 코어 i7-6950X도 비교 대상에 포함시켰다.

쓰레드당 성능을 비교했을 때, 가치가 가장 떨어지는 제품은 브로드웰-E 칩이다. 두 번째로 가치가 떨어지는 제품은 쓰레드 당 61달러인 코어 i5-7640X이다. 가장 가치가 높은 제품은 무엇일까? AMD의 32쓰레드 쓰레드리퍼 1950X이다.

쓰레드당 가격을 따지면 라이젠 쓰레드리퍼 16코어 32쓰레드 제품이 가장 가성비가 높다.

결론
코어 i9은 두 가지 관점에서 판단해야 한다. 첫째, 성능이다. 인텔이 성능을 주도한다는 점에 이견이 있을 수 없다. 그러나 멀티쓰레드 벤치마크 결과를 아주 자세히 살펴봐야 한다. 16코어와 18코어 코어 i9이 AMD 쓰레드리퍼에 뒤진다. 클록 속도와 IPC 효율성이 더 우수한 인텔에 유리한 가벼운 로드로 이동할 수록 상황이 악화된다.

성능을 절대적으로 중시해 가벼운 로드와 무거운 로드 모두에서 가장 빠른 성능을 발휘하는 CPU를 찾는다면 코어 i9-7960X와 코어 i9-7980X가 새로운 승자이다. 문제는 가격 차이이다. 마지막 차트는 AMD의 가치 제안에 대해 알려줄 것이다. 모든 부분에서 코어 i9이 더 빠르다. 그러나 가격은 다르다.

물론 ‘돈을 내는 사람’에 달려있을 수 있다. 예를 들어, 상사가 비디오 편집용 워크스테이션에 적합한 제품을 묻는다면 인텔이라고 대답할 것이다. 그러나 직접 PC를 조립하는 경우라면 이야기가 달라진다. AMD라고 대답할 것이다. 오해는 말기 바란다. 현재 성능 측면에서 ‘리더’는 코어 i9이다.  editor@itworld.co.kr

원문보기: http://www.itworld.co.kr/news/106644?page=0,2#csidxb2dbb779a1443d9a08acd3b591fddfe


반응형
Posted by 랩터 인터내셔널

국내 커뮤니티 사이트의 회원이 실제 게임 영상과 캡처 화면으로 테스트한 세부적인 자료가 있어 소개합니다.


출처 - http://www.coolenjoy.net/bbs/27/1609823?page=4


-----------------------------------------------------------------------------------------------------------------------------------


안녕하세요.


그저께부터 양일간 7700K와 1800X에서 1080TI, QHD 사양에서의 프레임 비교를 해보았습니다.

http://www.coolenjoy.net/bbs/27/1607796

http://www.coolenjoy.net/bbs/27/1609019


어제 지온스님께서 FHD 영상을 다행에 올려주시겠기에 그에 맞춰 테스트하여 결과를 공유합니다.

각 영상 앞부분에 설정값이 있으니 참고 부탁드립니다.

아래와 같이 결과를 공유합니다.


울트라옵


영상링크

7700K :  https://youtu.be/qs6aFwkS9rI

1800X : https://youtu.be/rofhT-h6eB8


시작섬

7700K : 90

1800X : 60


비행기

7700K : 77

1800X : 71


활강 

7700K : 135

1800X : 105


낙하산

7700K : 122

1800X : 89


실내파밍

7700K : 104

1800X : 105


필드

7700K : 112

1800K : 100


커스텀옵


그림자, 효과, 식생 낮음
나머지 울트라


영상링크 

7700K : https://youtu.be/ESNn4O4XvWs

1800X : https://youtu.be/guIrLgVZeCk 


시작섬

7700K : 100

1800X : 85


비행기

* 불 부분으로 

7700K : 66

1800X : 58


활강 

7700K : 134

1800X : 100


낙하산

7700K : 88

1800X : 75


실내파밍

7700K : 140

1800X : 140


필드

7700K : 150

1800K : 100


지온스님의 경우 프레임이 144hz 제한이 설정되어 있는 상태이고, 저는 무제한으로 풀어논 상태

지온스님의 1080TI의 평균클럭이 1970정도, 저는 1850 정도차이나는걸 염두해두시고 비교부탁드립니다.


결론은 FHD에서는 7700K가 우세, QHD에서는 비슷입니다.

필드부분을 보시면 아시겠지만 GPU를 얼마나 사용하냐 못하냐에 따라서 프레임차이가 극명합니다.


이부분은 좀더 최적화를 통해 2개의 CPU가 비슷한 성능을 낼수 있지 않을까 추후 예상됩니다 :)


PS : 그래서 저는 1700으로 갑니다~~!!


출처 - http://www.coolenjoy.net/bbs/27/1609823?sfl=wr_subject&stx=1800&sop=and

반응형
Posted by 랩터 인터내셔널
AMD Radeon RX Series Specification Comparison
 AMD Radeon RX Vega 64 LiquidAMD Radeon RX Vega 64AMD Radeon RX Vega 56AMD Radeon R9 Fury X
Stream Processors4096
(64 CUs)
4096
(64 CUs)
3584
(56 CUs)
4096
(64 CUs)
Texture Units256256224256
ROPs64646464
Base Clock1406MHz1247MHz1156MHzN/A
Boost Clock1677MHz1546MHz1471MHz1050MHz
Memory Clock1.89Gbps HBM21.89Gbps HBM21.6Gbps HBM21Gbps HBM
Memory Bus Width2048-bit2048-bit2048-bit4096-bit
VRAM8GB8GB8GB4GB
Transistor Count12.5B12.5B12.5B8.9B
Board Power345W295W210W275W
(Typical)
Manufacturing ProcessGloFo 14nmGloFo 14nmGloFo 14nmTSMC 28nm
ArchitectureVega
(GCN 5)
Vega
(GCN 5)
Vega
(GCN 5)
GCN 3
GPUVega 10Vega 10Vega 10Fiji
Launch Date08/14/201708/14/201708/28/201706/24/2015
Launch Price$699*$499/599*$399/499*$649


라데온 베가는 크게 64모델과 56모델로 구분, 64모델은 수냉 버전과 공냉 버전으로 나뉘며 수냉 버전의 동작 클럭은 1406MHz(베이스) - 1677MHz(부스트)로 공냉 버전  1247MHz(베이스) - 1546MHz(부스트)보다 높으며 그 외 스펙은 4096 스트림 프로세서(공통), 256 텍스처(공통), 2048비트 8GB 용량의 1.89Gbps HBM2 메모리, 12.5B 트랜지스터, TDP 345와트(공랭 모델은 295와트). 


라데온 베가 56모델은 3584 스트림 프로세서, 224 텍스처, 1156MHz(베이스) - 1471MHz(부스트) 클럭, 2048비트 8GB 용량의 1.6Gbps HBM2 메모리, TDP는 210와트.


라데온 베가 시리즈의 가격은 베가 64 수냉 버전이 $699, 공냉 버전이 $499/599, 베가 56 공랭 버전이 $399/499.


그 외 내용은 바로 아래 게시글 내용 확인


Summer 2017 GPU Pricing Comparison (Crypto-Crazy Edition)
AMDPriceNVIDIA
Radeon RX Vega 64$499GeForce GTX 1080
 $449GeForce GTX 1070
Radeon RX Vega 56$399 
Radeon RX 580 (8GB)$299GeForce GTX 1060 (6GB)


AMD는 엔비디아의 지포스GTX 1080TI 및 타이탄과 같은 플래그십에 대응할 수 있는 모델이 없는 상황


[ 테스트 시스템 ]


CPU:Intel Core i9-7820X @ 4.3GHz
Motherboard:Gigabyte X299 AORUS Gaming 7
Power Supply:Corsair AX860i
Hard Disk: OCZ Toshiba RD400 (1TB)
Memory:G.Skill TridentZ DDR4-3200 4 x 8GB (16-18-18-38)
Case:NZXT Phantom 630 Windowed Edition
Monitor:LG 27UD68P-B
Video Cards:AMD Radeon RX Vega 64 (Air Cooled)
AMD Radeon RX Vega 56
AMD Radeon RX 580
AMD Radeon R9 Fury X
NVIDIA GeForce GTX 1080 Ti Founders Edition
NVIDIA GeForce GTX 1080 Founders Edition
NVIDIA GeForce GTX 1070 Founders Edition
Video Drivers:NVIDIA Release 384.65
AMD Radeon Software Crimson Press Beta 17.30.1051
OS:Windows 10 Pro (Creators Update)


Battlefield 1

Battlefield 1 - 3840x2160 - Ultra QualityBattlefield 1 - 2560x1440 - Ultra QualityBattlefield 1 - 1920x1080 - Ultra Quality


Battlefield 1 - 99th Percentile - 3840x2160 - Ultra QualityBattlefield 1 - 99th Percentile - 2560x1440 - Ultra QualityBattlefield 1 - 99th Percentile - 1920x1080 - Ultra Quality

Battlefield 1's DX11 render path was used for all cards.


Ashes of the Singularity: Escalation

Ashes of the Singularity: Escalation - 3840x2160 - Extreme QualityAshes of the Singularity: Escalation - 2560x1440 - Extreme QualityAshes of the Singularity: Escalation - 1920x1080 - Extreme Quality


Ashes: Escalation - 99th Percentile - 3840x2160 - Extreme QualityAshes: Escalation - 99th Percentile - 2560x1440 - Extreme QualityAshes: Escalation - 99th Percentile - 1920x1080 - Extreme Quality


Doom

Doom - 3840x2160 - Ultra QualityDoom - 2560x1440 - Ultra QualityDoom - 1920x1080 - Ultra Quality


Doom - 99th Percentile - 3840x2160 - Ultra QualityDoom - 99th Percentile - 2560x1440 - Ultra QualityDoom - 99th Percentile - 1920x1080 - Ultra Quality


Ghost Recon Wildlands

Ghost Recon Wildlands - 3840x2160 - Very High QualityGhost Recon Wildlands - 2560x1440 - Very High QualityGhost Recon Wildlands - 1920x1080 - Very High Quality


Dawn of War III

A note on the 1080p results: further testing revealed that Dawn of War III at 1080p was rather CPU-bound on our testbed, resulting in anomalous performance. Due to the extreme time constraints, we discovered and determined this very late in the process. For the sake of transparency, the graphs will remain as they were at the time of the original posting.

Dawn of War III - 3840x2160 - Ultra QualityDawn of War III - 2560x1440 - Ultra QualityDawn of War III - 1920x1080 - Ultra Quality


Dawn of War III - 99th Percentile - 3840x2160 - Ultra QualityDawn of War III - 99th Percentile - 2560x1440 - Ultra QualityDawn of War III - 99th Percentile - 1920x1080 - Ultra Quality


Deus Ex: Mankind Divided

Deus Ex: Mankind Divided - 3840x2160 - Ultra QualityDeus Ex: Mankind Divided - 2560x1440 - Ultra QualityDeus Ex: Mankind Divided - 1920x1080 - Ultra Quality


Grand Theft Auto V

Grand Theft Auto V - 3840x2160 - Very High QualityGrand Theft Auto V - 2560x1440 - Very High QualityGrand Theft Auto V - 1920x1080 - Very High Quality


Grand Theft Auto V - 99th Percentile - 3840x2160 - Very High QualityGrand Theft Auto V - 99th Percentile - 2560x1440 - Very High QualityGrand Theft Auto V - 99th Percentile - 1920x1080 - Very High Quality


F1 2016

F1 2016 - 3840x2160 - Ultra QualityF1 2016 - 2560x1440 - Ultra QualityF1 2016 - 1920x1080 - Ultra Quality


Total War: Warhammer

Total War: Warhammer - 3840x2160 - Ultra QualityTotal War: Warhammer - 2560x1440 - Ultra QualityTotal War: Warhammer - 1920x1080- Ultra Quality

Total War: Warhammer - 99th Percentile - 3840x2160 - Ultra QualityTotal War: Warhammer - 99th Percentile - 2560x1440 - Ultra QualityTotal War: Warhammer - 99th Percentile - 1920x1080 - Ultra Quality

To note: the DX12 render path was used for AMD cards. Generally, we'd like to use the best performing API for a given card. In this case, while there was improved performance at higher resolutions, we noticed a potential regression in 1080p performance. Unfortunately, due to time constraints, we weren't able to investigate further.


Idle Power ConsumptionLoad Power Consumption - Battlefield 1Load Power Consumption - FurMark


출처 - http://www.anandtech.com


라데온 베가 64 성능 = 지포스GTX 1080

라데온 베가 56 성능 = 지포스GTX 1070보다 약간 우위


전력소모

라데온 베가 64 = 지포스GTX 1080보다 149와트 더 많은 소모

라데온 베가 56 = 지포스GTX 1070보다 78와트 더 많은 소모


결론 : 라데온 신형 베가 아키텍처는 HBM2까지 적용했으나 성능은 엔비디아의 지포스 1080 수준에 머무르며 전력소모당 성능은 최악

반응형
Posted by 랩터 인터내셔널

AMD가 새로 발표한 플래그십 GPU, 라데온 베가RX 64의 탐스 하드웨어 리뷰입니다.


베가 외형


라데온 베가는 AMD의 새로운 아키텍처로 설계된 GPU 입니다.

베가 아키텍처 상세 내용 - http://raptor-hw.net/xe/hot/139938


베가는 HBM2 메모리가 적용되어 GPU 옆에 HBM 이 확인되고 있습니다.


라데온 베가의 PCB 레이아웃 입니다.


라데온 베가64 스펙


테스트 시스템

Test System and Configuration
Hardware

Germany
Intel Core i7-6900K @ 4.3 GHz
MSI X99S XPower Gaming Titanium
Corsair Vengeance DDR3-3200
1x 1TB Toshiba OCZ RD400 (M.2, System)
2x 960GB Toshiba OCZ TR150 (Storage, Images)
be quiet! Dark Power Pro 11, 850W Power Supply
Windows 10 Pro (Creators Update)

U.S.
Intel Core i7-7700K
MSI Z270 Gaming Pro Carbon
G.Skill F4-3200C14Q-32GTZ
1x 500GB Crucial MX200
be quiet! Dark Power Pro 11, 850W Power Supply
Windows 10 Pro (Creators Update)
Cooling
Germany
Alphacool Eiszeit 2000 Chiller
Alphacool Eisblock XPX
Thermal Grizzly Kryonaut (For Cooler Switch)
Monitor
Eizo EV3237-BK
PC Case
Lian Li PC-T70 with Extension Kit and Mods
Configurations: Open Benchtable, Closed Case
Power Consumption Measurement
Contact-free DC Measurement at PCIe Slot (Using a Riser Card)
Contact-free DC Measurement at External Auxiliary Power Supply Cable
Direct Voltage Measurement at Power Supply
2x Rohde & Schwarz HMO 3054, 500MHz Digital Multi-Channel Oscilloscope with Storage Function
4x Rohde & Schwarz HZO50 Current Probe (1mA - 30A, 100kHz, DC)
4x Rohde & Schwarz HZ355 (10:1 Probes, 500MHz)
1x Rohde & Schwarz HMC 8012 Digital Multimeter with Storage Function
Thermal Measurement
1x Optris PI640 80Hz Infrared Camera + PI Connect
Real-Time Infrared Monitoring and Recording
Acoustic Measurement
NTI Audio M2211 (with Calibration File, Low Cut at 50Hz)
Steinberg UR12 (with Phantom Power for Microphones)
Creative X7, Smaart v.7
Custom-Made Proprietary Measurement Chamber, 3.5 x 1.8 x 2.2m (L x D x H)
Perpendicular to Center of Noise Source(s), Measurement Distance of 50cm
Noise Level in dB(A) (Slow), Real-time Frequency Analyzer (RTA)
Graphical Frequency Spectrum of Noise


image002

image002

image002

image001


image002

image002

image002

image002

image002

image002

image002

image002

image002

image002

image002

image002

image002

image002

image002image002


채굴 성능


aHR0cDovL21lZGlhLmJlc3RvZm1pY3JvLmNvbS9W


전력소모


aHR0cDovL21lZGlhLmJlc3RvZm1pY3JvLmNvbS9W


출처 - http://www.tomshardware.com


AMD의 새로운 플래그십 라데온 베가 64의 성능은 엔비디아의 지포스GTX 1080과 엎치락 뒤치락하는 비슷한 성능을 나타냅니다. 전력소모는 아이들시 18.6와트, 풀로드시 280~293와트 정도를 소모합니다. 추가로 진행한 이더리움 채굴 성능은 지포스 1080TI 보다 낮은 30.9MH/s 성능입니다.

반응형
Posted by 랩터 인터내셔널

aHR0cDovL21lZGlhLmJlc3RvZm1pY3JvLmNvbS9XLzQvNjk4NDA0L29yaWdpbmFsLzAxMy5qcGc=.jpg


Threadripper 1950X
Core i9-7900X
Threadripper 1920X
Core i7-7820X
Threadripper 1900X
Price
$999
$999
$799
$599
$549
Interface/Chipset
TR4 / X399
LGA2066 / X299
TR4 / X399
LGA2066 / X299
TR4 / X399
Cores/Threads
16/32
10/20
12/24
8/16
8/16
TDP
180W
140W
180W
140W
180W
Base Frequency (GHz)
3.4
3.3
3.5
3.6
3.8
Boost Frequency (GHz)
4.0 (4.2 XFR)
4.3 / 4.5 (TB 3.0)
4.0 (4.2 XFR)
4.3 / 4.5 (TB 3.0)
4.0 (4.2 XFR)
L3 Cache (L2+L3)
40 MB
23.75 MB
38 MB
19MB
20 MB
Memory Support
DDR4-2667
DDR4-2666
DDR4-2667DDR4-2666DDR4-2667
Memory Controller
Quad-Channel
Quad-Channel
Quad-ChannelQuad-ChannelQuad-Channel
Unlocked Multiplier
YesYes
YesYes
Yes
PCIe Lanes
64
44
64
28
64


AMD의 16코어 32스레드 라이젠 스레드리퍼의 탐스 하드웨어 리뷰입니다.

라이젠 스레드리퍼 1950X는 16코어 32스레드, 180와트의 TDP, 3.4 베이스 클럭, 4.0 부스트 클럭, XFR 4.2, 40MB L3 캐시(L2+L3), 쿼드 채널 메모리 컨트롤러를 지원합니다. PCIE 레인수는 64레인 입니다.


aHR0cDovL21lZGlhLmJlc3RvZm1pY3JvLmNvbS9XLzAvNjk4NDAwL29yaWdpbmFsLzAwOGIuanBn.jpg

스레드리퍼 1950X는 인텔 CPU보다 물리적으로 2배 큰 거대한 크기입니다.


aHR0cDovL21lZGlhLmJlc3RvZm1pY3JvLmNvbS9XLzYvNjk4NDA2L29yaWdpbmFsLzAxNC5qcGc=.jpg


MCM(멀티 칩 모듈) 형태가 확인됩니다.


aHR0cDovL21lZGlhLmJlc3RvZm1pY3JvLmNvbS9aL1UvNjk4NTM4L29yaWdpbmFsLzIyLmpwZw==.jpg

X399 메인보드에 장착된 모습입니다.


aHR0cDovL21lZGlhLmJlc3RvZm1pY3JvLmNvbS85L00vNzAwMTg2L29yaWdpbmFsLzA2LlBORw==.png


X399 플랫폼의 블럭 다이어그램 입니다. 쿼드채널 메모리, 3웨이 NVMe , 쿼드 크로스파이어 등이 특징입니다.


[ 테스트 시스템 환경 ]

Test System and Configuration
Hardware

Germany

AMD Socket
SP3 (TR4)
AMD Ryzen Threadripper 1950X
Asus X399 ROG Zenith Extreme
4x 8GB G.Skill RipJaws V DDR4-3200

Intel LGA 2066

Intel Core i9-7900X
MSI X299 Gaming Pro Carbon AC
4x 4GB G.Skill RipJaws IV DDR4-2600

AMD Socket AM4 Workstation
AMD Ryzen 7 1800X, 1700X, 1600X, 1500X
MSI X370 Tomahawk
4x 8GB G.Skill TridentZ DDR4-3200

Intel LGA 2011v3
Intel Core i7-6900K
MSI X99S XPower Gaming Titanium
4x 4GB Crucial Ballistix DDR4-2400

Intel LGA 1151
Intel Core i7-7700K
MSI Z270 Gaming 7
2x 8GB Corsair Vengeance DDR4-3200 @ 2400 MT/s

All Systems
GeForce GTX 1080 Founders Edition
Nvidia Quadro P6000 (Workstation)

1x 1TB Toshiba OCZ RD400 (M.2, System)
2x 960GB Toshiba OCZ TR150 (Storage, Images)
be quiet! Dark Power Pro 11, 850W Power Supply
Windows 10 Pro (Creators Update)

US

AMD Socket SP3 (TR4)
AMD Ryzen Threadripper 1950X
Asus X399 ROG Zenith Extreme
4x 8GB G.Skill RipJaws V DDR4-3200 @ 2666 and 3200 MT/s


Intel LGA 2066

Intel Core i9-7900X, i7-7820X
MSI X299 Gaming Pro Carbon AC
4x 8GB G.Skill RipJaws V DDR4-3200 @ 2666 and 3200 MT/s

AMD Socket AM4
AMD Ryzen 7 1800X
MSI X370 Xpower Gaming Titanium
2x 8GB G.Skill RipJaws V DDR4-3200 @ 3200 MT/s

Intel LGA 1151
Intel Core i5-7700K
MSI Z270 Gaming M7
2x 8GB G.Skill RipJaws V DDR4-3200 @ 2666 and 3200 MT/s

All
EVGA GeForce GTX 1080 FE
1TB Samsung PM863
SilverStone ST1500, 1500W
Windows 10 Creators Update Version 1703
Cooling
Germany
Alphacool Eiszeit 2000 Chiller
Alphacool Eisblock XPX
Thermal Grizzly Kryonaut (For Cooler Switch)
Monitor
Eizo EV3237-BK
PC Case
Lian Li PC-T70 with Extension Kit and Mods
Configurations: Open Benchtable, Closed Case
Power Consumption Measurement
Contact-free DC Measurement at PCIe Slot (Using a Riser Card)
Contact-free DC Measurement at External Auxiliary Power Supply Cable
Direct Voltage Measurement at Power Supply
2x Rohde & Schwarz HMO 3054, 500MHz Digital Multi-Channel Oscilloscope with Storage Function
4x Rohde & Schwarz HZO50 Current Probe (1mA - 30A, 100kHz, DC)
4x Rohde & Schwarz HZ355 (10:1 Probes, 500MHz)
1x Rohde & Schwarz HMC 8012 Digital Multimeter with Storage Function
Thermal Measurement
1x Optris PI640 80Hz Infrared Camera + PI Connect
Real-Time Infrared Monitoring and Recording
Acoustic Measurement
NTI Audio M2211 (with Calibration File, Low Cut at 50Hz)
Steinberg UR12 (with Phantom Power for Microphones)
Creative X7, Smaart v.7
Custom-Made Proprietary Measurement Chamber, 3.5 x 1.8 x 2.2m (L x D x H)
Perpendicular to Center of Noise Source(s), Measurement Distance of 50cm
Noise Level in dB(A) (Slow), Real-time Frequency Analyzer (RTA)
Graphical Frequency Spectrum of Noise


image001


image002


image001


image003


image002


image004


aHR0cDovL21lZGlhLmJlc3RvZm1pY3JvLmNvbS8w


image002


image002


image002


image002


image002


image002


image002


image002


image002


03 Adobe CC InDesign


aHR0cDovL21lZGlhLmJlc3RvZm1pY3JvLmNvbS9R


aHR0cDovL21lZGlhLmJlc3RvZm1pY3JvLmNvbS9R


aHR0cDovL21lZGlhLmJlc3RvZm1pY3JvLmNvbS9R


aHR0cDovL21lZGlhLmJlc3RvZm1pY3JvLmNvbS9R


aHR0cDovL21lZGlhLmJlc3RvZm1pY3JvLmNvbS9R


aHR0cDovL21lZGlhLmJlc3RvZm1pY3JvLmNvbS9R


aHR0cDovL21lZGlhLmJlc3RvZm1pY3JvLmNvbS9R


aHR0cDovL21lZGlhLmJlc3RvZm1pY3JvLmNvbS9R


aHR0cDovL21lZGlhLmJlc3RvZm1pY3JvLmNvbS9V


aHR0cDovL21lZGlhLmJlc3RvZm1pY3JvLmNvbS9R


aHR0cDovL21lZGlhLmJlc3RvZm1pY3JvLmNvbS9R


aHR0cDovL21lZGlhLmJlc3RvZm1pY3JvLmNvbS9R


aHR0cDovL21lZGlhLmJlc3RvZm1pY3JvLmNvbS9R


aHR0cDovL21lZGlhLmJlc3RvZm1pY3JvLmNvbS9R


aHR0cDovL21lZGlhLmJlc3RvZm1pY3JvLmNvbS9R


aHR0cDovL21lZGlhLmJlc3RvZm1pY3JvLmNvbS9R


aHR0cDovL21lZGlhLmJlc3RvZm1pY3JvLmNvbS9R


aHR0cDovL21lZGlhLmJlc3RvZm1pY3JvLmNvbS9R


aHR0cDovL21lZGlhLmJlc3RvZm1pY3JvLmNvbS9R


aHR0cDovL21lZGlhLmJlc3RvZm1pY3JvLmNvbS9R


전력소모


aHR0cDovL21lZGlhLmJlc3RvZm1pY3JvLmNvbS9R


aHR0cDovL21lZGlhLmJlc3RvZm1pY3JvLmNvbS9R


aHR0cDovL21lZGlhLmJlc3RvZm1pY3JvLmNvbS9R


출처 - http://www.tomshardware.com

반응형
Posted by 랩터 인터내셔널