'AMD'에 해당되는 글 12건

  1. 2020.02.02 시스코(Cisco), AMD CEO 리사수를 이사회에 임명 by 랩터 인터내셔널
  2. 2019.11.10 AMD, 라이젠9 3950X, 3세대 스레드리퍼 3970X-3960X, 애슬론 3000G 발표 by 랩터 인터내셔널
  3. 2019.01.11 AMD 3세대 라이젠 프로세서 올 여름 투입 (zen2) by 랩터 인터내셔널
  4. 2018.11.03 AMD, 노스브리지 분해로 MCM CPU 메모리 병목 현상 해결? (Zen2) by 랩터 인터내셔널
  5. 2018.10.27 3분기 인텔 실적 발표, "CPU 초 호황" 공급 부족 공식 확인 by 랩터 인터내셔널
  6. 2018.01.13 2018년 1월 전세계 CPU 점유율 (인텔 vs AMD) by 랩터 인터내셔널
  7. 2017.09.04 8월 스팀 통계) CPU, GPU 점유율 및 AMD의 몰락 by 랩터 인터내셔널
  8. 2017.07.29 AMD 라이젠3 1300X, 1200 성능 by 랩터 인터내셔널
  9. 2017.02.08 AMD Ryzen, 스카이레이크 다이보다 10% 더 작다 by 랩터 인터내셔널
  10. 2016.04.22 인텔 CPU 성능순위, amd by 랩터 인터내셔널

네트워크 장비 전문 기업 시스코(Cisco)가 AMD 회장 겸 CEO 리사수(Lisa T. Su) 박사를 자사 이사회에 임명한다고 발표했다.


Cisco CEO 척 로빈스(Chuck Robbins)는 “리사수는 반도체 산업에 대한 깊은 전문 지식을 갖춘 유능한 비즈니스 리더로 우리는 획기적인 기술과 5G 시대를 위한 새로운 인터넷을 계속 개발하면서 시스코의 이사회와 비즈니스에 대한 그녀의 공헌을 기대한다."고 밝혔다.


리사수 박사는 Freescale Semiconductor, Inc의 네트워킹 및 멀티미디어 담당 수석 부사장 및 총괄 책임자로 근무했으며 회사의 통신 및 응용 프로그램 프로세서 사업에 대한 글로벌 전략, 마케팅 및 엔지니어링을 담당했다. 또한 IBM에서는 실리콘 기술, 반도체 R&D 운영의 전략적 방향을 담당하는 반도체 연구 개발 센터의 부사장을 포함하여 다양한 엔지니어링 및 비즈니스 리더십 직책으로 IBM에서 지난 13년간 근무했다. IBM에 입사하기 전에는 1994년부터 1995년까지 Texas Instruments Incorporated의 기술직으로 근무했다.


이후 리사수는 2012년 AMD에 합류했으며 2014년 10월부터 AMD의 CEO 맡고 있다.

반응형
Posted by 랩터 인터내셔널

AMD는 3가지 다양한 시장에서 4개의 새로운 데스크탑 프로세서를 발표했다. 우선 새로운 Ryzen 9 3950X 프로세서, 다음 새로운 기본 엔트리 레벨 APU Athlon 3000G를 출시, 마지막으로 Ryzen Threadripper 3960X와 Ryzen Threadripper 3970X의 두 가지 모델을 갖춘 3세대 Ryzen Threadripper HEDT 프로세서 제품군이다.


AMD는 공식적으로 AGESA Combo PI 1.0.0.4B 마이크로 코드를 출시했으며 이를 통해 ECO 모드라고 하는 모든 "Zen 2" 기반 Ryzen 프로세서에 새로운 기능을 도입했다. Ryzen 9 3950X는 AM4 패키지의 16코어 / 32스레드 프로세서이며 모든 소켓 AM4 마더보드와 호환, AGESA Combo PI 1.0.0.4B 마이크로 코드로 최신 BIOS 업데이트가 제공된다. 이 프로세서에는 3.50GHz 기본 클럭 속도, 4.70GHz 최대 부스트 주파수 및 12코어 Ryzen 9 3900X와 동일한 105W TDP가 제공된다. 코어당 512KB 전용 L2 캐시와 64MB 공유 L3 캐시를 갖춘 이 칩에는 거대한 72MB의 통합 캐시가 있다. AMD가 발표한 성능 수치에 따르면 Ryzen 9 3950X는 Cinebench R20에서 테스트 한 Ryzen 7 2700X보다 최대 22% 높은 싱글 스레드 성능을 제공하며 Core i9-9900K보다 79% 높은 멀티 스레드 성능을 제공한다.


또한 AMD는 소켓 AM4 프로세서 라인업의 하위로 새로운 Athlon 3000G을 공개했다. 3000G는 "Zen +" 마이크로 아키텍처 기반의 CPU 코어와 "Vega" 그래픽 아키텍처 기반의 iGPU를 결합한 12nm "Picasso" 실리콘을 기반으로 한다. 3000G는 2코어 / 4스레드 CPU와 3개의 "Vega" NGCU가 포함된 Radeon Vega 3 온보드 그래픽으로 구성된다. CPU는 3.50GHz 클럭으로 Athlon 200GE에 비해 300MHz 상승했다.


AMD는 발표에서 가장 흥미진진한 부분으로 3세대 Ryzen Threadripper HEDT(하이엔드 데스크탑) 프로세서 시리즈를 발표했으며 Threadripper 3960X와 Threadripper 3970X라는 두 가지 모델로 데뷔했다. 이 두 가지는 새로운 sTRX4 CPU 소켓을 기반으로하며 새로운 AMD TRX40 칩셋과 함께 조합된다. 소켓 자체는 이전 TR4 소켓과 물리적으로 유사하며 냉각기 호환성을 제공한다. 즉, TR4와 호환되는 CPU 냉각기 또는 워터 블록도 sTRX4와 호환된다. 오늘 발표 된 두 프로세서의 TDP는 모두 280W, 이전 AMD X399 칩셋 마더보드와 하위 호환성이 없으며 구형 Threadrippers도 작동하지 않는다.


Ryzen Threadripper 3960X의 프로세서 가격은 USD $1,399(이전 세대 24코어 Threadripper 2970WX와 동일한 가격)에 24코어 / 48스레드. 3960X는 최대 4.50GHz의 부스트와 3.140GHz의 총 캐시(L2 + L3)를 제공하며 3.80GHz의 클럭을 제공한다. 반면 Threadripper 3970X는 미화 $1,999의 32코어 / 64스레드로 최대 코어 수에도 불구하고 3.70GHz 공칭 클럭과 4.50GHz 최대 부스트 클럭을 제공한다. 두 칩 모두 2019년 11월 25일에 구입할 수 있다.

반응형
Posted by 랩터 인터내셔널
001_l.jpg


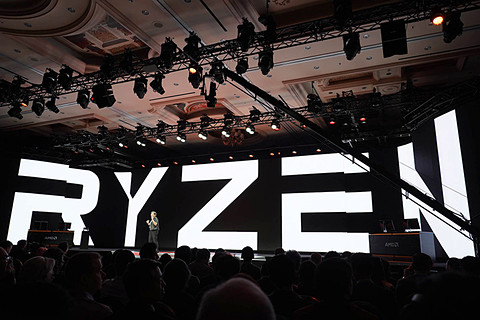
CES 2019 회기 2일째인 1월 9일(미국 시간) AMD 사장 겸 CEO 리사 수가 기조 강연에 등단해 회사의 전략과 신제품 등을 설명했다.


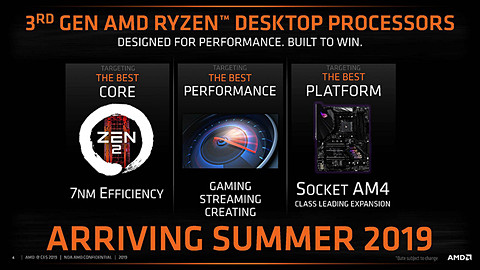
이 중 수는 7nm 프로세스로 생산된 Zen2에 근거한 제 3세대 Ryzen 프로세서를 2019년 중반에 투입하겠다고 밝혔다.


PCI Express 4.0 대응, Socket AM4 마더보드 호환으로 이용할 수 있는 제 3세대 Ryzen

002_l.jpg


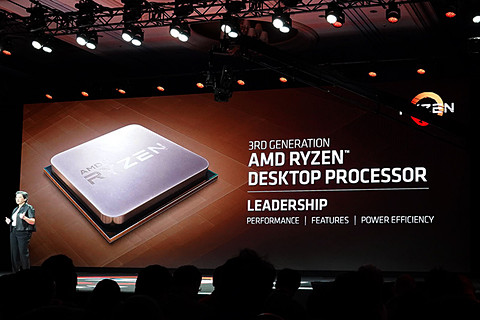
AMD의 수가 공개한 것은 동사의 Zen2 아키텍처에 근거한 새로운 데스크탑 PC용 프로세서로 제 3세대 Ryzen 프로세서로 불리게 된다.


모델 넘버는 3000번대가 되기 때문에 AMD Ryzen Desktop 3000 시리즈가 제품명이 된다.


003_l.jpg


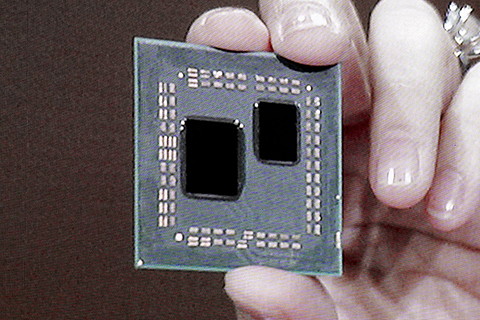
수에 따르면 제 3세대 Ryzen은 7nm 프로세스로 제조되며 CPU 다이, I/O 다이 2개가 1개의 패키지에 통합되는 형태다.


I/O의 다이에는 PCI Express Gen 4(4.0) 컨트롤러가 포함되어 있으며 메인보드가 대응하고 있으면 PCI Express 4.0을 이용할 수 있다.


004_l.jpg


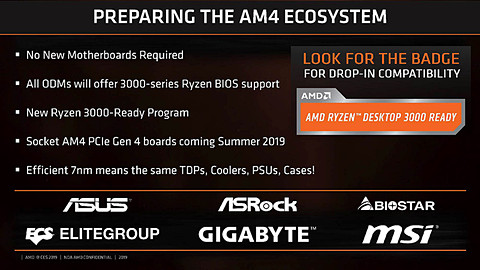
제 3세대 Ryzen은 기존 Ryzen에서 사용되어 온 Socket AM4를 지원하기 때문에 PCI Express 4.0에 대응하지 않는 기존 AM4 마더보드에서 그대로 사용할 수 있다. 이 때문에 이번 여름부터는 제 3세대 Ryzen에 대응한 마더보드가 제공될 예정이다.


또한 기존의 AM4 마더보드에서 제 3세대 Ryzen을 이용할 경우 BIOS 업데이트가 필요하고 AMD에 따르면 BIOS 업데이트는 각 마더보드 제조 업체 등이 제공하는 형태가 된다고 한다.


또 어떤 마더보드가 제 3세대 Ryzen에 대응하고 있는지를 나타내기 위해서 Ryzen 3000 Ready Program이 계획되어 "AMD Ryzen Desktop 3000 Ready"라는 스티커 등이 준비되어 사용자가 가려지게 될 전망이다.


프로세서 자체의 열 설계 및 CPU 쿨러의 마운트용 나사 위치, 전원 유닛 등은 기존 세대와 변경이 없기 때문에 현재의 Ryzen Desktop에서 사용되는 것을 그대로 유용할 수 있다.


Core i9-9900K와 비교해 조금 높은 성능을 발휘하며 30% 저전력이라고 어필

005_l.jpg


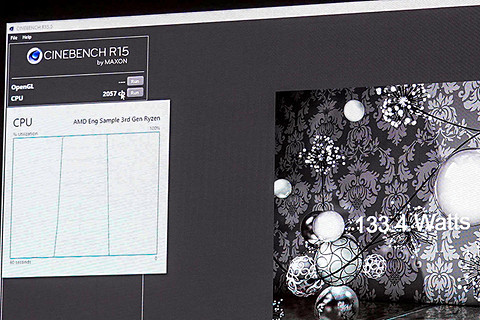
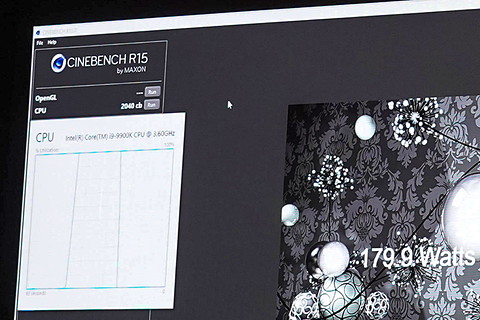
그는 3세대 Ryzen과 Radeon VII를 이용해 3D 게임을 즐기는 시연을 진행했고, 3세대 Ryzen과 Core i9-9900K를 이용한 시연을 공개했다.


비교에 이용된 것은 Cinebench R15로, 제 3세대 Ryzen 스코어가 2057, Core i9-9900K의 스코어는 2040으로 제 3세대 Ryzen이 조금 웃도는 결과가 나타났다.


006_l.jpg
007_l.jpg


또한 시스템의 소비 전력에 대해서 Core i9-9900K가 179.9W였으나, 제 3세대 Ryzen은 134.4W 인 점을 제시하며 "성능에서 Core i9-9900K를 넘어서고, 소비 전력은 30% 낮다"고 밝히며 7nm 프로세스로 생산된 Ryzen의 이점을 어필했다.


008_l.jpg


수에 따르면 3세대 라이젠은 올해 중반 투입할 것으로 알려져 올 여름경에는 새로운 3세대 라이젠이 시장에 투입될 것으로 보인다.


출처 - https://pc.watch.impress.co.jp/docs/news/event/1163917.html

반응형
Posted by 랩터 인터내셔널


AMD는 최대 4개의 8코어 다이 멀티 칩 모듈인 EPYC 엔터프라이즈 프로세서를 통해 데이터 센터 시장에서 경쟁력을 확보했다. 각 다이는 2채널 DDR4 메모리를 제어하는 ​​자체 통합 노스브리지와 32레인 PCI-Express Gen 3.0 루트 컴플렉스를 갖추고 있다. 더 많은 코어를 활용할 수 있지만 메모리 대역폭을 많이 사용하는 응용 프로그램에서는 이러한 접근 방식이 병목 현상을 유발한다. Ryzen Threadripper WX 제품군은 메모리 병목 현상이 많은 비디오 인코딩 벤치마크에서 입출력에 대역폭이 부족해지면서 성능 저하가 나타나는 이러한 병목 현상이 뚜렷하다.


이 문제에 대한 AMD의 해결책은 비활성화 된 노스브리지(메모리 컨트롤러 및 PCIe 루트 컴플렉스가 있는 다이의 일부)를 사용하여 CPU 다이를 설계하는 것이다. 이 솔루션은 곧 출시 될 2세대 EPYC 프로세서(코드명 "로마")에서 구현 될 수 있다. "Zen 2" 세대를 통해 AMD는 통합 노스브릿지가 완전히 비활성화 될 수 있는 CPU 다이를 개발할 수 있다. (메모리 / PCIe 액세스가 전적으로 InfinityFabric에 의존하지 않는 Threadripper WX 프로세서의 "연산 다이"와 동일) 이 다이는 더 넓은 InfinityFabric 인터페이스를 통해 "시스템 컨트롤러" 라는 외부 다이와 통신한다. AMD의 차세대 MCM은 "베가 10" 및 "피지" GPU와 동일한 종류의 실리콘 인터포저와 같이 CPU 다이에 둘러싸인 중앙 집중식 시스템 컨트롤러 다이를 구성할 수 있다. 인터포저는 MCM에서 다이 사이의 고밀도 미세 배선을 용이하게 하는 실리콘 다이를 말한다.


시스템 컨트롤러 다이는 전체 프로세서의 타운 스퀘어(town-square) 역할을 하며 최대 2TB의 ECC 메모리를 처리 할 수 있는 8채널 DDR4 메모리 컨트롤러를 갖추고 있다. 현재의 EPYC 프로세서와는 달리 이 메모리 인터페이스는 인텔의 구현과 매우 유사하다. 또한 시스템 컨트롤러는 PCI-Express Gen 4.0 x96 루트 컴플렉스를 특징으로하며 x16 대역폭의 그래픽 카드를 6개까지 또는 x8의 경우 최대 12개까지 구동 할 수 있다. 다이는 또한 더 많은 PCIe 레인 외에도 SATA, USB 및 기타 레거시 저 대역폭 I/O와 같은 공통 I/O 인터페이스를 제공하는 서버 컨트롤러 허브 (Server Controller Hub)로 알려진 사우스브리지 (southbridge)를 통합한다. 더 많은 연결성을 제공하는 플랫폼에는 외부 "칩셋" 이 있을 수 있다.


위 내용은 모두 은퇴한 VLSI 엔지니어 @chiakokhua의 예측이다.


출처 - https://www.techpowerup.com/249108/amd-could-solve-memory-bottlenecks-of-its-mcm-cpus-by-disintegrating-the-northbridge

반응형
Posted by 랩터 인터내셔널

글로벌 반도체 산업 중심 기업인 인텔이 2018년 3분기 실적을 발표했다. 발표에 따르면 인텔의 3분기 매출액은 전년 동기 대비 19% 증가한 192억 달러, GAAP EPS(주당 순이익)은 1.38 달러로 전년 동기 대비 47% 증가했다.


Key Business Unit Revenue and Trends

Q3 2018

vs. Q3 2017

               PC-centric

CCG

$10.2 billion

up

16%

               Data-centric

DCG

$6.1 billion

up

26%

IOTG

$919 million

up

8%

NSG

$1.1 billion

up

21%

PSG

$496 million

up

6%

up

22%*


각 사업 부문 별 세부 실적을 보면 PC 사업 부문을 총괄하는 클라이언트 컴퓨팅 그룹(CCG)은 전년 대비 16% 증가한 $10.2 billion, 클라우드 및 서버, 시스템 사업을 총괄하는 데이터 센터 그룹(DCG)은 전년 대비 26% 증가한 $6.1 billion, 사물 인터넷 그룹(IOTG)은 전년 대비 8% 증가한 $919 million, 비 휘발성 솔루션즈 그룹(NSG)은 전년 대비 21% 증가한 $1.1 billion, 프로그래머블 솔루션즈 그룹(PSG)은 전년 대비 6% 증가한 $496 million을 기록했다.


Q3 2018 Financial Highlights

GAAP

Non-GAAP

Q3 2018

Q3 2017

vs. Q3 2017

Q3 2018

Q3 2017

vs. Q3 2017

Revenue ($B)

$19.2

$16.1

up 19%

$19.2^

$16.1^

up 19%

Gross Margin

64.5%

62.3%

up 2.2 pts

65.9%

64.0%

up 1.9 pts

R&D and MG&A ($B)

$5.0

$4.9

up 3%

$5.0^

$4.8

up 6%

Operating Income ($B)

$7.3

$5.1

up 43%

$7.6

$5.6

up 36%

Tax Rate

10.4%

23.8%

down 13.4 pts

11.9%

23.8%^

down 11.9 pts

Net Income ($B)

$6.4

$4.5

up 42%

$6.5

$4.8

up 34%

Earnings Per Share

$1.38

$0.94

up 47%

$1.40

$1.01

up 39%

^ No adjustment on a non-GAAP basis


인텔의 사업 구조를 분석하면 끊임없이 지속 성장하고 있는 데이터 센터 사업 부문과 PC 사업 부분의 안정된 투톱 운영 체제에 더불어 사물 인터넷과 비휘발성 솔루션즈, 프로그래머블 솔루션즈 사업 부문까지 모두 지속 성장하며 뒷받침하는 강력한 밸런스의 비지니스 포트폴리오를 과시하고 있다.


얼마 전 인텔은 전 세계 파트너에게 공식 배포한 서한에서 3분기부터 시작 된 폭발적인 인텔 CPU 수요 증가로 공급이 수요를 따라가지 못하는 "초 호황" 임을 밝혔는데 그것을 실적으로서 증명하고 있다. 따라서 인텔은 이러한 초 호황에 따라 연간 매출 전망을 712억 달러로, GAAP EPS 전망을 약 4.52 달러로, 비 GAAP EPS를 4.53 달러로 상향 조정했고, 장기간 호황이 이어질 것으로 전망되고 있다.


"PC 및 데이터 센터 비즈니스 전반에 걸쳐 예상보다 높은 고객 수요가 3분기에도 계속됐다. 이로 인해 기록적인 수익을 거두었고, 올해 성과는 1월 기대치보다 60억 달러를 넘어섰다. 매우 경쟁이 치열한 시장에서 고객들은 계속해서 인텔을 선택하여 매우 기쁘며 4분기에 우리는 고객의 성장을 지원하기 위해 인텔 제품에 대한 엄청난 시장 수요를 공급해야 하는 과제에 집중하고 있다" (인텔 임시 CEO & CFO 밥 스완)


이러한 인텔의 CPU 공급 부족 사태에도 특별한 혜택이 없을 것이라는 IDC의 예측대로, 앞서 실적을 발표한 AMD는 저조한 실적을 발표하며 인텔과는 완전히 상반 된 방향으로 추락하여 전 세계 기업 고객 및 일반 소비자들의 인텔 쏠림 현상은 더욱 가속화되고 있는 것으로 확인되고 있다. 


인텔의 양대 산맥인 클라이언트 컴퓨팅 그룹과 데이터 센터 그룹 외에도 실적을 뒷받침하며 지속 성장하고 있는 다른 사업 부분도 주목할 필요성이 있다. Internet of Things Group (IOTG)도 기록적인 수익을 기록했으며 매출은 광범위한 비즈니스 강점으로 전년 대비 19% 증가했고, 메모리 사업(NSG)의 기록적인 매출은 전년 대비 21% 증가했다. 인텔의 프로그래머블 솔루션 그룹(PSG) 매출은 데이터 센터의 지속적인 강세와 강력한 유기적 성장으로 전년 대비 6% 성장했다. PSG는 eASIC 인수 및 Intel Stratix 10 SX FPGA와 함께 새로운 Intel Programmable Acceleration Card(PAC) 도입으로 제품 포트폴리오를 확장했다. 또한 모빌아이(Mobileye)는 고객 모멘텀이 계속됨에 따라 약 50% 증가한 1억 9100 만 달러의 사상 최대 매출을 기록했다.

반응형
Posted by 랩터 인터내셔널


출처 - hthttps://www.cpubenchmark.net/market_share.html


작년 3월, 신형 라이젠 프로세서 출시에 힘입어 2분기까지 소폭 상승세를 보였던 AMD의 점유율은 3분기부터 다시 내리막이 시작되어 2018년 1월 현재 20%가 붕괴되며 약 18% 정도로 떨어져 작년 라이젠 프로세서의 출시 전 시점으로 복귀됐다. 반면 인텔은 점유율이 꾸준히 상승해 1월 현재 82%로 돌아왔다.

반응형
Posted by 랩터 인터내셔널

전세계 게이머들이 모이는 스팀의 2017년 8월 점유율 (http://store.steampowered.com/)


CPU 점유율은 인텔과 AMD 격차가 더욱 커져 인텔은 82%까지 상승, AMD는 17%까지 내려가 매달 차이가 더 벌어지고 있다.


GPU 점유율도 엔비디아와 AMD의 격차가 더욱 커져 엔비디아가 67%로 계속 상승, AMD는 18%까지 계속 내려가고 있다.


가상현실 헤드셋 시장에서 오큘러스 리프트(43%)가 계속 상승하여 HTC 바이브(52%)를 바짝 추격하고 있다.


그 외 가장 많이 사용하는 OS는 윈도우10 64비트 버전으로 50%를 돌파했고, RAM은 8GB, CPU는 쿼드코어, 그래픽카드는 지포스GTX 1060, 해상도는 1920X1080이 가장 많이 사용되고 있다.


2017년 8월 스팀 통계를 보면 게이밍 시장에서 AMD CPU와 AMD 그래픽카드가 몰락하고 있다는 점을 데이터로 확인할 수 있다.

반응형
Posted by 랩터 인터내셔널


AMD Ryzen SKUs
 Cores/
Threads
Base/
Turbo
XFRL3TDPRetail
7/27
Cooler
Ryzen 7 1800X8/163.6/4.0+10016 MB95 W$419-
Ryzen 7 1700X8/163.4/3.8+10016 MB95 W$299-
Ryzen 7 17008/163.0/3.7+5016 MB65 W$279Spire
RGB
Ryzen 5 1600X6/123.6/4.0+10016 MB95 W$229-
Ryzen 5 16006/123.2/3.6+10016 MB65 W$209Spire
Ryzen 5 1500X4/83.5/3.7+20016 MB65 W$189Spire
Ryzen 5 14004/83.2/3.4+508 MB65 W$159Stealth
Ryzen 3 1300X4/43.5/3.7+2008 MB65 W$129Stealth
Ryzen 3 12004/43.1/3.4+508 MB65 W$109Stealth


새롭게 등장한 라이젠3 1300X, 1200은 모두 4코어 4스레드 제품으로 1300X가 베이스 3.5 클럭, 부스트 3.7클럭, 1200이 베이스 3.1 클럭, 부스트 3.4 클럭, L3캐시는 8MB, TDP 65와트


Comparison: AMD Ryzen 3 1300X
FeaturesIntel
Core i3-7100
AMD
Ryzen 3 1300X
Intel
Core i3-7300
PlatformZ270, B250X370, B350, A320Z270, B250
SocketLGA1151AM4LGA1151
Cores/Threads2 / 44 / 42 / 4
Base/Turbo/XFR3.9 GHz3.4 / 3.7 / 3.9 GHz4.0 GHz
GPU PCIe 3.0x16x16x16
L2 Cache256 KB/core512 KB/core256 KB/core
L3 Cache3 MB8 MB4 MB
TDP51W65W51W
Retail Price (7/28)$115$129$149


인텔 7100 모델과 라이젠 1300X 스펙비교, 인텔은 2코어 4스레드, 3MB 캐시에 51와트, 1300X는 4코어 4스레드에 8MB 캐시, 65와트


Comparison: AMD Ryzen 3 1200
FeaturesIntel
Pentium G4560
Intel
Pentium G4620
AMD
Ryzen 3 1200
Intel
Core i3-7100
Platform200-series200-series300-series200-series
SocketLGA 1151LGA1151AM4LGA1151
Cores/Threads2 / 42 / 44 / 42 / 4
Base/Turbo3.5 GHz3.7 GHz3.1 / 3.4 GHz3.9 GHz
GPU PCIe 3.0x16x16x16x16
L2 Cache256 KB/core256 KB/core512 KB/core256 KB/core
L3 Cache3 MB3 MB8 MB3 MB
TDP54 W51W65W51W
Retail (7/28)$80$105$109$115


테스트 시스템


Test Setup
ProcessorAMD Ryzen 3 1300X (4C/4T, 3.4G, 65W)
AMD Ryzen 3 1200 (4C/4T, 3.1G, 65W)
MotherboardsASUS Crosshair VI Hero
CoolingNoctua NH-U12S SE-AM4
Power SupplyCorsair AX860i
MemoryCorsair Vengeance DDR4-3000 C15 2x8GB
Memory SettingsDDR4-2400 C15
Video CardsMSI GTX 1080 Gaming X 8GB
ASUS GTX 1060 Strix 6GB
Sapphire Nitro R9 Fury 4GB
Sapphire Nitro RX 480 8GB
Sapphire Nitro RX 460 4GB (CPU Tests)
Hard DriveCrucial MX200 1TB
Optical DriveLG GH22NS50
CaseOpen Test Bed
Operating SystemWindows 10 Pro 64-bit


FCAT Processing: link

One of the more interesting workloads that has crossed our desks in recent quarters is FCAT - the tool we use to measure stuttering in gaming due to dropped or runt frames. The FCAT process requires enabling a color-based overlay onto a game, recording the gameplay, and then parsing the video file through the analysis software. The software is mostly single-threaded, however because the video is basically in a raw format, the file size is large and requires moving a lot of data around. For our test, we take a 90-second clip of the Rise of the Tomb Raider benchmark running on a GTX 980 Ti at 1440p, which comes in around 21 GB, and measure the time it takes to process through the visual analysis tool.

System: FCAT Processing ROTR 1440p GTX1080 Data

3D Movement Algorithm Test v2.1: link

This is the latest version of the self-penned 3DPM benchmark. The goal of 3DPM is to simulate semi-optimized scientific algorithms taken directly from my doctorate thesis. Version 2.1 improves over 2.0 by passing the main particle structs by reference rather than by value, and decreasing the amount of double->float->double recasts the compiler was adding in. It affords a ~25% speed-up over v2.0, which means new data.

System: 3D Particle Movement v2.1

DigiCortex v1.20: link

Despite being a couple of years old, the DigiCortex software is a pet project for the visualization of neuron and synapse activity in the brain. The software comes with a variety of benchmark modes, and we take the small benchmark which runs a 32k neuron/1.8B synapse simulation. The results on the output are given as a fraction of whether the system can simulate in real-time, so anything above a value of one is suitable for real-time work. The benchmark offers a 'no firing synapse' mode, which in essence detects DRAM and bus speed, however we take the firing mode which adds CPU work with every firing.

System: DigiCortex 1.20 (32k Neuron, 1.8B Synapse)

Agisoft Photoscan 1.0: link

Photoscan stays in our benchmark suite from the previous version, however now we are running on Windows 10 so features such as Speed Shift on the latest processors come into play. The concept of Photoscan is translating many 2D images into a 3D model - so the more detailed the images, and the more you have, the better the model. The algorithm has four stages, some single threaded and some multi-threaded, along with some cache/memory dependency in there as well. For some of the more variable threaded workload, features such as Speed Shift and XFR will be able to take advantage of CPU stalls or downtime, giving sizeable speedups on newer microarchitectures.

System: Agisoft Photoscan 1.0 Total Time


Corona 1.3: link

Corona is a standalone package designed to assist software like 3ds Max and Maya with photorealism via ray tracing. It's simple - shoot rays, get pixels. OK, it's more complicated than that, but the benchmark renders a fixed scene six times and offers results in terms of time and rays per second. The official benchmark tables list user submitted results in terms of time, however I feel rays per second is a better metric (in general, scores where higher is better seem to be easier to explain anyway). Corona likes to pile on the threads, so the results end up being very staggered based on thread count.

Rendering: Corona Photorealism

Blender 2.78: link

For a render that has been around for what seems like ages, Blender is still a highly popular tool. We managed to wrap up a standard workload into the February 5 nightly build of Blender and measure the time it takes to render the first frame of the scene. Being one of the bigger open source tools out there, it means both AMD and Intel work actively to help improve the codebase, for better or for worse on their own/each other's microarchitecture.

Rendering: Blender 2.78

LuxMark v3.1: Link

As a synthetic, LuxMark might come across as somewhat arbitrary as a renderer, given that it's mainly used to test GPUs, but it does offer both an OpenCL and a standard C++ mode. In this instance, aside from seeing the comparison in each coding mode for cores and IPC, we also get to see the difference in performance moving from a C++ based code-stack to an OpenCL one with a CPU as the main host.

Rendering: LuxMark CPU C++Rendering: LuxMark CPU OpenCL

POV-Ray 3.7.1b4: link

Another regular benchmark in most suites, POV-Ray is another ray-tracer but has been around for many years. It just so happens that during the run up to AMD's Ryzen launch, the code base started to get active again with developers making changes to the code and pushing out updates. Our version and benchmarking started just before that was happening, but given time we will see where the POV-Ray code ends up and adjust in due course.

Rendering: POV-Ray 3.7

Cinebench R15: link

The latest version of CineBench has also become one of those 'used everywhere' benchmarks, particularly as an indicator of single thread performance. High IPC and high frequency gives performance in ST, whereas having good scaling and many cores is where the MT test wins out.

Rendering: CineBench 15 SingleThreadedRendering: CineBench 15 MultiThreaded


SunSpider 1.0.2: link

The oldest web-based benchmark in this portion of our test is SunSpider. This is a very basic javascript algorithm tool, and ends up being more a measure of IPC and latency than anything else, with most high-performance CPUs scoring around about the same. The basic test is looped 10 times and the average taken. We run the basic test 4 times.

Web: SunSpider on Chrome 56

Mozilla Kraken 1.1: link

Kraken is another Javascript based benchmark, using the same test harness as SunSpider, but focusing on more stringent real-world use cases and libraries, such as audio processing and image filters. Again, the basic test is looped ten times, and we run the basic test four times.

Web: Mozilla Kraken 1.1 on Chrome 56

Google Octane 2.0: link

Along with Mozilla, as Google is a major browser developer, having peak JS performance is typically a critical asset when comparing against the other OS developers. In the same way that SunSpider is a very early JS benchmark, and Kraken is a bit newer, Octane aims to be more relevant to real workloads, especially in power constrained devices such as smartphones and tablets.

Web: Google Octane 2.0 on Chrome 56

WebXPRT 2015: link

While the previous three benchmarks do calculations in the background and represent a score, WebXPRT is designed to be a better interpretation of visual workloads that a professional user might have, such as browser based applications, graphing, image editing, sort/analysis, scientific analysis and financial tools.

Web: WebXPRT 15 on Chrome 56


7-Zip 9.2: link

One of the freeware compression tools that offers good scaling performance between processors is 7-Zip. It runs under an open-source licence, is fast, and easy to use tool for power users. We run the benchmark mode via the command line for four loops and take the output score.

Encoding: 7-Zip

WinRAR 5.40: link

For the 2017 test suite, we move to the latest version of WinRAR in our compression test. WinRAR in some quarters is more user-friendly that 7-Zip, hence its inclusion. Rather than use a benchmark mode as we did with 7-Zip, here we take a set of files representative of a generic stack (33 video files in 1.37 GB, 2834 smaller website files in 370 folders in 150 MB) of compressible and incompressible formats. The results shown are the time taken to encode the file. Due to DRAM caching, we run the test 10 times and take the average of the last five runs when the benchmark is in a steady state.

Encoding: WinRAR 5.40

AES Encoding

Algorithms using AES coding have spread far and wide as a ubiquitous tool for encryption. Again, this is another CPU limited test, and modern CPUs have special AES pathways to accelerate their performance. We often see scaling in both frequency and cores with this benchmark. We use the latest version of TrueCrypt and run its benchmark mode over 1GB of in-DRAM data. Results shown are the GB/s average of encryption and decryption.

Encoding: AES

HandBrake v1.0.2 H264 and HEVC: link

As mentioned above, video transcoding (both encode and decode) is a hot topic in performance metrics as more and more content is being created. First consideration is the standard in which the video is encoded, which can be lossless or lossy, trade performance for file-size, trade quality for file-size, or all of the above can increase encoding rates to help accelerate decoding rates. Alongside Google's favorite codec, VP9, there are two others that are taking hold: H264, the older codec, is practically everywhere and is designed to be optimized for 1080p video, and HEVC (or H265) that is aimed to provide the same quality as H264 but at a lower file-size (or better quality for the same size). HEVC is important as 4K is streamed over the air, meaning less bits need to be transferred for the same quality content.

Handbrake is a favored tool for transcoding, and so our test regime takes care of three areas.

Low Quality/Resolution H264: He we transcode a 640x266 H264 rip of a 2 hour film, and change the encoding from Main profile to High profile, using the very-fast preset.

Encoding: Handbrake H264 (LQ)

High Quality/Resolution H264: A similar test, but this time we take a ten-minute double 4K (3840x4320) file running at 60 Hz and transcode from Main to High, using the very-fast preset.

Encoding: Handbrake H264 (HQ)

HEVC Test: Using the same video in HQ, we change the resolution and codec of the original video from 4K60 in H264 into 4K60 HEVC.

Encoding: Handbrake HEVC (4K)


PCMark8: link

Despite originally coming out in 2008/2009, Futuremark has maintained PCMark8 to remain relevant in 2017. On the scale of complicated tasks, PCMark focuses more on the low-to-mid range of professional workloads, making it a good indicator for what people consider 'office' work. We run the benchmark from the commandline in 'conventional' mode, meaning C++ over OpenCL, to remove the graphics card from the equation and focus purely on the CPU. PCMark8 offers Home, Work and Creative workloads, with some software tests shared and others unique to each benchmark set.

Office: PCMark8 Creative (non-OpenCL)

Office: PCMark8 Home (non-OpenCL)

SYSmark 2014 SE: link

SYSmark is developed by Bapco, a consortium of industry CPU companies. The goal of SYSmark is to take stripped down versions of popular software, such as Photoshop and Onenote, and measure how long it takes to process certain tasks within that software. The end result is a score for each of the three segments (Office, Media, Data) as well as an overall score. Here a reference system (Core i3-6100, 4GB DDR3, 256GB SSD, Integrated HD 530 graphics) is used to provide a baseline score of 1000 in each test.

A note on context for these numbers. AMD left Bapco in the last two years, due to differences of opinion on how the benchmarking suites were chosen and AMD believed the tests are angled towards Intel processors and had optimizations to show bigger differences than what AMD felt was present. The following benchmarks are provided as data, but the conflict of opinion between the two companies on the validity of the benchmark is provided as context for the following numbers.


3D Particle Movement v1

3DPM is a self-penned benchmark, taking basic 3D movement algorithms used in Brownian Motion simulations and testing them for speed. High floating point performance, MHz and IPC wins in the single thread version, whereas the multithread version has to handle the threads and loves more cores. This is the original version, written in the style of a typical non-computer science student coding up an algorithm for their theoretical problem, and comes without any non-obvious optimizations not already performed by the compiler, such as false sharing.

Legacy: 3DPM v1 Single Threaded

Legacy: 3DPM v1 MultiThreaded

CineBench 11.5 and 10

Cinebench is a widely known benchmarking tool for measuring performance relative to MAXON's animation software Cinema 4D. Cinebench has been optimized over a decade and focuses on purely CPU horsepower, meaning if there is a discrepancy in pure throughput characteristics, Cinebench is likely to show that discrepancy. Arguably other software doesn't make use of all the tools available, so the real world relevance might purely be academic, but given our large database of data for Cinebench it seems difficult to ignore a small five-minute test. We run the modern version 15 in this test, as well as the older 11.5 and 10 due to our back data.

Legacy: CineBench 11.5 Single ThreadedLegacy: CineBench 11.5 MultiThreadedLegacy: CineBench 10 Single ThreadedLegacy: CineBench 10 MultiThreaded

x264 HD 3.0

Similarly, the x264 HD 3.0 package we use here is also kept for historic regressional data. The latest version is 5.0.1, and encodes a 1080p video clip into a high-quality x264 file. Version 3.0 only performs the same test on a 720p file, and in most circumstances the software performance hits its limit on high-end processors, but still works well for mainstream and low-end. Also, this version only takes a few minutes, whereas the latest can take over 90 minutes to run.

Legacy: x264 3.0 Pass 1Legacy: x264 3.0 Pass 2


example of a mid-game setup at our settings.

At both 1920x1080 and 4K resolutions, we run the same settings. Civilization 6 has sliders for MSAA, Performance Impact and Memory Impact. The latter two refer to detail and texture size respectively, and are rated between 0 (lowest) to 5 (extreme). We run our Civ6 benchmark in position four for performance (ultra) and 0 on memory, with MSAA set to 2x.

For reviews where we include 8K and 16K benchmarks (Civ6 allows us to benchmark extreme resolutions on any monitor) on our GTX 1080, we run the 8K tests similar to the 4K tests, but the 16K tests are set to the lowest option for Performance.

For all our results, we show the average frame rate at 1080p first. Mouse over the other graphs underneath to see 99th percentile frame rates and 'Time Under' graphs, as well as results for other resolutions. All of our benchmark results can also be found in our benchmark engine, Bench.

MSI GTX 1080 Gaming 8G Performance

89130.png


For our benchmark, we run a fixed v2.11 version of the game due to some peculiarities of the splash screen added after the merger with the standalone Escalation expansion, and have an automated tool to call the benchmark on the command line. (Prior to v2.11, the benchmark also supported 8K/16K testing, however v2.11 has odd behavior which nukes this.)

At both 1920x1080 and 4K resolutions, we run the same settings. Ashes has dropdown options for MSAA, Light Quality, Object Quality, Shading Samples, Shadow Quality, Textures, and separate options for the terrain. There are several presents, from Very Low to Extreme: we run our benchmarks at Extreme settings, and take the frame-time output for our average, percentile, and time under analysis.

For all our results, we show the average frame rate at 1080p first. Mouse over the other graphs underneath to see 99th percentile frame rates and 'Time Under' graphs, as well as results for other resolutions. All of our benchmark results can also be found in our benchmark engine, Bench.

MSI GTX 1080 Gaming 8G Performance

89142.png


The title has an in-game benchmark, for which we run with an automated script implement the graphics settings, select the benchmark, and parse the frame-time output which is dumped on the drive. The graphics settings include standard options such as Graphical Quality, Lighting, Mesh, Motion Blur, Shadow Quality, Textures, Vegetation Range, Depth of Field, Transparency and Tessellation. There are standard presets as well.

We run the benchmark at 1080p and a native 4K, using our 4K monitors, at the Ultra preset. Results are averaged across four runs and we report the average frame rate, 99th percentile frame rate, and time under analysis. 

For all our results, we show the average frame rate at 1080p first. Mouse over the other graphs underneath to see 99th percentile frame rates and 'Time Under' graphs, as well as results for other resolutions. All of our benchmark results can also be found in our benchmark engine, Bench.

MSI GTX 1080 Gaming 8G Performance

89156.png


#1 Geothermal Valley

MSI GTX 1080 Gaming 8G Performance

89161.png


#2 Prophet's Tomb 

MSI GTX 1080 Gaming 8G Performance

89170.png
 

#3 Spine of the Mountain 

MSI GTX 1080 Gaming 8G Performance

89172.png


The graphics settings for Rocket League come in four broad, generic settings: Low, Medium, High and High FXAA. There are advanced settings in place for shadows and details; however, for these tests, we keep to the generic settings. For both 1920x1080 and 4K resolutions, we test at the High preset with an unlimited frame cap.

For all our results, we show the average frame rate at 1080p first. Mouse over the other graphs underneath to see 99th percentile frame rates and 'Time Under' graphs, as well as results for other resolutions. All of our benchmark results can also be found in our benchmark engine, Bench.

MSI GTX 1080 Gaming 8G Performance

89181.png


There are no presets for the graphics options on GTA, allowing the user to adjust options such as population density and distance scaling on sliders, but others such as texture/shadow/shader/water quality from Low to Very High. Other options include MSAA, soft shadows, post effects, shadow resolution and extended draw distance options. There is a handy option at the top which shows how much video memory the options are expected to consume, with obvious repercussions if a user requests more video memory than is present on the card (although there’s no obvious indication if you have a low end GPU with lots of GPU memory, like an R7 240 4GB).

To that end, we run the benchmark at 1920x1080 using an average of Very High on the settings, and also at 4K using High on most of them. We take the average results of four runs, reporting frame rate averages, 99th percentiles, and our time under analysis.

For all our results, we show the average frame rate at 1080p first. Mouse over the other graphs underneath to see 99th percentile frame rates and 'Time Under' graphs, as well as results for other resolutions. All of our benchmark results can also be found in our benchmark engine, Bench.

MSI GTX 1080 Gaming 8G Performance

89184.png


Power Consumption

For our power consumption readings, we run a Prime 95 load and slowly ramp up the number of threads in play, taking power data from the internal CPU registers that report for when turbo modes or thermal modes should activate. Depending on the CPU access, we can get data that varies from the full package down to individual cores, uncore, integrated graphics and DRAM controllers.

For the Ryzen CPUs, the API pulls out the total package power consumption first.

 Power: Total Package (Idle)Power: Total Package (1T)Power: Total Package (Full Load)

At idle, all the CPUs are pretty much equivalent. The cores are fully idle here, leaving the rest of the chip active enough for tick-over. As we ramp up the load, the higher-frequency Ryzen CPUs move towards their 65W TDP, with the Ryzen 3 1300X almost being spot on at 64.2W. The Intel CPUs are clocked higher, but only have two cores to contend with.  The Ryzen 3 1200 is clocked lower than the Ryzen 3 1300X, hitting a better efficiency point in the Zen design. This ultimately bodes well for upcoming quad-core SKUs in laptops.

Power: Cores Only (1T Load)Power: Cores Only (Full Load)

One of the odd things about the power consumption of the Ryzen 3 CPUs is the difference between how much power the cores internally measure compared to the full power consumption of the package measured as a whole, including the Infinity Fabric, DRAM controllers, IO and such. For the Ryzen 3 1200 for example, at full load the package has a power consumption of 40.43 W total, but the cores only count for 23.05W, leaving 17.38W on the table for the non-core elements in the chip. If we compare that to the Ryzen 5 1500X, we have 68.79W for the package and 49.69W for the cores, a 19.1W difference. For the Ryzen 7 1700X, it becomes 81.51W for the package and 62.10W for the cores, a 19.4W difference.


AMD CPU의 경우 1300X 및 1500X는 기본 / 터보 주파수 (3400/3700 대 3500/3700)에 가까워 거의 같으며 Ryzen 3 1200은 3100/3400에서 약 13 % 낮아집니다.

Intel CPU는 3.5 GHz의 Pentium G4560과 Core i3의 3.9 GHz, 4.0 GHz 및 4.1 GHz에서 차별화 된 커브를 보여줍니다. Core i5 7400의 기저 주파수는 3.0 GHz이고 터보는 3.5 GHz입니다.


For the multi-thread performance:


Ryzen 3 1200은 다시 -12% 정도로 낮아지는 반면 동시 다중 스레딩을 사용하는 Ryzen 5 1500X는 1300X보다 +40% 증가합니다. Ryzen 3 1200과 Core i3 - 7300은 밀접하게 매치되었지만 Ryzen은 ~ 40달러 저렴하게 가격에 이긴다하더라도 모든 듀얼 코어 인텔 제품은 AMD의 쿼드 코어에 비해 뒤쳐져 있습니다. Core i5-7400은 Ryzen 3 1300X와 경쟁하며 쿼드 코어이므로 IPC가 높기 때문에 주파수는 낮지만 인텔은 $50 + 프리미엄으로 제공됩니다.

결합 된 올인원 그래프의 경우 혼합 된 작업 부하 데이터를 포함하고 단일 : 다중 : 혼합 스레드 작업 부하에 대해 결과에 40:50:10을 가중했습니다.


첫째, Ryzen 3 1200은 매력적인 옵션이 아닙니다. 펜티엄의 +2 -3%을 수행하지만 30달러가 더 비쌉니다. 코어 i3-7100은 10달러 이하의 비용으로 8%를 상회합니다.

다음 Ryzen 3 1300X는 코어 i3 - 7300 / 7320과 코어 i5 - 7400에 비해 달러당 성능에 분명히 승리합니다. Core i3 - 7100과 비교했을때는 10 - 15% 정도의 성능 향상을 보였는데 이는 비용의 10% 미만입니다. 예산에 따라 각 옵션은 매력적인 옵션일 수 있습니다.


출처 - http://www.anandtech.com

반응형
Posted by 랩터 인터내셔널


AMD가 ISSCC 참가하여 자사의 Zen x86 코어가 현재 출시되는 인텔의 2세대 14나노 프로세서 다이보다 10% 작다고 발표했다. 보고서에 따르면 분석가와 인텔 엔지니어는 라이젠 코어가 분명히 경쟁적이라고 밝혔지만 아직 정확히 알려지지 않은 수많은 변수들이 있고 AMD가 더 작은 다이로 더 높은 마진을 원한다면 칩이 작은 것 뿐만 아니라 반드시 인텔 대비 성능도 향상 되어야 하는 부분을 지적하고 있다.

AMD가 이전 제품에 비해 ZEN 코어를 개선 한 방법 중 하나는 새로운 칩의 캐패시턴스를 스위칭한 것이며 전체적으로 15%의 개선이 보고되고 있다. 또한 AMD는 보다 낮은 작동 전압은 물론 SenseMI 기술 스위트인 세분화 된 코어당 전압 및 주파수 제어를 실현했다.

반응형
Posted by 랩터 인터내셔널

인텔 CPU 성능순위, amd

TIP&TECH : 2016. 4. 22. 13:23

인텔 및 AMD CPU 성능 순위 종합, 1위부터 1000위까지

컨트롤+F 키로 원하는 모델명 검색


Pos       Model                                       L2 Cache + L3 Cache TDP (Watt) MHz - Turbo Cores / Threads 3DMark06 CPU Cinebench R10 32Bit Single Cinebench R10 32Bit Multi Cinebench R11.5 CPU Single 64Bit Cinebench R11.5 64Bit Cinebench R15 CPU Single 64Bit Cinebench R15 CPU Multi 64Bit wPrime 32 x264 Pass 1 x264 Pass 2
 1 Intel Xeon E5-2697 v2 3MB + 30MB 130 2700 ‑ 3500 12/24
8843
4173
34776
1.25
17.6
105
1550
12.31
164.84
85.16
 2 Intel Core i7-4960X 1.5MB + 15MB 130 3600 ‑ 4000 6/12
8743
11.233
144
1076
4.56
 3 Intel Core i7-6700K 1MB + 8MB 91 4000 ‑ 4200 4/8
90372
65313
260403
1.975
9.75
1786
878.56
5.783
208.423
55.063
 4 Intel Xeon E5-2680 2MB + 20MB 130 2700 ‑ 3500 8/16
7924
4118
26801
1.26
11.95
4.87
 5 Intel Core i7-3960X 1.5MB + 15MB 130 3300 ‑ 3900 6/12
83303
5013.52
27189.52
1.522
10.524
159
1158
5.122
1733
54.83
 6 Intel Core i7-4790K 1MB + 8MB 88 4000 ‑ 4400 4/8
91345
65203
250823
1.955
9.145
1745
8435
5.942
189.142
51.572
 7 Intel Core i7-6700 1MB + 8MB 65 3400 ‑ 4000 4/8
84783
6002.52
24304.52
1.943
8.773
1713
7913
6.8
187.4
50.8
 8 Intel Core i7-4790 1MB + 8MB 84 3600 ‑ 4000 4/8
5926
22667
1.792
8.292
158.52
7652
6.39
171
46
 9 Intel Core i7-5775C 1MB + 6MB 65 3300 ‑ 3700 4/8
7933
5844
22261
1.792
8.322
1523
7723
6.3
179.84
46.24
 10 Intel Core i7-4770K 1MB + 8MB 84 3500 ‑ 3900 4/8
80302
5845
22325
1.77
8.17
7.082
174.8
45.8
 11 Intel Core i7-4790S 1MB + 8MB 65 3200 ‑ 4000 4/8
5566
21072
1.72
7.78
150
714
 12* Intel Xeon E3-1575M v5 1MB + 8MB 45 3000 ‑ 3900 4/8
 13 Intel Core i7-4940MX 1MB + 8MB 57 3100 ‑ 4000 4/8
7678
5853
21022
1.77
7.64
157
708
7
167.43
42.9
 16* Intel Xeon E3-1545M v5 1MB + 8MB 45 2900 ‑ 3800 4/8
 17 Intel Core i7-4930MX 1MB + 8MB 57 3000 ‑ 3900 4/8
74566
56355
208125
1.736
7.556
150
736
7.215
164.314
42.34
 18 Intel Core i7-4980HQ 1MB + 6MB 47 2800 ‑ 4000 4/8
7609
57373
211373
1.744
7.484
1544
6964
6.73
1742
40.72
 19* Intel Core i7-5950HQ 1MB + 6MB 47 2900 ‑ 3800 4/8
 20* Intel Core i7-6920HQ 1MB + 8MB 45 2900 ‑ 3800 4/8
 21* Intel Xeon E3-1535M v5 1MB + 8MB 45 2900 ‑ 3800 4/8
7119
5837
22496
1.84
8.24
162
746
7.07
Pos       Model                                       L2 Cache + L3 Cache TDP (Watt) MHz - Turbo Cores / Threads 3DMark06 CPU Cinebench R10 32Bit Single Cinebench R10 32Bit Multi Cinebench R11.5 CPU Single 64Bit Cinebench R11.5 64Bit Cinebench R15 CPU Single 64Bit Cinebench R15 CPU Multi 64Bit wPrime 32 x264 Pass 1 x264 Pass 2
 22* Intel Core i7-6970HQ 1MB + 8MB 45 2800 ‑ 3700 4/8
 23* Intel Xeon E3-1515M v5 1MB + 8MB 45 2800 ‑ 3700 4/8
 24 Intel Core i7-4910MQ 1MB + 8MB 47 2900 ‑ 3900 4/8
7078
55122
20997.52
1.723
7.523
1533
6973
162
41
 25* Intel Core i7-5850HQ 1MB + 6MB 47 2700 ‑ 3600 4/8
 26* Intel Xeon E3-1505M v5 1MB + 8MB 45 2800 ‑ 3700 4/8
72104
5593.54
21455.54
1.784
7.884
157.54
7284
7.8
 27* Intel Core i7-6870HQ 1MB + 8MB 45 2700 ‑ 3600 4/8
 28 Intel Xeon E3-1231 v3 1MB + 8MB 80 3400 ‑ 3800 4/8
5655
21542
1.7
7.91
152
732
 29 Intel Xeon E3-1230 v3 1MB + 8MB 80 3300 ‑ 3700 4/8
79963
5506
21708
1.66
7.91
145
729
 30 Intel Core i5-6600K 1MB + 6MB 91 3500 ‑ 3900 4/4
7413
61882
213242
1.883
6.933
1664
601.54
196.3
40.1
 31 Intel Core i7-3770K 1MB + 8MB 77 3500 ‑ 3900 4/8
72294
5536
22190
1.65
7.72
6.39
172.3
43.4
 32 Intel Core i7-3940XM 1MB + 8MB 55 3000 ‑ 3900 4/8
71763
52523
205643
1.623
7.453
6.982
161.08
40.6
 33 Intel Core i7-5700HQ 1MB + 6MB 47 2700 ‑ 3500 4/8
76655
55397
215307
1.668
7.788
1448
7208
6.845
166.366
42.926
 34* Intel Core i7-5750HQ 1MB + 6MB 47 2500 ‑ 3400 4/8
 35 Intel Core i7-6820HK 1MB + 8MB 45 2700 ‑ 3600 4/8
7328.54
56485
211655
1.736
7.756
1507
7077
7.332
166.84
44.164
 36 Intel Core i7-6820HQ 1MB + 8MB 45 2700 ‑ 3600 4/8
6835
5429
20682
1.7
7.63
153
699
7.77
160.9
44.3
 37* Intel Core i7-6770HQ 1MB + 6MB 45 2600 ‑ 3500 4/8
 38 Intel Core i7-6700T 1MB + 6MB 45 2800 ‑ 3600 4/8
7253
5605
20201
1.74
7.26
153
669
9.85
165.2
41.9
 39 Intel Core i7-4900MQ 1MB + 8MB 47 2800 ‑ 3800 4/8
7184.56
54705
203135
1.676
7.086
145
641
7.634
1573
38.663
 40* Intel Core i7-4960HQ 1MB + 6MB 47 2600 ‑ 3800 4/8
 41 Intel Core i7-6700HQ 1MB + 6MB 45 2600 ‑ 3500 4/8
709217
540749
2018647
1.6659
7.4560
14461
67662
7.5923
157.622
42.121
Pos       Model                                       L2 Cache + L3 Cache TDP (Watt) MHz - Turbo Cores / Threads 3DMark06 CPU Cinebench R10 32Bit Single Cinebench R10 32Bit Multi Cinebench R11.5 CPU Single 64Bit Cinebench R11.5 64Bit Cinebench R15 CPU Single 64Bit Cinebench R15 CPU Multi 64Bit wPrime 32 x264 Pass 1 x264 Pass 2
 42 Intel Core i7-4810MQ 1MB + 6MB 47 2800 ‑ 3800 4/8
7049
54452
19147.52
1.677
7.027
1487
6477
9.932
146
38.25
 43 Intel Core i7-4870HQ 1MB + 6MB 47 2500 ‑ 3700 4/8
6621.52
53002
19078.52
1.617
6.87
1437
6217
10.56
169.972
39.522
 44 Intel Core i7-3920XM 1MB + 8MB 55 2900 ‑ 3800 4/8
69733
50782
19652.52
1.562
7.115
7.482
156.712
382
 45 Intel Core i7-4800MQ 1MB + 6MB 47 2700 ‑ 3700 4/8
726511
52339
200899
1.6315
7.2116
1429
6639
7.725
160.114
41.54
 46 Intel Core i7-2700K 1MB + 8MB 95 3500 ‑ 3900 4/8
68372
4967
19675
7
7.15
147
37.5
 47* Intel Core i7-4950HQ 1MB + 6MB 47 2400 ‑ 3600 4/8
1.61
7.38
 48* Intel Core i7-4860HQ 1MB + 6MB 47 2400 ‑ 3600 4/8
6.9
 49 Intel Core i7-4720HQ 1MB + 6MB 47 2600 ‑ 3600 4/8
693012
514531
1958031
1.5735
7.0335
13835
64235
7.3313
152.3514
37.814
 50 Intel Core i7-3840QM 1MB + 8MB 45 2800 ‑ 3800 4/8
69982
5144.52
201352
1.592
7.082
7.392
157.792
38.172
 51 Intel Core i7-4850HQ 1MB + 6MB 47 2300 ‑ 3500 4/8
6640
22559
1.48
6.17
133
578
 52 Intel Core i7-4710HQ 1MB + 6MB 47 2500 ‑ 3500 4/8
6980.56
500821
1904421
1.5332
6.9833
13532
64632
7.757
149.912
37.8812
 53 Intel Core i7-4710MQ 1MB + 6MB 47 2500 ‑ 3500 4/8
6830.52
4962.56
18961.56
1.549
6.989
1359
6459
 54 Intel Core i7-4770HQ 1MB + 6MB 47 2200 ‑ 3400 4/8
 55 Intel Core i7-3820QM 1MB + 8MB 45 2700 ‑ 3700 4/8
68494
50083
193643
1.53
6.785
7.462
150.422
37.172
 56 Intel Core i7-2600K 1MB + 8MB 95 3400 ‑ 3800 4/8
666915
4809
18608
1.51
6.76
129
613.52
10.5
145
36.5
 57 Intel Core i7-3740QM 1MB + 6MB 45 2700 ‑ 3700 4/8
68372
4951
19798
1.532
6.962
7.58
153.81
38.64
 59 Intel Core i7-3720QM 1MB + 6MB 45 2600 ‑ 3600 4/8
664213
482110
1887910
1.474
6.7311
7.854
146.76
36.986
 60 Intel Core i7-4700HQ 1MB + 6MB 47 2400 ‑ 3400 4/8
6758.510
489511
1860911
1.526
6.9326
13217
63717
8.094
1413
343
 61 Intel Core i7-4700MQ 1MB + 6MB 47 2400 ‑ 3400 4/8
687229
493425
1901925
1.5138
6.8939
13217
63117
8.3718
14813
38.713
 62 Intel Core i7-4760HQ 1MB + 6MB 47 2100 ‑ 3300 4/8
Pos       Model                                       L2 Cache + L3 Cache TDP (Watt) MHz - Turbo Cores / Threads 3DMark06 CPU Cinebench R10 32Bit Single Cinebench R10 32Bit Multi Cinebench R11.5 CPU Single 64Bit Cinebench R11.5 64Bit Cinebench R15 CPU Single 64Bit Cinebench R15 CPU Multi 64Bit wPrime 32 x264 Pass 1 x264 Pass 2
 63 Intel Core i7-4722HQ 1MB + 6MB 37 2400 ‑ 3400 4/8
 64 Intel Xeon E3-1226 v3 1MB + 8MB 84 3300 ‑ 3700 4/4
5335
18972
145
534
9.8
 65 Intel Core i5-4590 1MB + 6MB 84 3300 ‑ 3700 4/4
5479
18998
1.63
5.92
146
530
 66 Intel Core i7-2960XM 1MB + 8MB 55 2700 ‑ 3700 4/8
6820
4928
18300
6.33
 67 Intel Core i5-3570K 1MB + 6MB 77 3400 ‑ 3800 4/4
6561
5286
18325
1.61
6
9.69
168
33.6
 68 Intel Core i5-6500 1MB + 6MB 65 3200 ‑ 3600 4/4
6653
5746
19577
1.74
6.35
146.52
541.52
10.6
174.5
36.1
 69 Intel Core i7-4712HQ 1MB + 6MB 37 2300 ‑ 3300 4/8
4445
13918
1.432
5.762
121.52
517.52
 70 Intel Core i7-4712MQ 1MB + 6MB 37 2300 ‑ 3300 4/8
4816.54
179294
1.474
6.464
130.54
599.54
8.253
1423
363
 71 Intel Core i7-4750HQ 1MB + 6MB 47 2000 ‑ 3200 4/8
6436
4723
18026
1.42
6.55
123
612
8.72
137.94
35.04
 72 Intel Core i7-3635QM 1MB + 6MB 45 2400 ‑ 3400 4/8
64924
46603
178653
1.394
6.444
8.933
138.042
35.442
 73 Intel Core i7-3630QM 1MB + 6MB 45 2400 ‑ 3400 4/8
639212
46547
180917
1.4110
6.4113
8.425
136.893
35.273
 74 Intel Core i5-3550 1MB + 6MB 77 3300 ‑ 3700 4/4
6405
5191
17762
1.56
5.812
9.98
163.8
32.7
 75 Intel Core i7-4702HQ 1MB + 6MB 37 2200 ‑ 3200 4/8
59502
45853
165843
1.393
6.293
127
501
 76 Intel Core i7-4702MQ 1MB + 6MB 37 2200 ‑ 3200 4/8
62857
465611
1738811
1.4115
6.1915
1249
5759
9.256
130.124
33.664
 77 Intel Core i7-2860QM 1MB + 8MB 45 2500 ‑ 3600 4/8
63232
45762
16809.52
5.882
7.8
131.7
32
 78 Intel Core i7-2920XM 1MB + 8MB 55 2500 ‑ 3500 4/8
61315
4378.54
17187.54
6.015
8.444
131.42
30.82
 79 Intel Core i5-3470 1MB + 6MB 77 3200 ‑ 3600 4/4
6179
5006
17192
1.51
5.57
 80 Intel Core i7-3615QM 1MB + 6MB 45 2300 ‑ 3300 4/8
55743
44362
16980.52
1.343
5.533
8.452
137.5
34.42
 81 Intel Core i7-3610QM 1MB + 6MB 45 2300 ‑ 3300 4/8
607840
442037
1723037
1.3617
6.241
8.7215
134.9412
34.2712
 82 AMD FX-8350 8MB + 8MB 125 4000 ‑ 4200 8/8
6648
3201
16904
1.12
6.892
97
636
8.342
138.752
43.52
Pos       Model                                       L2 Cache + L3 Cache TDP (Watt) MHz - Turbo Cores / Threads 3DMark06 CPU Cinebench R10 32Bit Single Cinebench R10 32Bit Multi Cinebench R11.5 CPU Single 64Bit Cinebench R11.5 64Bit Cinebench R15 CPU Single 64Bit Cinebench R15 CPU Multi 64Bit wPrime 32 x264 Pass 1 x264 Pass 2
 84 Intel Core i5-2500K 1MB + 6MB 95 3300 ‑ 3700 4/4
5853
4773
15956
5.38
122
470
11.67
 85* Intel Core i5-6600T 1MB + 6MB 35 2700 ‑ 3500 4/4
6275.52
5354.52
17622.52
1.572
5.582
1382
464.52
10.062
163.892
33.452
 86* Intel Core i5-6440HQ 1MB + 6MB 45 2600 ‑ 3500 4/4
5600
52233
183023
1.663
5.913
1453
5143
11.692
161
35
 87 Intel Core i5-4460 1MB + 6MB 84 3200 ‑ 3400 4/4
6350
4813
17098
1.52
5.46
136
496
11.47
164.64
33.59
 88 Intel Core i7-3632QM 1MB + 6MB 35 2200 ‑ 3200 4/8
56816
4293.54
161174
1.327
5.827
1133
5213
9.864
125.394
31.894
 89 Intel Core i5-6350HQ 1MB + 6MB 45 2300 ‑ 3200 4/4
 90* Intel Core i5-6300HQ 1MB + 6MB 45 2300 ‑ 3200 4/4
5766
48873
166093
1.473
5.354
1305
465.56
12.062
151.022
31.152
 91 Intel Core i5-4430 1MB + 6MB 84 3000 ‑ 3200 4/4
127
463
 92 Intel Core i7-2760QM 1MB + 6MB 45 2400 ‑ 3500 4/8
6000.54
44744
162114
5.634
8.24
120.4
28
 93* Intel Core i5-6500T 1MB + 6MB 35 2500 ‑ 3100 4/4
5832
4880
16462
1.45
5.36
128
466
11.56
153.49
32.32
 94 Intel Core i5-2400 1MB + 6MB 95 3100 ‑ 3400 4/4
57155
4425
15344
5.094
11.7
137
26.7
 97 Intel Core i7-2820QM 1MB + 8MB 45 2300 ‑ 3400 4/8
5818.510
4249.56
15043.56
5.487
107
 98 Intel Core i7-3612QM 1MB + 6MB 35 2100 ‑ 3100 4/8
546613
4112.514
1567814
1.279
5.6214
9.589
123.764
31.14
 99 Intel Core i7-2720QM 1MB + 6MB 45 2200 ‑ 3300 4/8
56168
41675
148525
5.298
13.123
 100 Intel Core i7-2675QM 1MB + 6MB 45 2200 ‑ 3100 4/8
 101 Intel Core i7-2670QM 1MB + 6MB 45 2200 ‑ 3100 4/8
5400.512
3899.512
14842.512
5.1913
10.563
115.113
26.53
 102* Intel Core i5-6400T 1MB + 6MB 35 2200 ‑ 2800 4/4
5161
4397
14798
1.35
4.82
119
420
12.88
139.2
28.07
 103* Intel Core i7-6567U 512KB + 4MB 28 3300 ‑ 3600 2/4
5506
12475
1.63
4.02
142
364
13.33
128.8
24.1
 104* Intel Core i5-5350H 512KB + 4MB 47 3000 ‑ 3500 2/4
 107 Intel Core i7-2635QM 1MB + 6MB 45 2000 ‑ 2900 4/8
4906
36999
135819
4.689
15
Pos       Model                                       L2 Cache + L3 Cache TDP (Watt) MHz - Turbo Cores / Threads 3DMark06 CPU Cinebench R10 32Bit Single Cinebench R10 32Bit Multi Cinebench R11.5 CPU Single 64Bit Cinebench R11.5 64Bit Cinebench R15 CPU Single 64Bit Cinebench R15 CPU Multi 64Bit wPrime 32 x264 Pass 1 x264 Pass 2
 108 Intel Core i7-2630QM 1MB + 6MB 45 2000 ‑ 2900 4/8
503945
366246
1383347
4.8246
10.119
 110* Intel Core i5-6287U 512KB + 4MB 28 3100 ‑ 3500 2/4
 111* Intel Core i7-5557U 512KB + 4MB 28 3100 ‑ 3400 2/4
4595
 112 Intel Core i7-4610M 512KB + 4MB 37 3000 ‑ 3700 2/4
 114 Intel Core i7-4600M 512KB + 4MB 37 2900 ‑ 3600 2/4
1.5
3.35
132
310
 115 Intel Core i5-4340M 512KB + 3MB 37 2900 ‑ 3600 2/4
 116* Intel Core i5-5287U 512KB + 3MB 28 2900 ‑ 3300 2/4
 117 Intel Core i7-4578U 512KB + 4MB 28 3000 ‑ 3500 2/4
 118 Intel Core i5-4210H 512KB + 3MB 47 2900 ‑ 3500 2/4
4462
50193
110752
1.53
3.653
1293
3303
15.52
104.5
21.15
 121 Intel Core i5-4330M 512KB + 3MB 37 2800 ‑ 3500 2/4
4362
4988
11324
1.51
3.66
18.19
 122 Intel Core i7-3540M 512KB + 4MB 35 3000 ‑ 3700 2/4
4319.52
5029.52
10810.52
1.532
3.452
14.86
105.29
19.92
 123 Intel Core i5-4200H 512KB + 3MB 47 2800 ‑ 3400 2/4
4361
57192
107392
1.464
3.534
129.54
323.54
15.77
103
20.45
 124* Intel Core i5-6267U 512KB + 4MB 28 2900 ‑ 3300 2/4
 125 Intel Core i7-4558U 512KB + 4MB 28 2800 ‑ 3300 2/4
4264
4793
10305
1.45
3.48
16.25
107.19
20.37
 126 Intel Core i5-5257U 512KB + 3MB 28 2700 ‑ 3100 2/4
4190
48253
106743
1.424
3.424
1243
3163
107.31
20.19
 127 Intel Core i5-4308U 512KB + 3MB 28 2800 ‑ 3300 2/4
 128 AMD A10-7850K 4MB 95 3700 ‑ 4000 4/4
4748
3216
10278
1.01
3.59
86
318
13.1
114
24.1
 129 AMD A10-6800K 4MB 100 4100 ‑ 4400 4/4
4885
3428
10077
1.14
3.61
1002
3262
16.1
111
23.3
 131 Intel Core i5-4310M 512KB + 3MB 37 2700 ‑ 3400 2/4
4664
9622
1.482
3.582
128.52
3262
15.61
105
20.7
 132* Intel Core i7-6650U 512KB + 4MB 15 2200 ‑ 3400 2/4
5223
11564
1.51
3.8
132
342
14.87
Pos       Model                                       L2 Cache + L3 Cache TDP (Watt) MHz - Turbo Cores / Threads 3DMark06 CPU Cinebench R10 32Bit Single Cinebench R10 32Bit Multi Cinebench R11.5 CPU Single 64Bit Cinebench R11.5 64Bit Cinebench R15 CPU Single 64Bit Cinebench R15 CPU Multi 64Bit wPrime 32 x264 Pass 1 x264 Pass 2
 133* Intel Core i7-6600U 512KB + 4MB 15 2600 ‑ 3400 2/4
4560
52986
117895
1.616
3.666
135.56
334.56
14.353
114.54
21.54
 134* Intel Core i7-6560U 512KB + 4MB 15 2200 ‑ 3200 2/4
5054
11205
1.52
3.45
132
303
14.56
110
20.34
 135* Intel Core i5-4400E 512KB + 3MB 37 2700 ‑ 3300 2/4
 136 Intel Core i5-4300M 512KB + 3MB 37 2600 ‑ 3300 2/4
4147.52
47213
103883
1.393
3.373
126.52
313.52
 137 Intel Core i7-3520M 512KB + 4MB 35 2900 ‑ 3600 2/4
413410
48559
104679
1.467
3.369
15.437
98.585
18.865
 138* Intel Core i7-6500U 512KB + 4MB 15 2500 ‑ 3100 2/4
42149
488121
1069520
1.4521
3.4422
12525
308.526
15.596
107.555
20.315
 139 Intel Core i7-5600U 512KB + 4MB 15 2600 ‑ 3200 2/4
38273
49448
102638
1.518
3.259
1308
2978
15.535
995
18.344
 140 Intel Core i7-5650U 512KB + 4MB 15 2200 ‑ 3200 2/4
3967
4980
10008
1.47
3.14
112
296
15.85
107.23
18.98
 141* Intel Core i5-6360U 512KB + 4MB 15 2000 ‑ 3100 2/4
 142 Intel Core i5-4210M 512KB + 3MB 37 2600 ‑ 3200 2/4
3981.54
4583.54
10185.54
1.396
3.356
1226
305.56
17.13
95.22
19.33
 143* Intel Core i5-6300U 512KB + 3MB 15 2400 ‑ 3000 2/4
4050
47003
106263
1.414
3.414
122.56
3066
16.062
107.49
20.38
 144 Intel Core i5-4288U 512KB + 3MB 28 2600 ‑ 3100 2/4
 145 Intel Core i5-4278U 512KB + 3MB 28 2600 ‑ 3100 2/4
 146 Intel Core i5-3380M 512KB + 3MB 35 2900 ‑ 3600 2/4
 147 Intel Core i5-3360M 512KB + 3MB 35 2800 ‑ 3500 2/4
3994.510
469210
10140.510
1.48
3.2611
16.299
35.353
6.513
 148 AMD A10-7700K 4MB 95 3400 ‑ 3800 4/4
4500
3004
9821
0.94
3.45
83
285
13.7
110
23.1
 149 AMD A8-7650K 4MB 95 3300 ‑ 3800 4/4
4410
2904
9456
0.96
3.35
84
296
14.2
108
22.7
 150 Intel Core i3-3220  + 3MB 55 3300 2/4
4019
4626
10193
1.38
3.31
14.66
98.55
18.82
 151 Intel Core i5-4200M 512KB + 3MB 37 2500 ‑ 3100 2/4
3882.512
448511
996211
1.3520
3.2420
11817
29717
17.35
94.514
18.844
 152 Intel Core i5-3340M 512KB + 3MB 35 2700 ‑ 3400 2/4
1.39
3.16
Pos       Model                                       L2 Cache + L3 Cache TDP (Watt) MHz - Turbo Cores / Threads 3DMark06 CPU Cinebench R10 32Bit Single Cinebench R10 32Bit Multi Cinebench R11.5 CPU Single 64Bit Cinebench R11.5 64Bit Cinebench R15 CPU Single 64Bit Cinebench R15 CPU Multi 64Bit wPrime 32 x264 Pass 1 x264 Pass 2
 153 Intel Core i7-2640M 512KB + 4MB 35 2800 ‑ 3500 2/4
39278
44439
97789
1.36
3.1510
15.145
89.353
173
 154 Intel Core i7-5500U 512KB + 4MB 15 2400 ‑ 3000 2/4
382611
461533
979132
1.4136
3.1638
12139
28939
16.768
94.67
17.87
 155 Intel Core i7-5550U 512KB + 4MB 15 2000 ‑ 3000 2/4
 156* Intel Core i5-6260U 512KB + 4MB 15 1800 ‑ 2900 2/4
3883
4481
9949
1.33
3.26
117
298
18
105
19.3
 157 Intel Core i5-3320M 512KB + 3MB 35 2600 ‑ 3300 2/4
376713
4415.512
955012
1.3310
3.0613
17.3610
90.946
17.526
 158 Intel Core i5-4258U 512KB + 3MB 28 2400 ‑ 2900 2/4
3865
4571.52
101212
1.242
3.042
109.52
2762
17.8
97.2
18.5
 159 AMD A8-6600K 4MB 100 3900 ‑ 4200 4/4
4701
3230
8040
0.96
3.41
17.9
106
22.2
 160 AMD A10-5800K 4MB 100 3800 ‑ 4200 4/4
44643
3093.52
9275.52
1.032
3.322
15.92
106.62
21.852
 162 Intel Core i5-3230M 512KB + 3MB 35 2600 ‑ 3200 2/4
37608
42689
91599
1.258
2.9710
105
258
17.834
59.964
11.454
 163 AMD A8-5600K 4MB 100 3600 ‑ 3900 4/4
4295
2941
8838
0.98
3.2
87
292
16.7
102.44
20.93
 164 Intel Core i7-2620M 512KB + 4MB 35 2700 ‑ 3400 2/4
382720
433315
943315
3.0620
16.1811
 165 Intel Core i7-4600U 512KB + 4MB 15 2100 ‑ 3300 2/4
322311
4668.512
844412
1.4214
2.6715
12414
24815
17.17
91.75
16.295
 166 Intel Core i7-4650U 512KB + 4MB 15 1700 ‑ 3300 2/4
32493
4714.54
8620.54
1.46
2.656
1232
2562
18.092
89.083
16.013
 167* Intel Core i5-6200U 512KB + 3MB 15 2300 ‑ 2800 2/4
378711
438330
9871.530
1.3231
3.231
11533
28833
179
1009
199
 168* Intel Core i3-6167U 512KB + 3MB 28 2700 2/4
 169 Intel Core i3-6100H 512KB + 3MB 35 2700 2/4
3829
4380
9989
1.3
3.22
108
292
 170 Intel Core i5-5300U 512KB + 3MB 15 2300 ‑ 2900 2/4
36655
442911
931211
1.3512
312
11711
27011
18.134
87.954
16.624
 171 Intel Core i7-3687U 512KB + 4MB 17 2100 ‑ 3300 2/4
 172 Intel Core i5-5350U 512KB + 3MB 15 1800 ‑ 2900 2/4
 173 AMD A8-3850 4MB 100 2900 4/4
40272
2649
9534
3.42
14.2
Pos       Model                                       L2 Cache + L3 Cache TDP (Watt) MHz - Turbo Cores / Threads 3DMark06 CPU Cinebench R10 32Bit Single Cinebench R10 32Bit Multi Cinebench R11.5 CPU Single 64Bit Cinebench R11.5 64Bit Cinebench R15 CPU Single 64Bit Cinebench R15 CPU Multi 64Bit wPrime 32 x264 Pass 1 x264 Pass 2
 174 Intel Core i7-4510U 512KB + 4MB 15 2000 ‑ 3100 2/4
3341.54
44865
89315
1.3510
2.7911
1199
2489
17
88.762
16.392
 175 Intel Core i5-3210M 512KB + 3MB 35 2500 ‑ 3100 2/4
355342
4168.536
893635
1.2536
2.8747
18.5626
86.566
16.46
 180 Intel Core i5-2540M 512KB + 3MB 35 2600 ‑ 3300 2/4
36827
41719
91099
1.28
2.969
17.224
 181 Intel Core i7-3667U 512KB + 4MB 17 2000 ‑ 3200 2/4
3594.54
42152
8809.52
1.324
2.924
17.83
87.012
15.432
 182 Intel Core i7-4500U 512KB + 4MB 15 1800 ‑ 3000 2/4
349419
434323
870023
1.3134
2.7535
11624
26024
19.6113
90.68
16.398
 183 Intel Core i7-4550U 512KB + 4MB 15 1500 ‑ 3000 2/4
3443
4395
8715
1.33
2.78
118
253
90.77
15.91
 185 Intel Core i5-4310U 512KB + 3MB 15 2000 ‑ 3000 2/4
3463
5897
8960
1.285
2.95
1104
2634
19.4
86.8
16.9
 186 Intel Core i5-4360U 512KB + 3MB 15 1500 ‑ 3000 2/4
 187 Intel Core i7-3537U 512KB + 4MB 17 2000 ‑ 3100 2/4
36455
42714
90004
1.275
2.885
104
247
18.423
 188 Intel Pentium G4500T 512KB + 4MB 35 3000 2/2
3583
4828
9206
1.19
2.82
118
245
21.7
91.3
17
 189 Intel Core i5-5200U 512KB + 3MB 15 2200 ‑ 2700 2/4
336715
413447
863644
1.2454
2.8256
10855
25955
18.6910
85.1914
16.1514
 190 Intel Core i5-5250U 512KB + 3MB 15 1600 ‑ 2700 2/4
33932
41042
87212
1.162
2.792
1083
2613
19.5
88.46
16.46
 191 Intel Core i5-4300U 512KB + 3MB 15 1900 ‑ 2900 2/4
32422
40705
86015
1.239
2.779
1087
2537
19.174
80.132
14.92
 192 Intel Core i5-4350U 512KB + 3MB 15 1400 ‑ 2900 2/4
 193 Intel Core i5-2520M 512KB + 3MB 35 2500 ‑ 3200 2/4
3541.516
4040.518
8814.518
2.8619
189
 194 Intel Core i3-5157U 512KB + 3MB 28 2500 2/4
1.16
2.44
98
259
 195 Intel Core i3-4110M 512KB + 3MB 37 2600 2/4
 196 Intel Core i5-2450M 512KB + 3MB 35 2500 ‑ 3100 2/4
3441.512
3918.512
854213
1.24
2.7613
19.046
78.632
14.612
 197 Intel Core i7-3517U 512KB + 4MB 17 1900 ‑ 3000 2/4
343013
4024.510
8596.510
1.2212
2.7814
18.89
82.994
15.914
 200 Intel Core i3-4100M 512KB + 3MB 37 2500 2/4
Pos       Model                                       L2 Cache + L3 Cache TDP (Watt) MHz - Turbo Cores / Threads 3DMark06 CPU Cinebench R10 32Bit Single Cinebench R10 32Bit Multi Cinebench R11.5 CPU Single 64Bit Cinebench R11.5 64Bit Cinebench R15 CPU Single 64Bit Cinebench R15 CPU Multi 64Bit wPrime 32 x264 Pass 1 x264 Pass 2
 202 Intel Core i5-2435M 512KB + 3MB 35 2400 ‑ 3000 2/4
 203 Intel Core i5-2430M 512KB + 3MB 35 2400 ‑ 3000 2/4
3310.58
37877
82227
2.6611
18.892
76.5
14.71
 204 Intel Core i3-4000M 512KB + 3MB 37 2400 2/4
3098
35813
80423
1.067
2.67
955
2405
203
79.12
15.152
 205 Intel Core i3-4100E 512KB + 3MB 37 2400 2/4
 206 Intel Core i3-3130M 512KB + 3MB 35 2600 2/4
 207 Intel Core i5-2415M 512KB + 3MB 35 2300 ‑ 2900 2/4
2887
3666
7444
2.42
19
 208 Intel Core i5-2410M 512KB + 3MB 35 2300 ‑ 2900 2/4
321973
366375
7962.576
2.5875
19.140
76.3
14.3
 209 Intel Core i5-3437U 512KB + 3MB 17 1900 ‑ 2900 2/4
33984
39723
82693
1.195
2.685
1012
2242
20.413
80.453
15.193
 212 Intel Core i5-4210U 512KB + 3MB 15 1700 ‑ 2700 2/4
320014
384322
779921
1.1634
2.5535
10236
23737
21.2313
79.7512
15.1512
 213 Intel Core i5-4260U 512KB + 3MB 15 1400 ‑ 2700 2/4
3222
3951
7913
1.2
2.63
105
239
 214 Intel Core i3-3120M 512KB + 3MB 35 2500 2/4
30573
34282
68672
0.963
2.453
22.022
 215 Intel Core i5-3427U 512KB + 3MB 17 1800 ‑ 2800 2/4
3179.58
3722.56
79006
1.138
2.519
19.856
80.662
14.912
 216* Intel Core i5-4402E 512KB + 3MB 25 1600 ‑ 2700 2/4
 217 Intel Pentium G860 256KB + 3MB 65 3000 2/2
3065
3964
7695
1.2
2.34
23.6
70.31
12.69
 219 Intel Core i5-4200U 512KB + 3MB 15 1600 ‑ 2600 2/4
305336
372537
763636
1.1255
2.4858
9933
22934
22.7224
77.4915
14.5415
 220 Intel Core i5-4250U 512KB + 3MB 15 1300 ‑ 2600 2/4
30242
3679.52
7692.52
1.122
2.472
21.872
77.81
14.57
 221* Intel Core i3-6100U 512KB + 3MB 15 2300 2/4
3241.52
3714
8413
1.1
2.75
97
247
20.93
83.5
15.97
 222 Intel Core i3-5020U 512KB + 3MB 15 2200 2/4
 223* AMD FX-8800P 2MB 12 2100 ‑ 3400 4/4
4227
26042
78602
0.963
3.363
823
2773
12.02
93.47
21.07
 224* AMD Pro A12-8800B 2MB 12 2100 ‑ 3400 4/4
27693
22362
6219.52
0.912
2.522
723
2063
16.492
75.852
15.852
Pos       Model                                       L2 Cache + L3 Cache TDP (Watt) MHz - Turbo Cores / Threads 3DMark06 CPU Cinebench R10 32Bit Single Cinebench R10 32Bit Multi Cinebench R11.5 CPU Single 64Bit Cinebench R11.5 64Bit Cinebench R15 CPU Single 64Bit Cinebench R15 CPU Multi 64Bit wPrime 32 x264 Pass 1 x264 Pass 2
 225* Intel Core m7-6Y75 512KB + 4MB 5 1200 ‑ 3100 2/4
26823
39404
62464
0.994
2.174
984
186.54
61.31
11.32
 226 Intel Core i3-3110M 512KB + 3MB 35 2400 2/4
29887
33467
73537
0.988
2.3811
81.52
2092
22.075
 229 AMD FX-7600P 4MB 35 2700 ‑ 3600 4/4
35693
25553
74183
0.854
2.464
753
2283
16.42
81.52
17.62
 230* Intel Pentium 4405U 512KB + 2MB 15 2100 2/4
 232* Intel Core i7-2649M 512KB + 4MB 25 2300 ‑ 3200 2/4
 235 Intel Core i3-5010U 512KB + 3MB 15 2100 2/4
2828.52
3114
7222
0.952
2.43
853
2193
23.23
73.93
13.63
 236 Intel Core i3-5015U 512KB + 3MB 15 2100 2/4
2866
3272
6975
0.97
2.34
85
214
23.45
68.9
13.4
 237 Intel Core i3-2370M 512KB + 3MB 35 2400 2/4
2869.56
31356
70646
0.954
2.296
22.535
 239 Intel Core i3-5005U 512KB + 3MB 15 2000 2/4
2713
31163
68973
0.963
2.273
823
2083
24.41
69.7
12.96
 240* Intel Core i3-2350M 512KB + 3MB 35 2300 2/4
27559
3026.58
6789.58
0.912
2.28
23.845
 241 Intel Core i3-2348M 512KB + 3MB 35 2300 2/4
2829
0.9
2.18
 243 Intel Core i5-3337U 512KB + 3MB 17 1800 ‑ 2700 2/4
314519
365917
767817
1.0921
2.4821
953
2223
22.2414
76.558
14.168
 244* Intel Core m5-6Y57 512KB + 4MB 5 1100 ‑ 2800 2/4
3551
5809
0.99
1.81
89
159
 245* Intel Core m5-6Y54 512KB + 4MB 5 1100 ‑ 2700 2/4
29352
3962.52
7535.52
1.162
2.392
1052
227.52
67.5
12.3
 246 AMD A10-8700P 2MB 12 1800 ‑ 3200 4/4
2977.56
23344
64234
0.865
2.345
695
1945
17.47
74.413
15.233
 247 AMD Pro A10-8700B 2MB 12 1800 ‑ 3200 4/4
 251 Intel Core i7-4610Y 512KB + 4MB 12 1700 ‑ 2900 2/4
2735
4140
6762
1.24
2.15
107
192
19.65
72.53
12.38
 254* Intel Core i7-2629M 512KB + 4MB 25 2100 ‑ 3000 2/4
 257 Intel Core i7-2677M 512KB + 4MB 17 1800 ‑ 2900 2/4
2729
3614
6672
2.13
19.6
 258* AMD A10-7400P 4MB 35 2500 ‑ 3400 4/4
Pos       Model                                       L2 Cache + L3 Cache TDP (Watt) MHz - Turbo Cores / Threads 3DMark06 CPU Cinebench R10 32Bit Single Cinebench R10 32Bit Multi Cinebench R11.5 CPU Single 64Bit Cinebench R11.5 64Bit Cinebench R15 CPU Single 64Bit Cinebench R15 CPU Multi 64Bit wPrime 32 x264 Pass 1 x264 Pass 2
 259 Intel Pentium 3560M 512KB + 2MB 37 2400 2/2
 260 Intel Core i3-2330M 512KB + 3MB 35 2200 2/4
262710
28888
6465.58
2.129
25.115
 261 Intel Core i3-2328M 512KB + 3MB 35 2200 2/4
26977
28807
64757
0.885
2.17
25.166
62.16
11.76
 262 Intel Pentium 2030M 512KB + 2MB 35 2500 2/2
 263* Intel Pentium 3550M 512KB + 2MB 37 2300 2/2
 268 Intel Core i5-3317U 512KB + 3MB 17 1700 ‑ 2600 2/4
2984.552
3487.544
733744
1.0548
2.3855
22.3935
73.6714
13.6914
 269* AMD A8-8600P 2MB 12 1600 ‑ 3000 4/4
 270* AMD Pro A8-8600B 2MB 12 1600 ‑ 3000 4/4
 271* AMD A8-7200P 4MB 35 2400 ‑ 3300 4/4
 276 AMD A10-5750M 4MB 35 2500 ‑ 3500 4/4
32385
25795
64515
0.855
2.315
754
207.54
22.52
763
153
 277 AMD A10-5757M 4MB 35 2500 ‑ 3500 4/4
2986
2182
3774
0.882
2.232
28.7
39.24
7.64
 278 Intel Core i7-2637M 512KB + 4MB 17 1700 ‑ 2800 2/4
28343
36003
70743
1.09
2.233
93
201
21.73
69.53
12.13
 281 Intel Core i7-2657M 512KB + 4MB 17 1600 ‑ 2700 2/4
2546
3491
6229
1.91
 282* Intel Core i7-3689Y 512KB + 4MB 13 1500 ‑ 2600 2/4
 283 Intel Pentium 2020M 512KB + 2MB 35 2400 2/2
24495
32995
63125
0.985
1.925
31.534
61.29
11
 285 Intel Pentium 3825U 512KB + 2MB 15 1900 2/4
2594
2951
6537
0.9
2.13
77
190
25.41
62.5
11.95
 286 Intel Core i3-4158U 512KB + 3MB 28 2000 2/4
2690.52
2974
6393
0.89
2.16
77
194
26.77
67.5
12.7
 287* Intel Core i3-4120U 512KB + 3MB 15 2000 2/4
 289 Intel Celeron 2970M 512KB + 2MB 37 2200 2/2
2489
3222
6248
0.96
1.88
85
164
33.5
62.5
11.7
 290 Intel Core i5-4300Y 512KB + 3MB 12 1600 ‑ 2300 2/4
1871
2982
4663
0.82
1.45
77
133
28.6
49.5
8.37
Pos       Model                                       L2 Cache + L3 Cache TDP (Watt) MHz - Turbo Cores / Threads 3DMark06 CPU Cinebench R10 32Bit Single Cinebench R10 32Bit Multi Cinebench R11.5 CPU Single 64Bit Cinebench R11.5 64Bit Cinebench R15 CPU Single 64Bit Cinebench R15 CPU Multi 64Bit wPrime 32 x264 Pass 1 x264 Pass 2
 291* Intel Core i5-4302Y 512KB + 3MB 12 1600 ‑ 2300 2/4
3310
6448
0.95
1.98
65
185
 292 Intel Pentium B980 512KB + 2MB 35 2400 2/2
2462.54
31094
5878.54
0.944
1.834
32.934
55
10.01
 293 Intel Core i3-4030U 512KB + 3MB 15 1900 2/4
2519.52
2810.52
6265.52
0.85
2.035
705
1915
27.333
64.83
12.13
 294 Intel Core i3-4025U 512KB + 3MB 15 1900 2/4
 295 Intel Core M-5Y71 512KB + 4MB 5 1200 ‑ 2900 2/4
25033
37784
65184
1.144
2.094
964
1874
17.81
85.133
11.473
 296 AMD A10-4600M 4MB 35 2300 ‑ 3200 4/4
2865.58
20787
56967
0.77
2.019
62.52
1872
26.495
57.544
13.14
 297 AMD A10-4657M 4MB 35 2300 ‑ 3200 4/4
 298 Intel Core i3-2312M 512KB + 3MB 35 2100 2/4
 299 Intel Core i3-2310M 512KB + 3MB 35 2100 2/4
251729
276230
6190.530
0.84
2.0126
25.823
 300 Intel Core i3-2308M 512KB + 3MB 35 2100 2/4
 301 Intel Core i5-2557M 512KB + 3MB 17 1700 ‑ 2700 2/4
27502
34192
6533.52
2.222
23.662
 302* AMD A10-5745M 4MB 25 2100 ‑ 2900 4/4
27453
20652
54802
0.692
1.922
63.52
1772
34.97
62.1
12.7
 303 AMD A8-5550M 4MB 35 2100 ‑ 3100 4/4
27953
23213
58443
0.783
2.053
68
188
26.023
70.592
13.492
 304 AMD A8-5557M 4MB 35 2100 ‑ 3100 4/4
2747
2115
5259
0.78
1.91
26.82
62.5
12.4
 305 Intel Core M-5Y51 512KB + 4MB 5 1100 ‑ 2600 2/4
21272
31903
52913
0.963
1.653
843
1523
25.94
54.872
9.192
 306 Intel Core M-5Y70 512KB + 4MB 5 1100 ‑ 2600 2/4
2386
3853
6773
1.12
2.093
90.52
1812
19.35
91.38
11.61
 307* Intel Core m3-6Y30 512KB + 4MB 5 900 ‑ 2200 2/4
2693
3286
6994
0.92
2.032
802
2032
24.62
74.862
13.732
 308 AMD FX-7500 4MB 19 2100 ‑ 3300 4/4
2770.52
20602
54822
0.652
1.722
552
1532
23.32
68.5
13.9
 309 AMD A10 Pro-7350B 4MB 19 2100 ‑ 3300 4/4
25252
2003.52
5275.52
0.683
1.833
553
1623
23.29
68.132
12.082
 310 Intel Celeron 1020E 512KB + 2MB 35 2200 2/2
Pos       Model                                       L2 Cache + L3 Cache TDP (Watt) MHz - Turbo Cores / Threads 3DMark06 CPU Cinebench R10 32Bit Single Cinebench R10 32Bit Multi Cinebench R11.5 CPU Single 64Bit Cinebench R11.5 64Bit Cinebench R15 CPU Single 64Bit Cinebench R15 CPU Multi 64Bit wPrime 32 x264 Pass 1 x264 Pass 2
 311 Intel Core M-5Y31 512KB + 4MB 5 900 ‑ 2400 2/4
2589
3395.52
65632
1.094
2.24
984
2084
71.98
9.52
 312 Intel Core M-5Y10c 512KB + 4MB 5 800 ‑ 2000 2/4
27262
3804
0.913
1.783
662
1643
 313 Intel Core M-5Y10a 512KB + 4MB 5 800 ‑ 2000 2/4
3131
0.94
2.01
83
190
 315 Intel Core M-5Y10 512KB + 4MB 5 800 ‑ 2000 2/4
19873
31025
52175
0.955
1.715
815
1555
30.922
55.62
9.62
 317* Intel Core i7-2617M 512KB + 4MB 17 1500 ‑ 2600 2/4
2762
3315
6690
2.11
24.09
 318* Intel Core i5-3439Y 512KB + 3MB 13 1500 ‑ 2300 2/4
 319 Intel Core i5-4202Y 512KB + 3MB 12 1600 ‑ 2000 2/4
2071.52
2920
5686
0.873
1.843
743
1693
32.96
59.46
10.95
 320 Intel Core i5-4220Y 512KB + 3MB 12 1600 ‑ 2000 2/4
 323* Intel Core i3-4100U 512KB + 3MB 15 1800 2/4
 324 Intel Core i3-3227U 512KB + 3MB 17 1900 2/4
24132
2570.52
5805.52
0.742
1.852
29.062
59.572
10.852
 325 AMD A6-6400K 4MB 65 3900 ‑ 4100 2/2
2654
3067.52
50792
0.83
1.66
88
149
56.9
11.2
 326 Intel Core i5-4210Y 512KB + 3MB 12 1500 ‑ 1900 2/4
20392
2764
5399
0.834
1.584
72.54
1474
31.412
56.08
9.88
 327 Intel Core i5-2467M 512KB + 3MB 17 1600 ‑ 2300 2/4
241411
284811
592111
1.9212
27.157
 328 Intel Core i5-3339Y 512KB + 3MB 13 1500 ‑ 2000 2/4
24402
2676
5516
0.843
1.813
71
163
29.8
19.29
3.55
 329 Intel Core i3-4010U 512KB + 3MB 15 1700 2/4
2279.52
24695
55845
0.769
1.839
676
170.58
32.6
 330 Intel Core i3-4005U 512KB + 3MB 15 1700 2/4
2211
25143
57063
0.763
1.853
683
1723
29.22
57.642
10.942
 331 Intel Core i3-3217U 512KB + 3MB 17 1800 2/4
222911
2476.510
5393.510
0.7512
1.7813
63.52
1522
30.7610
56.26
10.256
 332* Apple A9X 2260 2/2
 333 AMD A10-7300 4MB 19 1900 ‑ 3200 4/4
2518
19923
51923
0.673
1.83
583
1583
23.792
62.052
11.932
 334 AMD A8 Pro-7150B 4MB 19 1900 ‑ 3200 4/4
Pos       Model                                       L2 Cache + L3 Cache TDP (Watt) MHz - Turbo Cores / Threads 3DMark06 CPU Cinebench R10 32Bit Single Cinebench R10 32Bit Multi Cinebench R11.5 CPU Single 64Bit Cinebench R11.5 64Bit Cinebench R15 CPU Single 64Bit Cinebench R15 CPU Multi 64Bit wPrime 32 x264 Pass 1 x264 Pass 2
 335* Intel Pentium 4405Y 512KB + 2MB 6 1500 2/4
 341* Intel Core i5-4200Y 512KB + 3MB 12 1400 ‑ 1900 2/4
 342 Intel Pentium B970 512KB + 2MB 35 2300 2/2
23283
29543
56973
0.84
1.753
35.773
 343* Intel Celeron 3765U 512KB + 2MB 15 1900 2/2
 344* Intel Celeron 2950M 512KB + 2MB 37 2000 2/2
 345 AMD A8-7410 2MB 12 2200 ‑ 2500 4/4
29362
2818
4665
0.6
1.57
522
1742
27
45.52
9.69
 346 AMD A8-7100 4MB 19 1800 ‑ 3000 4/4
2225
13792
41342
0.552
1.762
442
1332
33.232
55.952
11.052
 347 Intel Core i3-4102E 512KB + 3MB 25 1600 2/4
 348* Intel Core i3-4030Y 512KB + 3MB 12 1600 2/4
 349* Samsung Exynos 8890 Octa 2600 8/8
 350 HiSilicon Kirin 955 2500 8/8
 351* AMD A8-3550MX 4MB 45 2000 ‑ 2700 4/4
 353 AMD A4-5300 2MB 65 3400 ‑ 3600 2/2
2284
2734
4345
0.91
1.45
67
107
35.5
50
9.62
 356 Intel Celeron 1020M 512KB + 2MB 35 2100 2/2
 358 Intel Pentium B960 512KB + 2MB 35 2200 2/2
22316
28515
55005
0.86
1.686
33.484
51.7
9.24
 359* Intel Pentium 3805U 512KB + 2MB 15 1900 2/2
1.77
 364 Intel Core i3-4020Y 512KB + 3MB 12 1500 2/4
16212
4749.52
0.652
1.592
60
152
35.31
52.2
9.6
 365 Intel Core i3-4012Y 512KB + 3MB 12 1500 2/4
1375
21733
49673
0.673
1.383
603
1503
41.53
35.66
6.13
 368 AMD A8-6410 2MB 15 2000 ‑ 2400 4/4
28662
1886.54
5871.54
0.65
2.045
495
1655
24.3
54.4
11.8
 369* AMD A6-7310 2MB 12  ‑ 2400 4/4
1840
5776
0.57
1.9
45
159
Pos       Model                                       L2 Cache + L3 Cache TDP (Watt) MHz - Turbo Cores / Threads 3DMark06 CPU Cinebench R10 32Bit Single Cinebench R10 32Bit Multi Cinebench R11.5 CPU Single 64Bit Cinebench R11.5 64Bit Cinebench R15 CPU Single 64Bit Cinebench R15 CPU Multi 64Bit wPrime 32 x264 Pass 1 x264 Pass 2
 370 AMD A6-6310 2MB 15 1800 ‑ 2400 4/4
2730
18295
56125
0.576
1.946
476
1576
26.64
52.2
11.1
 371* Intel Celeron 3755U 512KB + 2MB 15 1700 2/2
 372* Intel Celeron 3215U 512KB + 2MB 15 1700 2/2
 377 Intel Pentium B950 512KB + 2MB 35 2100 2/2
21453
27303
52553
1.632
34.33
50
8.9
 381* AMD A8-3530MX 4MB 45 1900 ‑ 2600 4/4
 383* Intel Core i5-2537M 512KB + 3MB 17 1400 ‑ 2300 2/4
24003
28142
59033
0.9
1.672
24.92
 389* AMD A8-3510MX 4MB 45 1800 ‑ 2500 4/4
6158
 390 Intel Pentium 2127U 512KB + 2MB 17 1900 2/2
2027
2625
5016
0.79
1.51
39.64
49.15
8.85
 391 Intel Pentium B940 512KB + 2MB 35 2000 2/2
20342
2609.52
5066.52
1.562
 392 Intel Celeron 1005M 512KB + 2MB 35 1900 2/2
 393 HiSilicon Kirin 950 2300 8/8
 394* AMD A4-7210 2MB 12  ‑ 2200 4/4
2681
1732
5593
0.56
1.95
46
157
26.94
51.3
10.9
 395* AMD A6-3430MX 4MB 45 1700 ‑ 2400 4/4
 396 Intel Pentium 3558U 512KB + 2MB 15 1700 2/2
1926
2510
4852
0.74
1.45
67
129
46.24
48.9
9.08
 397 Intel Pentium 3556U 512KB + 2MB 15 1700 2/2
1939
2515
4854
0.752
1.432
65.52
125.52
46.23
49.2
9.1
 398 Intel Pentium 2117U 512KB + 2MB 17 1800 2/2
1884.54
2364.54
44254
0.745
1.395
58
120
40.422
 399 Intel Celeron 1000M 512KB + 2MB 35 1800 2/2
1923
2480
4757
0.74
1.46
41.63
47.23
8.49
 400 Intel Celeron 1037U 512KB + 2MB 17 1800 2/2
1903
2500
4824
0.75
1.47
41.48
46.82
8.5
 401* Intel Celeron 2981U 512KB + 2MB 15 1600 2/2
 402* Intel Celeron 2980U 512KB + 2MB 15 1600 2/2
Pos       Model                                       L2 Cache + L3 Cache TDP (Watt) MHz - Turbo Cores / Threads 3DMark06 CPU Cinebench R10 32Bit Single Cinebench R10 32Bit Multi Cinebench R11.5 CPU Single 64Bit Cinebench R11.5 64Bit Cinebench R15 CPU Single 64Bit Cinebench R15 CPU Multi 64Bit wPrime 32 x264 Pass 1 x264 Pass 2
 406* AMD A8-3520M 4MB 35 1600 ‑ 2500 4/4
24833
17572
56762
0.51
2.013
22.432
 407 AMD A10-4655M 4MB 25 2000 ‑ 2800 4/4
2160.52
1137
4530
0.52
1.65
40
 408 AMD A8-4500M 4MB 35 1900 ‑ 2800 4/4
24388
1820.56
48726
0.714
1.716
31.455
58.39
10.84
 409 AMD A8-4557M 4MB 35 1900 ‑ 2800 4/4
 412* AMD A6-3410MX 4MB 45 1600 ‑ 2300 4/4
24146
17075
55685
2.025
22.154
 413* AMD A8-3500M 4MB 35 1500 ‑ 2400 4/4
2255.54
15866
51706
1.885
24.092
 414* AMD A6-3420M 4MB 35 1500 ‑ 2400 4/4
23054
16733
53993
1.953
23.632
59.68
11.27
 420* AMD A8-5545M 4MB 19 1700 ‑ 2700 4/4
 421* AMD A6-3400M 4MB 35 1400 ‑ 2300 4/4
21358
15129
49229
1.784
267
 444 AMD A8-4555M 4MB 19 1600 ‑ 2400 4/4
1876.54
15553
37573
0.444
1.234
40.213
20.92
4.212
 450 Intel Celeron B840  + 2MB 35 1900 2/2
 453 AMD A6-5350M 1MB 35 2900 ‑ 3500 2/2
16493
2480.54
39564
0.754
1.244
63.52
117.52
40.862
43.382
8.232
 454 AMD A6-5357M 1MB 35 2900 ‑ 3500 2/2
 455 Intel Pentium N3540 2MB 8 2160 ‑ 2660 4/4
13795
47545
0.55
1.95
425
1575
21.92
54.34
11.12
 456 AMD A6-5200 2MB 25 2000 4/4
2659.52
15983
56003
0.524
1.94
423
1553
26.12
51.7
11.4
 461 Intel Celeron B830  + 2MB 35 1800 2/2
 468* AMD A4-3330MX 2MB 45 2200 ‑ 2600 2/2
 469 AMD A4-5150M 1MB 35 2700 ‑ 3300 2/2
1881
2446
3589
0.7
1.18
54
105
43
42
8
 470 AMD A6-4400M 1MB 35 2700 ‑ 3200 2
18044
22925
34075
0.8
1.134
46.824
38.79
7.59
 471* Intel Pentium J2900 2MB 10 2410 ‑ 2667 4/4
Pos       Model                                       L2 Cache + L3 Cache TDP (Watt) MHz - Turbo Cores / Threads 3DMark06 CPU Cinebench R10 32Bit Single Cinebench R10 32Bit Multi Cinebench R11.5 CPU Single 64Bit Cinebench R11.5 64Bit Cinebench R15 CPU Single 64Bit Cinebench R15 CPU Multi 64Bit wPrime 32 x264 Pass 1 x264 Pass 2
 472 AMD A4-4300M 1MB 35 2500 ‑ 3000 2
16842
1996.52
31442
0.68
1.042
60
93
50.38
36
7.08
 473 Samsung Exynos 7420 Octa 2100 8/8
 474 Qualcomm Snapdragon 820 MSM8996 1.5MB 2200 4/4
 475 Intel Pentium N3530 2MB 8 2160 ‑ 2580 4/4
1312.54
44504
0.475
1.825
394
130.54
23.6
53.76
10.86
 476 Intel Celeron 1017U 512KB + 2MB 17 1600 2/2
1719
2201
4155
0.61
1.3
46.39
41.9
7.57
 477* Intel Celeron 3205U 512KB + 2MB 15 1500 2/2
 478 Intel Celeron B820 512KB + 2MB 35 1700 2/2
 479 Intel Pentium N3700 2MB 6 1600 ‑ 2400 4/4
1934
11772
3732.52
0.432
1.662
37.52
1382
23.09
49.74
10.04
 482* Intel Pentium J2850 2MB 10 2400 4/4
 483 Intel Pentium N3520 2MB 8 2167 ‑ 2420 4/4
23202
12522
4327.52
0.444
1.764
383
1443
282
50.932
10.162
 484* Intel Celeron J1900 2MB 10 2000 ‑ 2420 4/4
 485* Apple A9 1800 2/2
 486 Intel Atom x7-Z8700 2MB 1600 ‑ 2400 4/4
11142
31162
0.412
1.262
37.52
1162
24.51
50.82
10.28
 487 Intel Core i3-4010Y 512KB + 3MB 12 1300 2/4
 488* AMD E2-7110 2MB 12 1800 4/4
2407
1429
4974
0.45
1.78
37
140
29.2
46.45
10.8
 489 AMD A4-6210 2MB 15 1800 4/4
2398
1373.52
4284.52
0.462
1.752
37.52
134.52
34.05
46.74
9.99
 490* AMD A6-8500P 1MB 15 1600 ‑ 3000 2/2
 491* AMD Pro A6-8500B 1MB 15 1600 ‑ 3000 2/2
 492 Qualcomm Snapdragon 810 MSM8994 2000 8/8
 493* Qualcomm Snapdragon 652 MSM8976 1800 8/8
Pos       Model                                       L2 Cache + L3 Cache TDP (Watt) MHz - Turbo Cores / Threads 3DMark06 CPU Cinebench R10 32Bit Single Cinebench R10 32Bit Multi Cinebench R11.5 CPU Single 64Bit Cinebench R11.5 64Bit Cinebench R15 CPU Single 64Bit Cinebench R15 CPU Multi 64Bit wPrime 32 x264 Pass 1 x264 Pass 2
 494 Qualcomm Snapdragon 808 MSM8992 2000 6/6
 495* Qualcomm Snapdragon 650 MSM8956 1800 6/6
 496 Intel Atom Z3795 2MB 0 1590 ‑ 2390 4/4
2145.52
12343
37152
0.442
1.632
36.52
132.52
27.162
42.142
8.312
 497 Intel Atom Z3785 2MB 0 1490 ‑ 2410 4/4
 498 Intel Atom Z3775 2MB 0 1460 ‑ 2390 4/4
2195
11443
40143
0.4
1.49
25.472
47
9.5
 499 Intel Atom Z3775D 2MB 0 1490 ‑ 2410 4/4
 500 Intel Atom Z3770 2MB 0 1460 ‑ 2400 4/4
22122
11895
39616
26.554
40.493
7.653
 501 Intel Atom Z3770D 2MB 0 1500 ‑ 2410 4/4
 502 Intel Atom x5-Z8500 2MB 1440 ‑ 2240 4/4
19913
11662
35633
0.433
1.423
35.54
106.54
36.572
7.222
 503 Intel Celeron N2940 2MB 8 1830 ‑ 2250 4/4
2191
1150
3958
0.422
1.62
35.52
110.52
29.2
46.92
9.36
 504 Intel Celeron 2957U 512KB + 2MB 15 1400 2/2
2077
4043
0.62
1.2
55
105
53.49
41.27
7.57
 505 Intel Celeron 2955U 512KB + 2MB 15 1400 2/2
1520
2069
4000
0.61
1.14
53.18
40.7
7.52
 506 Intel Celeron 1007U 512KB + 2MB 17 1500 2/2
1610
0.63
1.212
 507 Intel Celeron N3150 2MB 6 1600 ‑ 2080 4/4
2053
1085
3624
0.41
1.46
32
118
30.11
44.8
8.96
 508 Intel Celeron N2930 2MB 8 1830 ‑ 2160 4/4
2214
1131.54
38804
0.415
1.575
355
1295
27.25
46.95
9.3
 510* Intel Celeron J1850 2MB 10 2000 4/4
 511 Intel Pentium N3510 2MB 8 2000 4/4
2003.52
10402
3669.52
0.384
1.484
333
1233
30
 513 Intel Celeron B815  + 2MB 35 1600 2/2
1645
2093
4029
44.3
 514 Intel Celeron B810  + 2MB 35 1600 2/2
16333
20913
40793
1.242
44.752
 518 Intel Celeron N2920 2MB 8 1860 ‑ 2000 4/4
1860.52
10302
35302
0.382
1.432
32.52
118.52
31.99
42.07
8.36
Pos       Model                                       L2 Cache + L3 Cache TDP (Watt) MHz - Turbo Cores / Threads 3DMark06 CPU Cinebench R10 32Bit Single Cinebench R10 32Bit Multi Cinebench R11.5 CPU Single 64Bit Cinebench R11.5 64Bit Cinebench R15 CPU Single 64Bit Cinebench R15 CPU Multi 64Bit wPrime 32 x264 Pass 1 x264 Pass 2
 525 Intel Core i3-3229Y 512KB + 3MB 13 1400 2/4
15562
1869.52
3739.52
0.52
1.232
41.192
42.99
7.91
 538 Intel Core i3-2377M 512KB + 3MB 17 1500 2/4
1808
1850
4248
0.56
1.44
35.99
 539 Intel Core i3-2375M 512KB + 3MB 17 1500 2/4
1978
4432
0.56
1.43
37.11
43.9
7.98
 543 Intel Core i3-2367M 512KB + 3MB 17 1400 2/4
16898
1826.56
4107.56
0.556
1.349
39.193
40.452
7.422
 544 Intel Core i3-2365M 512KB + 3MB 17 1400 2/4
1659
1826
4044
0.56
1.34
36.7
 545* Nvidia Tegra X1 2.5MB 8/8
 546 AMD A4-5100 2MB 15 1550 4/4
 547 AMD A4-5050 2MB 14 1550 4/4
 549 AMD A4-5000 2MB 15 1500 4/4
2038.58
1206.512
416512
0.3911
1.4812
337
1197
38.25
41.312
8.722
 550* AMD E2-6110 2MB 15 1500 4/4
 551* Intel Atom E3845 2MB 10 1910 4/4
 554 Apple A8X 2MB + 4MB 1500 3/3
 555 Nvidia Tegra K1 (Denver) 2MB 2300 2/2
 556 Mediatek MT8173 2400 4/4
 559* AMD A10 Micro-6700T 2MB 5 1200 ‑ 2200 4/4
0.55
1.49
 560* AMD A4-3310MX 2MB 45 2100 ‑ 2500 2/2
1.22
41.5
 561* AMD A4-3320M 2MB 35 2000 ‑ 2600 2/2
 562 Mediatek MT6595 Turbo 2MB 2500 8/8
 563 Samsung Exynos 5433 Octa 1900 8/8
 564 Apple A8 1MB + 4MB 1400 2/2
Pos       Model                                       L2 Cache + L3 Cache TDP (Watt) MHz - Turbo Cores / Threads 3DMark06 CPU Cinebench R10 32Bit Single Cinebench R10 32Bit Multi Cinebench R11.5 CPU Single 64Bit Cinebench R11.5 64Bit Cinebench R15 CPU Single 64Bit Cinebench R15 CPU Multi 64Bit wPrime 32 x264 Pass 1 x264 Pass 2
 565 Nvidia Tegra K1 2MB 2300 4/4
 566 Qualcomm Snapdragon 805 APQ8084 2MB 2700 4/4
 567* Intel Atom Z3580 2MB 2330 4/4
 568 Intel Atom Z3736F 2MB 0 1330 ‑ 2160 4/4
9623
28673
38.012
35.6
6.77
 569 Intel Atom Z3736G 2MB 0 1330 ‑ 2160 4/4
 570* Intel Atom x5-Z8300 2MB 1440 ‑ 1840 4/4
16913
9483
29343
0.35
1.17
292
96.52
36.4
35.72
6.982
 575 Intel Pentium 997 512KB + 2MB 17 1600 2/2
 576 Intel Atom Z3745 2MB 0 1330 ‑ 1860 4/4
9413
32293
 577 Intel Atom Z3745D 2MB 0 1330 ‑ 1830 4/4
972
3389
38.09
7.26
 578 Intel Atom Z3740 2MB 0 1330 ‑ 1860 4/4
18383
9635
33805
29
 579 Intel Atom Z3740D 2MB 0 1330 ‑ 1830 4/4
1827
9634
3222.54
31.92
31.85
7.8
 580 Intel Atom Z3735D 2MB 0 1330 ‑ 1830 4/4
8512
27262
37.16
35.1
6.78
 581 Intel Atom Z3735E 2MB 0 1330 ‑ 1830 4/4
 582 Intel Atom Z3735F 2MB 0 1330 ‑ 1830 4/4
11642
94516
2885.516
0.312
0.972
35.663
35.93
6.833
 583 Intel Atom Z3735G 2MB 0 1330 ‑ 1830 4/4
1526
9467
28917
37.53
31.8
6.55
 585 Intel Celeron 1047UE 512KB + 2MB 17 1400 2/2
 586 AMD E2-3800 2MB 15 1300 4/4
2295
3575
0.32
1.28
28
103
42.64
35.8
7.5
 587* AMD E2-3000M 1MB 35 1800 ‑ 2400 2/2
1597
3014
 589 Intel Pentium 987 512KB + 2MB 17 1500 2/2
1487
0.59
1.13
48
 590 Intel Celeron 887 512KB + 2MB 17 1500 2/2
1414
1877
3597
0.58
1.14
48
Pos       Model                                       L2 Cache + L3 Cache TDP (Watt) MHz - Turbo Cores / Threads 3DMark06 CPU Cinebench R10 32Bit Single Cinebench R10 32Bit Multi Cinebench R11.5 CPU Single 64Bit Cinebench R11.5 64Bit Cinebench R15 CPU Single 64Bit Cinebench R15 CPU Multi 64Bit wPrime 32 x264 Pass 1 x264 Pass 2
 591* Intel Celeron B800 512KB + 2MB 35 1500 2/2
1534
1910
3779
47
 592 Intel Core i3-2357M 512KB + 3MB 17 1300 2/4
15753
16453
38083
1.163
42.343
 593 AMD A4-3300M 2MB 35 1900 ‑ 2500 2/2
15563
1741.54
34174
1.124
40.2
 595 AMD A4-3305M 1MB 35 1900 ‑ 2500 2/2
1613.52
18122
3394.52
0.56
1.122
40.28
 602 AMD A6 Pro-7050B 1MB 17 2200 ‑ 3000 2/2
1468
18202
29302
0.572
0.982
49.52
81.52
47.992
32.842
6.312
 603* AMD A6-7000 1MB 17 2200 ‑ 3000 2/2
 607* AMD A6-5345M 1MB 17 2200 ‑ 2800 2/2
 609* Intel Celeron J1800 1MB 10 2410 ‑ 2580 2/2
 620 Intel Celeron N2840 1MB 8 2160 ‑ 2580 2/2
1510
13312
25332
0.443
0.893
383
763
 621* Intel Celeron J1750 1MB 10 2410 2/2
 624 Intel Celeron N2910 2MB 8 1600 4/4
1612
844
2907
0.3
1.14
27
97
 625 AMD A6-1450 2MB 8 1000 ‑ 1400 4/4
14392
10642
2860.52
0.343
1.033
59.98
29.13
6.04
 627 AMD A4 Micro-6400T 2MB 5 1000 ‑ 1600 4/4
1664
1251
3380
0.41
1.16
34
95
46.27
33.5
6.9
 643 Qualcomm Snapdragon 801 MSM8974AC 2MB 2450 4/4
 644 AMD A6-4455M 2MB 17 2100 ‑ 2600 2
1358.54
16893
26013
0.623
0.864
61.83
30.66
5.73
 645* AMD A4-5145M 1MB 17 2000 ‑ 2600 2/2
 646 AMD A4-4355M 2MB 17 1900 ‑ 2400 2
1239
1690
2318
0.52
0.72
63.5
 647 Samsung Exynos 5430 Octa 512KB 1800 8/8
 648 Mediatek MT6595 2MB 2200 8/8
 649 Intel Celeron N2830 1MB 8 2160 ‑ 2410 2/2
1184.56
2239.56
0.437
0.827
387
677
Pos       Model                                       L2 Cache + L3 Cache TDP (Watt) MHz - Turbo Cores / Threads 3DMark06 CPU Cinebench R10 32Bit Single Cinebench R10 32Bit Multi Cinebench R11.5 CPU Single 64Bit Cinebench R11.5 64Bit Cinebench R15 CPU Single 64Bit Cinebench R15 CPU Multi 64Bit wPrime 32 x264 Pass 1 x264 Pass 2
 650 Qualcomm Snapdragon 801 APQ8074AB 2MB 2360 4/4
 651 Qualcomm Snapdragon 801 MSM8974AB 2MB 2360 4/4
 652 Intel Celeron N2820 1MB 8 2170 ‑ 2390 2/2
10612
20102
0.362
0.692
32.52
58.52
48.5
26.5
5.8
 653 Intel Celeron N3050 2MB 6 1600 ‑ 2160 2/2
12433
10878
20528
0.418
0.798
349
629
55.23
25.523
4.743
 654 Intel Celeron N2815 1MB 8 1860 ‑ 2133 2/2
1068
2038
0.362
0.692
32.52
55.52
57.75
24.1
4.53
 655 Intel Celeron N3000 2MB 4 1040 ‑ 2080 2/2
 656 Intel Celeron N2810 1MB 8 2000 2/2
1043
993
1474
0.37
0.72
31
59
63.36
22.83
4.26
 657 Nvidia Tegra 4 1800 4/4
 658* Intel Atom Z3680 1MB 0 1330 ‑ 2000 2/2
 659* Intel Atom Z3680D 1MB 0 1330 ‑ 2000 2/2
 680 Mediatek MT6595M 2MB 2000 8/8
 681* VIA Nano QuadCore L4700 4MB 28 1200 ‑ 1460 4/4
1615
 682* Intel Pentium 3561Y 512KB + 2MB 12 1200 2/2
 683* Intel Pentium 3560Y 512KB + 2MB 12 1200 2/2
1.02
 684* Intel Celeron 2961Y 512KB + 2MB 12 1100 2/2
 685 Intel Pentium 2129Y 512KB + 2MB 10 1100 2/2
1502
2860
0.45
0.88
39
72
71.52
29.27
5.15
 686 Qualcomm Snapdragon 801 MSM8974AA 2MB 2260 4/4
 687 HiSilicon Kirin 925 1800 8/8
 688 Qualcomm Snapdragon 800 MSM8974 2MB 2300 4/4
 690 Samsung Exynos 5420 Octa 512KB 1800 8/8
Pos       Model                                       L2 Cache + L3 Cache TDP (Watt) MHz - Turbo Cores / Threads 3DMark06 CPU Cinebench R10 32Bit Single Cinebench R10 32Bit Multi Cinebench R11.5 CPU Single 64Bit Cinebench R11.5 64Bit Cinebench R15 CPU Single 64Bit Cinebench R15 CPU Multi 64Bit wPrime 32 x264 Pass 1 x264 Pass 2
 691 HiSilicon Kirin 920 1700 8/8
 696 HiSilicon Kirin 935 2200 8/8
 697* Mediatek MT6795 2200 8/8
 698 HiSilicon Kirin 930 2000 8/8
 699* Mediatek Helio P10 MT6755 2000 8/8
 700 Intel Pentium 977 512KB + 2MB 17 1400 2/2
1435
0.56
1.08
56
 701 Intel Celeron 877 512KB + 2MB 17 1400 2/2
1.07
 702 Apple A7 1MB + 4MB 1300 2/2
 703 Intel Atom Z3570 2MB 2000 4/4
 711* Intel Pentium 967 512KB + 2MB 17 1300 2/2
1319
1640
3038
0.95
58.63
 712 Intel Celeron 867 512KB + 2MB 17 1300 2/2
 713 Intel Atom Z3560 2MB 1830 4/4
 714* AMD E2-3000 1MB 15 1650 2/2
 716* Intel Pentium 957 512KB + 2MB 17 1200 2/2
 717* AMD E1-7010 1MB 10 1500 2/2
 718 Samsung Exynos 5410 Octa 512KB 1600 8/8
 719 Intel Atom Z3480 1MB 2133 2/2
 720* Intel Atom x3-C3440 1MB 1200 ‑ 1400 4/4
 723 Intel Celeron B730 256KB + 1.5MB 35 1800 1/2
 725 Samsung Exynos 5260 Hexa 1700 6/6
Pos       Model                                       L2 Cache + L3 Cache TDP (Watt) MHz - Turbo Cores / Threads 3DMark06 CPU Cinebench R10 32Bit Single Cinebench R10 32Bit Multi Cinebench R11.5 CPU Single 64Bit Cinebench R11.5 64Bit Cinebench R15 CPU Single 64Bit Cinebench R15 CPU Multi 64Bit wPrime 32 x264 Pass 1 x264 Pass 2
 731 Samsung Exynos 5410 Octa 512KB 1600 8/8
 734 Intel Celeron 1019Y 512KB + 2MB 10 1000 2/2
 738 Mediatek MT8135 1700 4/4
 742 AMD E1-2500 1MB 15 1400 2/2
1021
1052
2016
0.342
0.612
27
44
79.61
20.44
4
 743* AMD E1 Micro-6200T 1MB 4 1000 ‑ 1400 2/2
 744 AMD E1-6010 1MB 10 1350 2/2
927
983
1619
0.332
0.592
26.52
442
95.8
18.78
3.75
 747* Intel Atom Z3530 2MB 1330 4/4
 748* Intel Celeron 847 512KB + 2MB 17 1100 2/2
992.52
1269.52
2407.52
0.412
0.652
80.36
 750* Intel Celeron 807 256KB + 1.5MB 17 1500 1/2
 753 Intel Celeron B720  + 1.5MB 35 1700 1/1
 754 Samsung Exynos 5250 Dual 1MB 1700 2/2
 755* Mediatek MT8752 1700 8/8
 756 Mediatek MT6752 1700 8/8
 757 Samsung Exynos 7580 Octa 1600 8/8
 758 Qualcomm Snapdragon 617 MSM8952 1500 8/8
 759 Qualcomm Snapdragon 616 MSM8939v2 1700 8/8
 760 Qualcomm Snapdragon 615 MSM8939 1700 8/8
 761* Qualcomm Snapdragon 425 1700 8/8
 762 Intel Atom D2700 1MB 10 2130 2/4
1148
0.72
 770 Rockchip RK3288 1800 4/4
Pos       Model                                       L2 Cache + L3 Cache TDP (Watt) MHz - Turbo Cores / Threads 3DMark06 CPU Cinebench R10 32Bit Single Cinebench R10 32Bit Multi Cinebench R11.5 CPU Single 64Bit Cinebench R11.5 64Bit Cinebench R15 CPU Single 64Bit Cinebench R15 CPU Multi 64Bit wPrime 32 x264 Pass 1 x264 Pass 2
 771 Mediatek MT6753 1500 8/8
 772 Mediatek MT6592 1MB 1700 8/8
 775 AMD E2-2000 1MB 18 1750 2/2
 776* Intel Celeron N2808 1MB 4 1580 ‑ 2250 2/2
 777* Qualcomm Snapdragon 610 MSM8936 1700 4/4
 778 Qualcomm Snapdragon 600 APQ8064T 2MB 1700 4/4
 779 HiSilicon Kirin 910T 1800 4/4
 780 MediaTek MT8161 1300 4/4
 781* Intel Atom x3-C3230RK 1100 4/4
 782* Qualcomm Snapdragon 415 MSM8929 1400 8/8
 783 Samsung Exynos 7578 1500 4/4
 784 AMD E2-1800 1MB 18 1700 2/2
1082.510
11107
21217
0.337
0.648
69.058
18.34
3.26
 785 AMD E-450 1MB 18 1650 2/2
1034.58
1062.58
2020.58
0.322
0.628
64.54
16.17
2.89
 786 AMD E-350 1MB 18 1600 2/2
102111
1048.512
200512
0.6111
68.89
 787 AMD A4-1350 2MB 8 1000 4/4
 788 Intel Celeron 927UE 256KB + 1MB 17 1500 1/1
 789 Intel Celeron N2807 1MB 4 1580 ‑ 2160 2/2
986
2093
0.26
0.54
35
65
57.36
17.01
3.15
 793 Intel Celeron N2806 1MB 5 1580 ‑ 2000 2/2
1195
0.64
26
58
 794* Intel Atom E3827 1MB 8 1750 2/2
 795 Intel Atom N2850 1MB 6 2000 2/4
Pos       Model                                       L2 Cache + L3 Cache TDP (Watt) MHz - Turbo Cores / Threads 3DMark06 CPU Cinebench R10 32Bit Single Cinebench R10 32Bit Multi Cinebench R11.5 CPU Single 64Bit Cinebench R11.5 64Bit Cinebench R15 CPU Single 64Bit Cinebench R15 CPU Multi 64Bit wPrime 32 x264 Pass 1 x264 Pass 2
 796 Intel Atom Z3460 1MB 1600 2/2
 802 Qualcomm Snapdragon S4 Pro APQ8064A 2MB 1500 4/4
 803* Mediatek MT8732 1500 4/4
 804* Mediatek MT8165 1500 4/4
 805 Mediatek MT6732 1500 4/4
 806 Mediatek MT6735 1500 4/4
 811 Rockchip RK3188 1800 4/4
 812 Intel Celeron B710 256KB + 1.5MB 35 1600 1/1
868
2051
0.62
88.4
20.28
3.53
 814 AMD E1-1500 1MB 18 1480 2/2
 816 AMD E1-1200 1MB 18 1400 2/2
873.54
9123
16823
0.273
0.534
763
 822 AMD E-300 1MB 18 1300 2/2
838.52
853
1176
0.252
0.482
79
 823 Qualcomm Snapdragon 410 MSM8916 1400 4/4
 824 Qualcomm Snapdragon 410 APQ8016 1200 4/4
 825 HiSilicon Kirin 620 1200 8/8
 840 Intel Celeron 797 256KB + 1.5MB 35 1400 1/1
 841 HiSilicon Kirin 910 1600 4/4
 864 Intel Atom D2560 1MB 10 2000 2/4
 867 Intel Atom D2550 1MB 10 1866 2/4
 868 Intel Atom N2800 1MB 6 1860 2/4
965
648
1829
54.3
19.7
3.67
 869 AMD E1-2200 1MB 9 1050 2/2
Pos       Model                                       L2 Cache + L3 Cache TDP (Watt) MHz - Turbo Cores / Threads 3DMark06 CPU Cinebench R10 32Bit Single Cinebench R10 32Bit Multi Cinebench R11.5 CPU Single 64Bit Cinebench R11.5 64Bit Cinebench R15 CPU Single 64Bit Cinebench R15 CPU Multi 64Bit wPrime 32 x264 Pass 1 x264 Pass 2
 870* Intel Atom E3826 1MB 7 1460 2/2
 871 Intel Celeron N2805 1MB 4 1460 2/2
885
7562
14302
24
44
85.21
17.35
3.13
 872 AMD A4-1250 1MB 9 1000 2/2
740.52
6633
12583
0.23
0.473
20.52
32.52
111.183
14.96
2.86
 873 AMD E1-2100 1MB 9 1000 2/2
7722
7654
14354
0.244
0.474
205
365
106.972
14.692
2.692
 874 AMD A4-1200 1MB 4 1000 2/2
7332
705.54
12484
0.244
0.424
192
312
111.88
11.45
2.85
 875* AMD GX-210JA 1MB 6 1000 2/2
 876 Intel Atom Z2760 1MB 2 1800 2/4
9459
601.512
1696.512
0.18
0.532
58.137
17.752
3.282
 878 Intel Atom N2650 1MB 3 1733 2/4
 879* Intel Atom E3825 1MB 6 1330 2/2
 880* Intel Atom E3805 1MB 3 1330 2/2
 891 Intel Atom N2600 1MB 4 1600 2/4
8122
5413
1527.54
66
9.8
9.9
 902 Qualcomm Snapdragon 400 MSM8928 1600 4/4
 903 Qualcomm Snapdragon 400 APQ8028 1600 4/4
 904 Marvell Armada PXA1908 1200 4/4
 906 Apple A6x 1400 2
 933 Intel Atom Z2580 1MB 3 1300 ‑ 2000 2/4
 934 Qualcomm Snapdragon S4 Pro MSM8960DT 1MB 1700 2/2
 935 Qualcomm Snapdragon S4 Pro MSM8960T 1MB 1700 2/2
 949 AMD C-70 1MB 9 1000 ‑ 1333 2/2
782
798
1495
0.23
0.37
98.16
 950 Qualcomm Snapdragon 400 8930AB 1MB 1700 2/2
Pos       Model                                       L2 Cache + L3 Cache TDP (Watt) MHz - Turbo Cores / Threads 3DMark06 CPU Cinebench R10 32Bit Single Cinebench R10 32Bit Multi Cinebench R11.5 CPU Single 64Bit Cinebench R11.5 64Bit Cinebench R15 CPU Single 64Bit Cinebench R15 CPU Multi 64Bit wPrime 32 x264 Pass 1 x264 Pass 2
 951 AMD C-60 1MB 9 1000 ‑ 1333 2/2
7534
767.54
14834
0.21
0.442
86.152
 952 Qualcomm Snapdragon S4 Plus APQ8060A 1MB 1500 2/2
 953 Qualcomm Snapdragon S4 Plus MSM8960 1MB 1500 2/2
 955 Qualcomm Snapdragon S4 Plus MSM8260A 1MB 1500 2/2
 959 Intel Atom Z2560 1MB 3 933 ‑ 1600 2/4
 960 AMD C-50 1MB 9 1000 2/2
635.58
6619
1281.510
0.383
111.217
 961 AMD Z-60 1MB 5 1000 2/2
669
1249
0.2
0.37
114
11.24
1.95
 962 AMD Z-01 1MB 6 1000 2/2
 967 Apple A6 1000 2
 968* Intel Atom x3-C3130 512KB 1000 2/2
 969 AMD E-240 512KB 18 1500 1/1
500.52
937.52
0.26
137.4
 972 Samsung Exynos 4412 Quad 1400 4/4
 973 NVIDIA Tegra 3 1200 ‑ 1300 4/4
 974 Mediatek MT8127 512KB 1500 4/4
 975 Mediatek MT6589T 2MB 1500 4/4
 976 Mediatek MT8389 1MB 1200 4/4
 977 Mediatek MT8125 1MB 1200 4/4
 978 Samsung Exynos 3470 Quad 1400 4/4
 979 Mediatek MT8121 1MB 1300 4/4
 980 Mediatek MT6582 512KB 1300 4/4
Pos       Model                                       L2 Cache + L3 Cache TDP (Watt) MHz - Turbo Cores / Threads 3DMark06 CPU Cinebench R10 32Bit Single Cinebench R10 32Bit Multi Cinebench R11.5 CPU Single 64Bit Cinebench R11.5 64Bit Cinebench R15 CPU Single 64Bit Cinebench R15 CPU Multi 64Bit wPrime 32 x264 Pass 1 x264 Pass 2
 981 Mediatek MT6582M 512KB 1300 4/4
 982 Qualcomm Snapdragon 212 APQ8009 1300 4/4
 983 Qualcomm Snapdragon 400 MSM8926 1200 4/4
 984 Qualcomm Snapdragon 400 MSM8226 1200 4/4
 985 Qualcomm Snapdragon 400 APQ8026 1200 4/4
 986 Mediatek MT6589 1200 4/4
 987 Qualcomm Snapdragon 200 MSM8212 1200 4/4
 988 Qualcomm Snapdragon 210 MSM8909 1100 4/4
 989 Marvell PXA1088 1200 4/4
 990 Qualcomm Snapdragon S4 Plus MSM8930 1MB 1200 2/2
 991 Qualcomm Snapdragon S4 Plus MSM8230 1MB 1200 2/2
 992* Intel Atom Z2480 512KB 2000 1/2
 993* Intel Atom E3815 512KB 5 1460 1/1
 1008 AMD C-30 512KB 9 1200 1/1
403
 1016 Intel Atom Z2460 512KB 4 1300 ‑ 1600 1/2
 1027 Qualcomm Snapdragon S4 Plus MSM8227 1MB 1000 2/2
 1032* Samsung Exynos 4212 1.5 GHz 1MB 1500 2/2
 1033 Texas Instruments OMAP 4470 1500 2/2
 1034 HiSilicon k3v2 Hi3620 1200 4/4
 1035 Rockchip RK3066 1.5 GHz 512KB 1500 2/2
Pos       Model                                       L2 Cache + L3 Cache TDP (Watt) MHz - Turbo Cores / Threads 3DMark06 CPU Cinebench R10 32Bit Single Cinebench R10 32Bit Multi Cinebench R11.5 CPU Single 64Bit Cinebench R11.5 64Bit Cinebench R15 CPU Single 64Bit Cinebench R15 CPU Multi 64Bit wPrime 32 x264 Pass 1 x264 Pass 2
 1036 Qualcomm Snapdragon S4 Play MSM8625Q 1200 4/4
 1037 Qualcomm Snapdragon 200 8225Q 1400 4/4
 1038 Qualcomm Snapdragon S4 Play MSM8225Q 1200 4/4
 1039 MediaTek MT8312 1300 2/2
 1040 Renesas MP5232 1500 2/2
 1041 Broadcom BCM21664T 1200 2/2
 1042 Marvell PXA986 1200 2/2
 1043 Amlogic AML8726-MX 512KB 1500 2/2
 1044 Qualcomm Snapdragon S3 MSM8660 1MB 1700 2/2
 1045 Qualcomm Snapdragon S3 MSM8260 1MB 1500 2/2
 1046* Samsung Exynos 4210 1.4 GHz 1MB 1400 2/2
 1051* Texas Instruments OMAP 4460 1 1200 2/2
 1052 Rockchip RK3168 1200 2/2
 1053* Samsung Exynos 4210 1.2 GHz 1MB 1200 2/2
 1054 MediaTek MT8377 1MB 1200 2/2
 1055 Broadcom BCM28155 1200 2/2
 1056* Texas Instruments OMAP 4430 1 1000 2/2
 1057 MediaTek MT6572 1MB 1200 2/2
 1058 Spreadtrum SC8830 512KB 1200 4/4
 1059 Apple A5x 1000 2
Pos       Model                                       L2 Cache + L3 Cache TDP (Watt) MHz - Turbo Cores / Threads 3DMark06 CPU Cinebench R10 32Bit Single Cinebench R10 32Bit Multi Cinebench R11.5 CPU Single 64Bit Cinebench R11.5 64Bit Cinebench R15 CPU Single 64Bit Cinebench R15 CPU Multi 64Bit wPrime 32 x264 Pass 1 x264 Pass 2
 1060 Qualcomm Snapdragon S4 Play MSM8225 1500 2/2
 1061 Intel Atom Z2420 512KB 1200 1/2
 1062* Apple A5 1000 2
 1063 Nvidia Tegra 2 (250) 1MB 1 1000 2/2
 1064 Qualcomm Snapdragon 200 8210 1200 2/2
 1065 MediaTek MT8317T 1200 2/2
 1066 MediaTek MT6577 1000 2/2
 1067 ST-Ericsson NovaThor U8500 1000 2/2
 1068 ST-Ericsson NovaThor U8420 1000 2/2
 1076 MediaTek MT6575 1000 1/1
 1082* Qualcomm Snapdragon S2 MSM8255 1500 1/1
 1083 Rockchip RK2918 1.2 GHz 1200 1/1
 1084 AllWinner A10 1200 1/1
 1085 ARM Cortex A8 1.2 GHz 1200 1/1
 1086* Apple A4 1000 1/1
 1087 AllWinner A13 1000 1/1
 1088* WonderMedia PRIZM WM8950 1000 1/1
 1089* Samsung Hummingbird S5PC110 / Exynos 3110 1000 1/1
 1090* Qualcomm Snapdragon S1 MSM7227A 256KB 1000 1/1
 1091 Qualcomm Snapdragon S1 MSM7225A 256KB 1000 1/1
Pos       Model                                       L2 Cache + L3 Cache TDP (Watt) MHz - Turbo Cores / Threads 3DMark06 CPU Cinebench R10 32Bit Single Cinebench R10 32Bit Multi Cinebench R11.5 CPU Single 64Bit Cinebench R11.5 64Bit Cinebench R15 CPU Single 64Bit Cinebench R15 CPU Multi 64Bit wPrime 32 x264 Pass 1 x264 Pass 2
 1092 Texas Instruments OMAP 3630 1GHz 1000 1/1
 1093 Texas Instruments OMAP 3622 1000 1/1
 1094 Rockchip RK2918 1000 1/1
 1095 Telechips TCC8803 1GHz 1000 1/1
 1096 ZiiLABS ZMS-08 1000 1/1
 1097 ARM Cortex A8 1GHz 1000 1/1
 1098 Actions ACT-ATM7029 1000 4/4
 1099* Qualcomm Snapdragon S1 QSD8250 1000 1/1
 1102* Loongson 2F 900MHz 512KB 4 900 1/1
 1103* Qualcomm Snapdragon S1 MSM7227 600 1/1
 1104* CSR8670 80 2

반응형
Posted by 랩터 인터내셔널