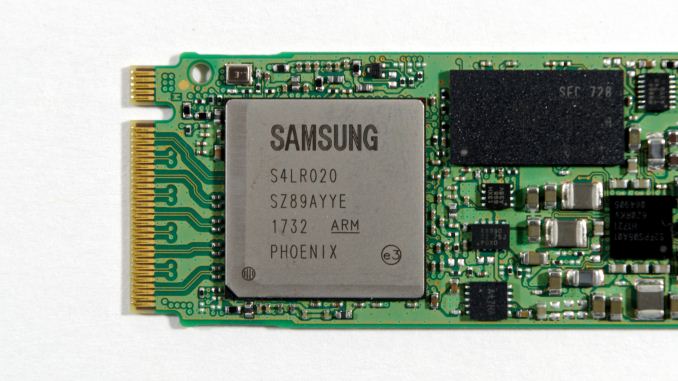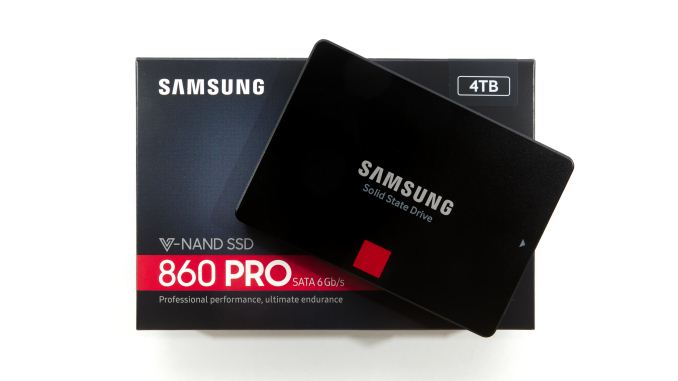
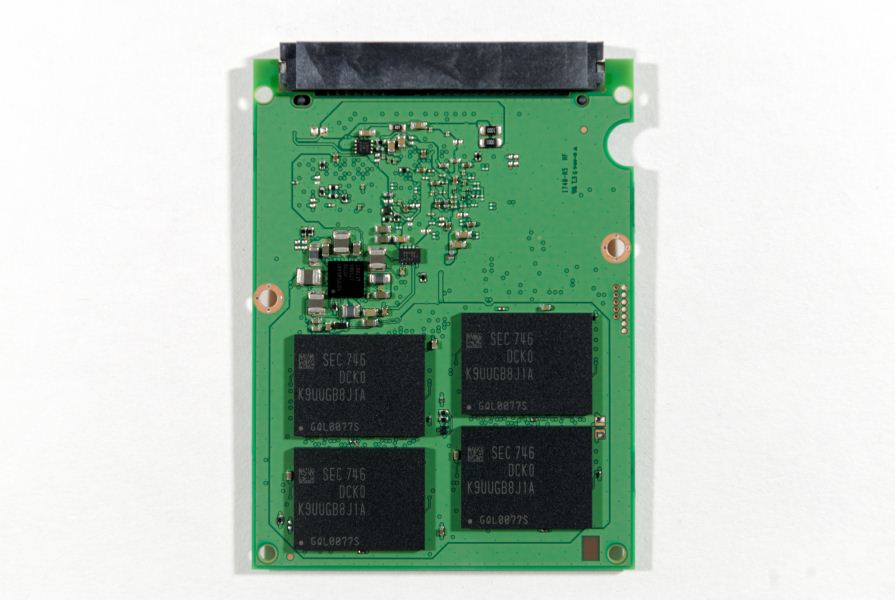
삼성전자 860 PRO SSD 리뷰 - https://www.anandtech.com
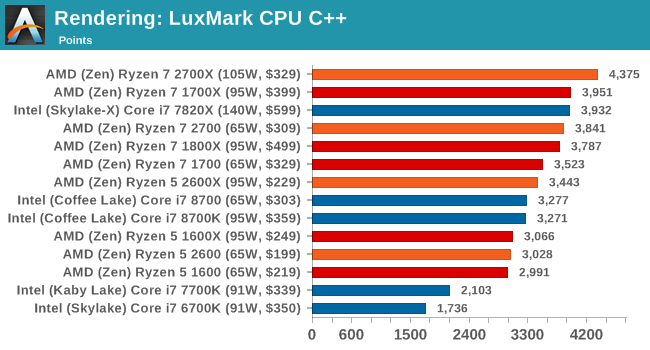
| Samsung 860 PRO Specifications |
| Capacity | 256 GB | 512 GB | 1 TB | 2 TB | 4 TB |
| Form Factor | 2.5" SATA 6 Gbps |
| Controller | Samsung MJX |
| NAND | Samsung 64-layer 3D MLC V-NAND |
| LPDDR4 DRAM | 512 MB | 1 GB | 2 GB | 4 GB |
| Sequential Read | up to 560 MB/s |
| Sequential Write | up to 530 MB/s |
| 4KB Random Read | up to 100k IOPS |
| 4KB Random Write | up to 90k IOPS |
| DevSleep Power | 2.5 mW – 7 mW |
| Endurance | 300 TBW | 600 TBW | 1200 TBW | 2400 TBW | 4800 TBW |
| Warranty | 5 years |
| MSRP | $139.99 (55¢/GB) | $249.99 (49¢/GB) | $479.99 (47¢/GB) | $949.99 (46¢/GB) | $1899.99 (46¢/GB) |
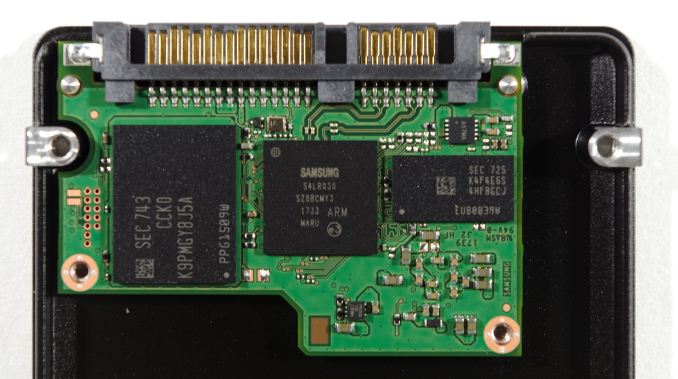
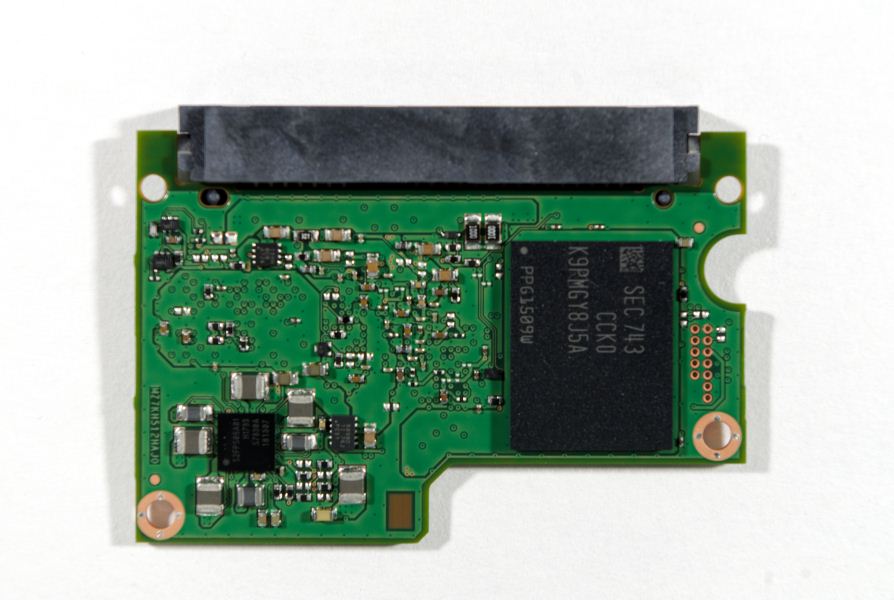
삼성전자 860 PRO SSD
메인 컨트롤러 : Samsung MJX
폼 팩터 : 2.5인치 SATA 6Gbps
낸드 : Samsung 64-layer 3D MLC V-NAND
DRAM : 512MB~4GB
시퀀셜 읽기 : up to 560 MB/s
시퀀셜 쓰기 : up to 530 MB/s
4KB 랜덤 읽기 : up to 100k IOPS
4KB 랜덤 쓰기 : up to 90k IOPS
DevSleep Power : 2.5 mW – 7 mW
테스트 시스템
| AnandTech 2017 SSD Testbed |
| CPU | Intel Xeon E3 1240 v5 |
| Motherboard | ASRock Fatal1ty E3V5 Performance Gaming/OC |
| Chipset | Intel C232 |
| Memory | 4x 8GB G.SKILL Ripjaws DDR4-2400 CL15 |
| Graphics | AMD Radeon HD 5450, 1920x1200@60Hz |
| Software | Windows 10 x64, version 1703 |
| Linux kernel version 4.14, fio version 3.1 |
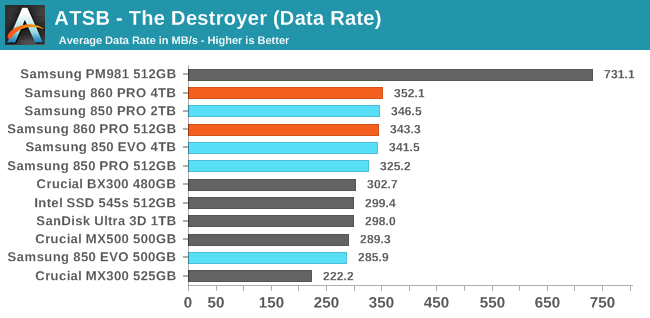
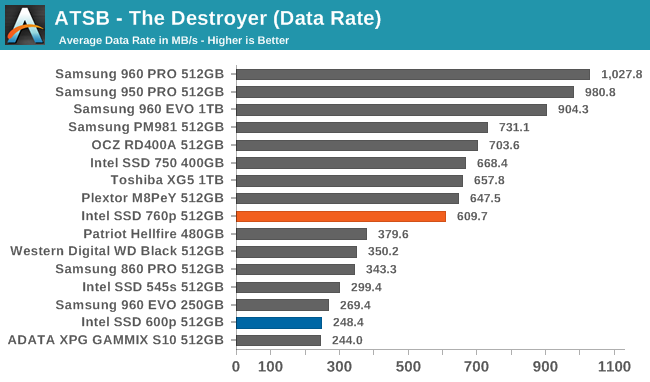
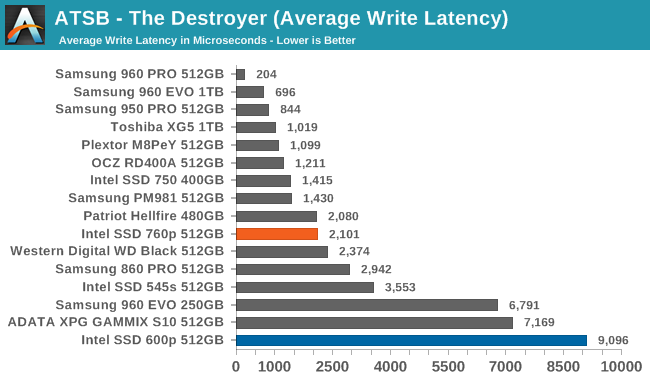
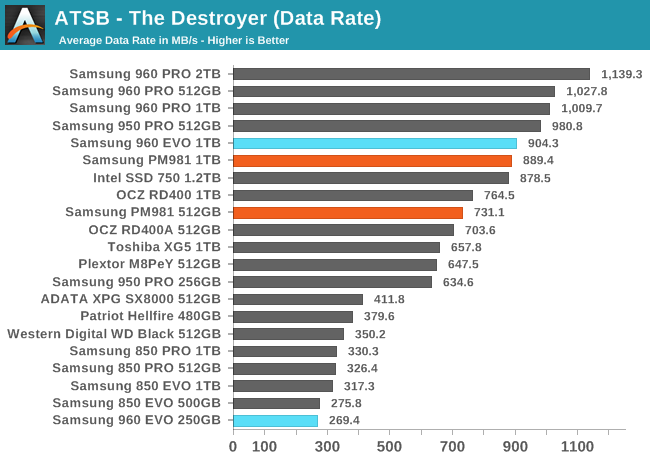
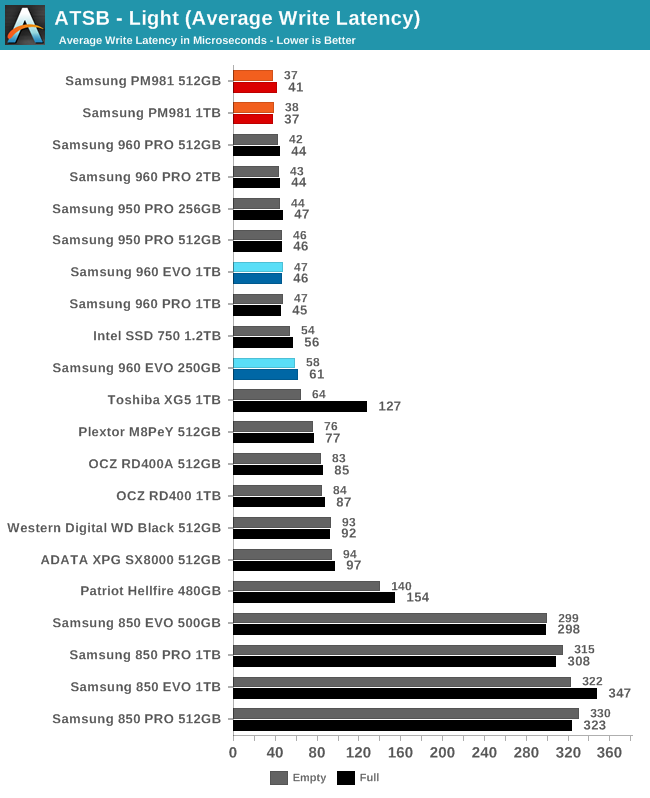
Samsung's dominance of this test wasn't being seriously challenged, but the 512GB 860 PRO does show improvement to the average data rate on The Destroyer, putting it up in the range of Samsung's multi-TB SATA drives. It's a small change, but SATA doesn't leave room for big gains.
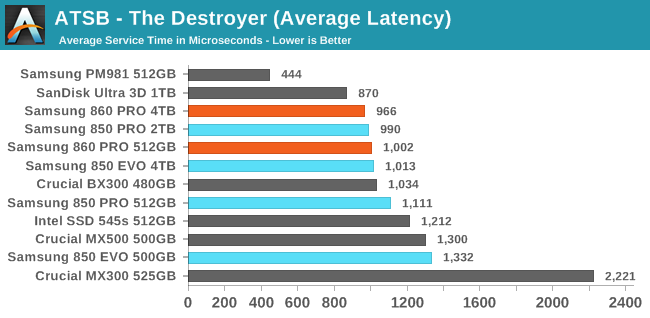
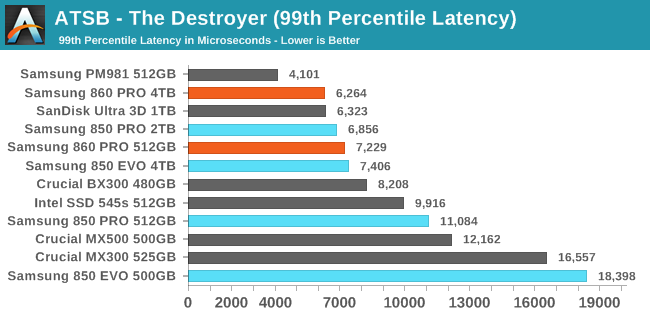
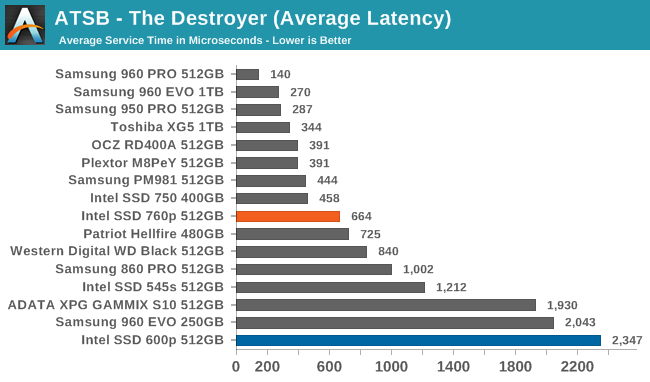
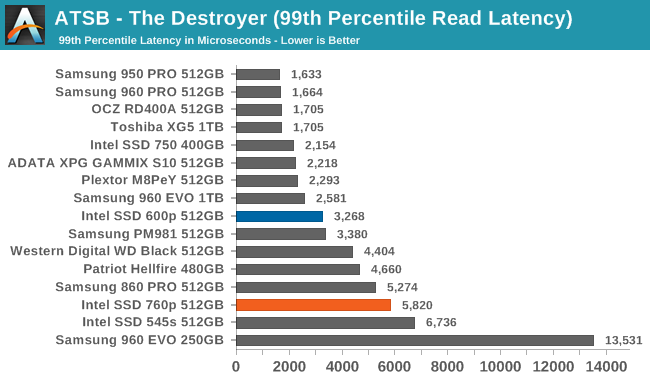
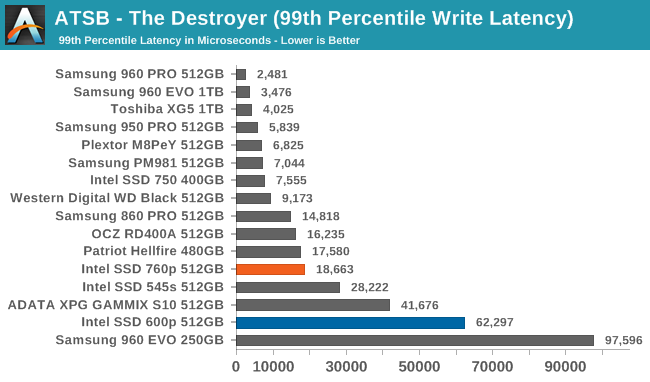
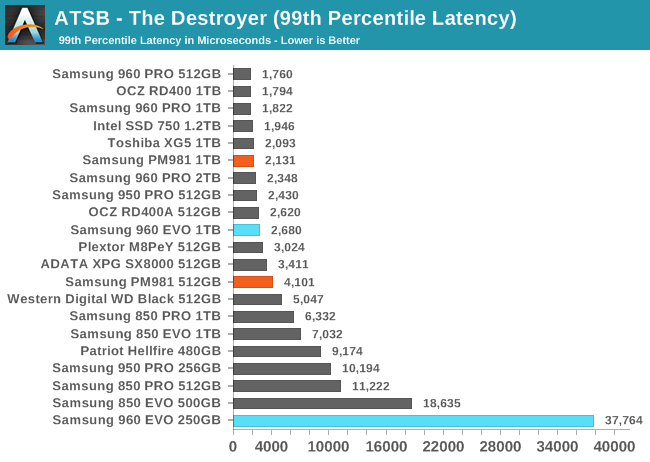
The good average and 99th percentile latency scores of the SanDisk Ultra 3D match or beat the best scores from the Samsung SATA drives. The 512GB 860 PRO shows substantial improvement in 99th percentile latency and more modest gains in average latency, relative to the 850 PRO.
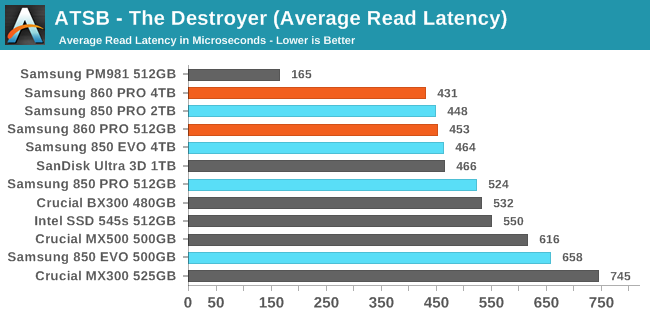
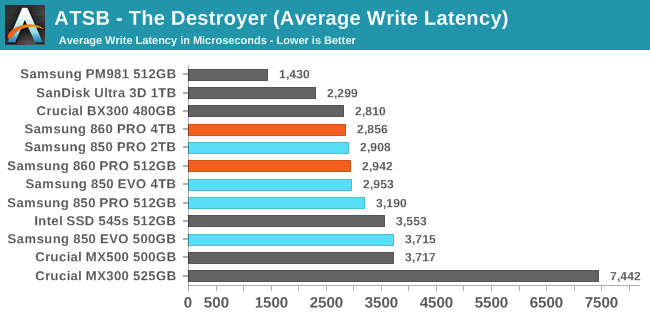
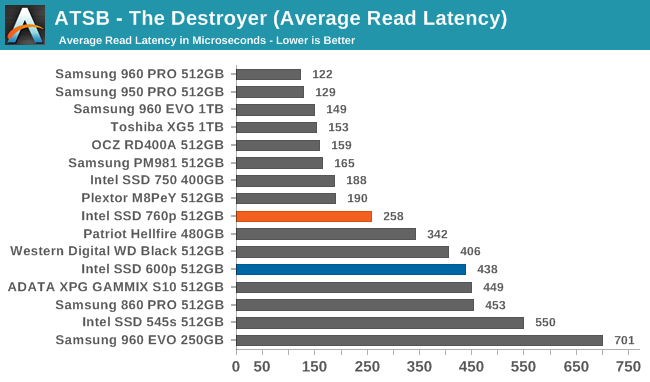
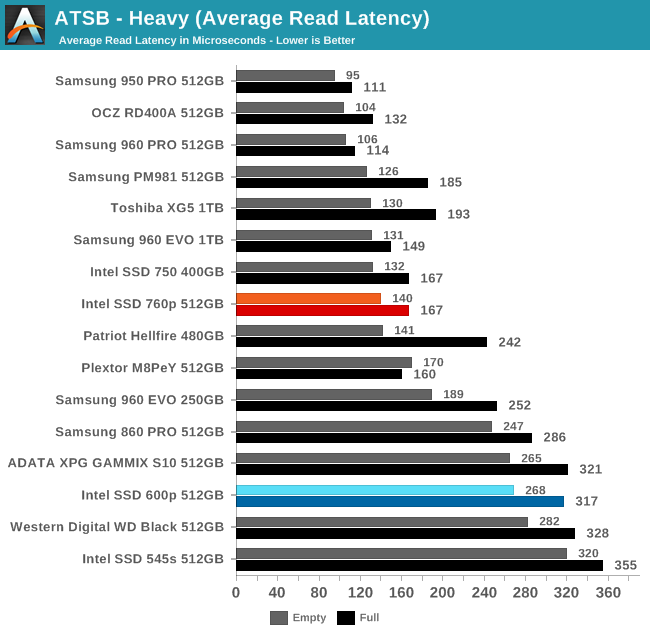
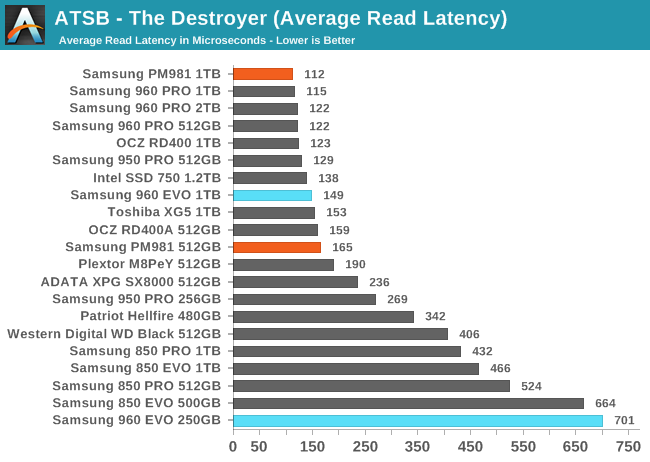
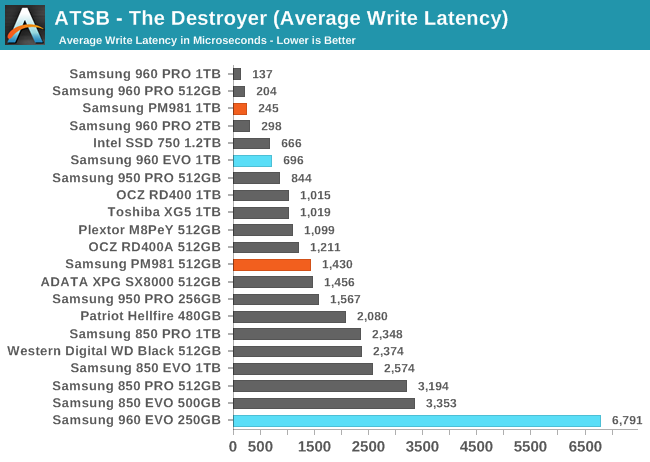
The Samsung 860 PROs show the best average read latencies in their respective product classes, but the SanDisk Ultra 3D isn't far behind. For average write latencies, the Ultra 3D takes a clear lead over the Samsung drives, and the Crucial BX300 is ahead of the Samsung drives by a hair.
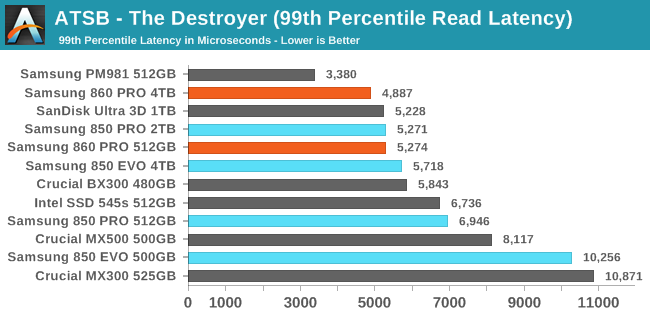
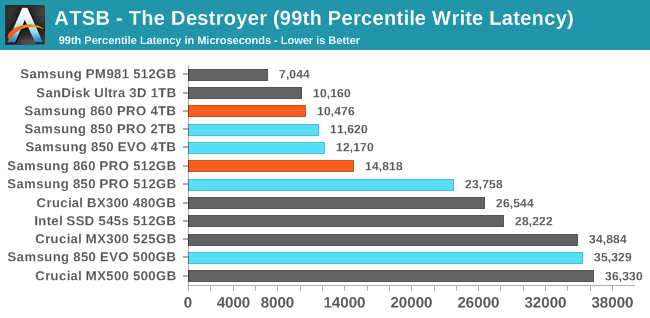
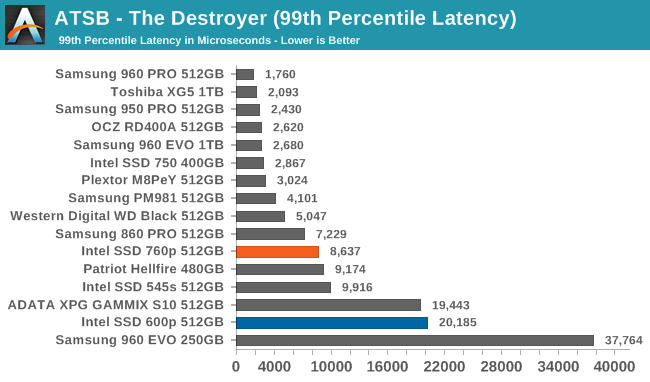
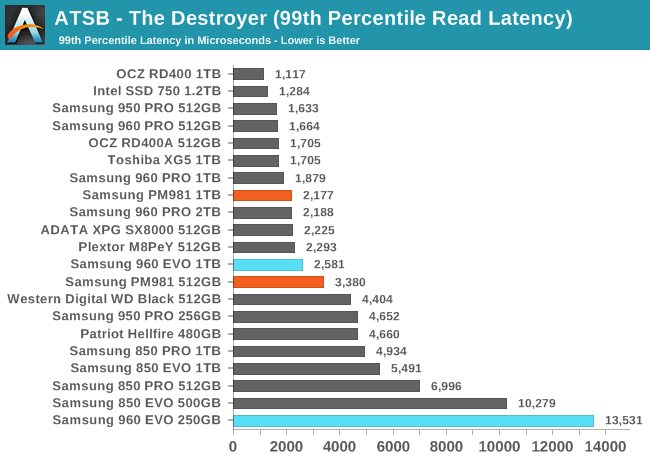
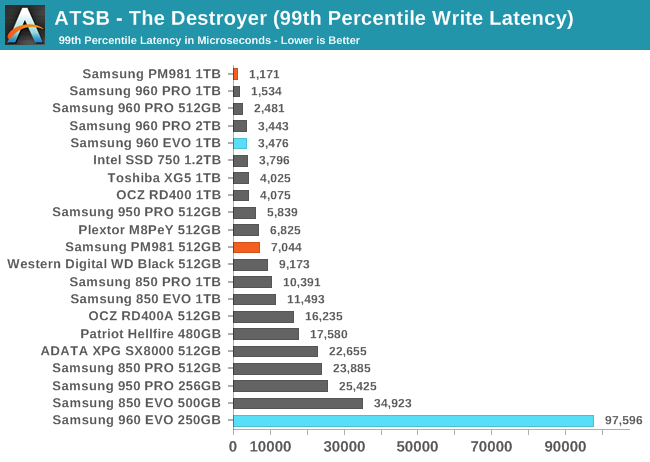
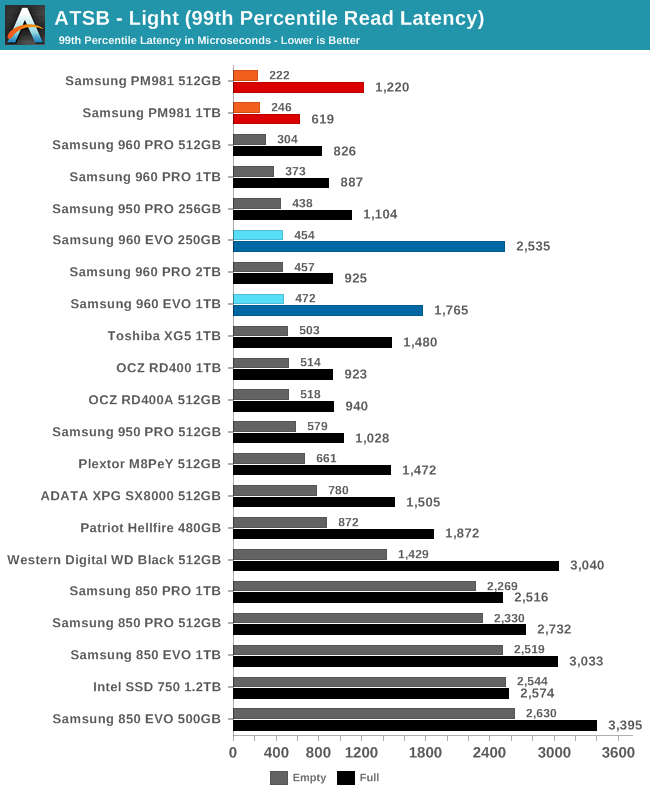
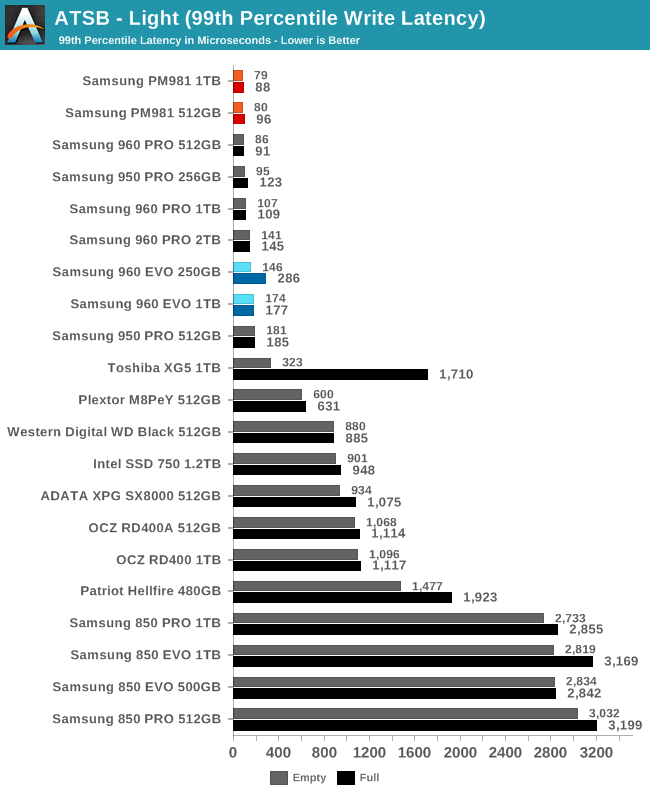
The 99th percentile read and write latencies of the 860 PRO show substantial improvements at 512GB, and smaller improvements among the multi-TB drives.
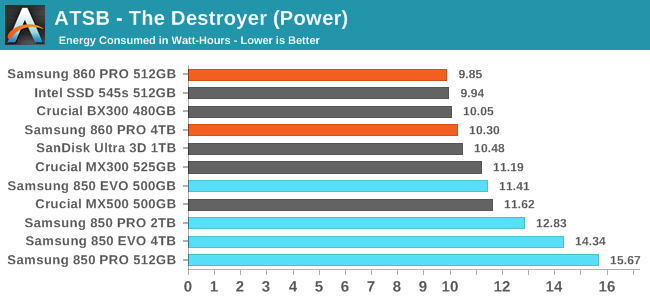
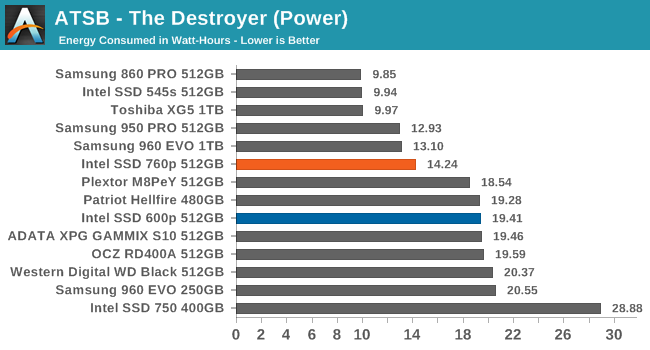
While the 4TB 860 PRO performed better on The Destroyer than the 512GB model by every measure, the 512GB model was more power efficient, and sets a new record for its class. The improvements relative to the 850 PRO are remarkable: the old 512GB 850 PRO required 60% more energy to complete The Destroyer than the new 512GB 860 PRO. Samsung has caught up with the modern competitors in terms of energy efficiency.
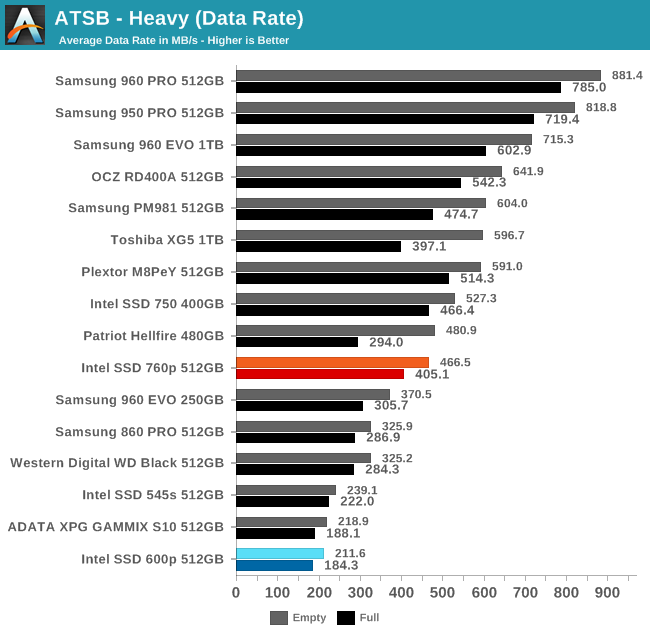
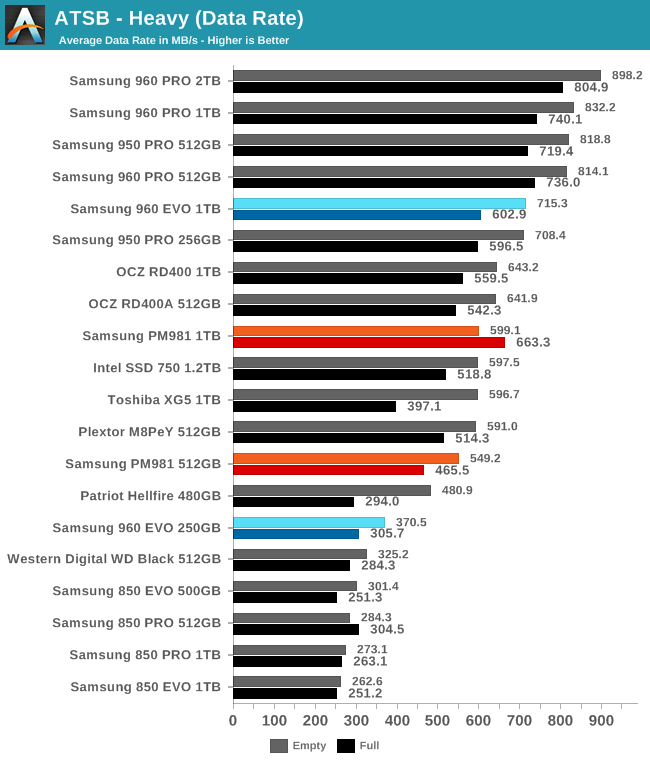
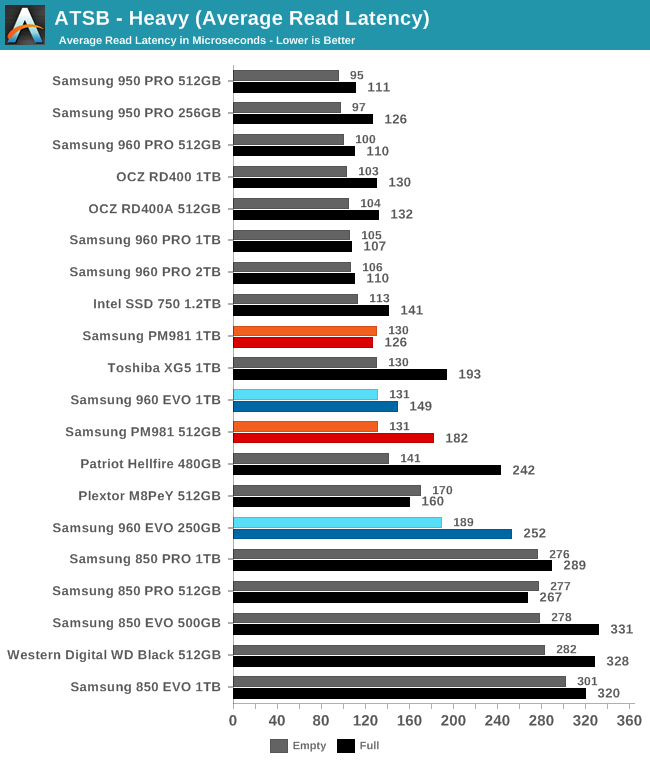
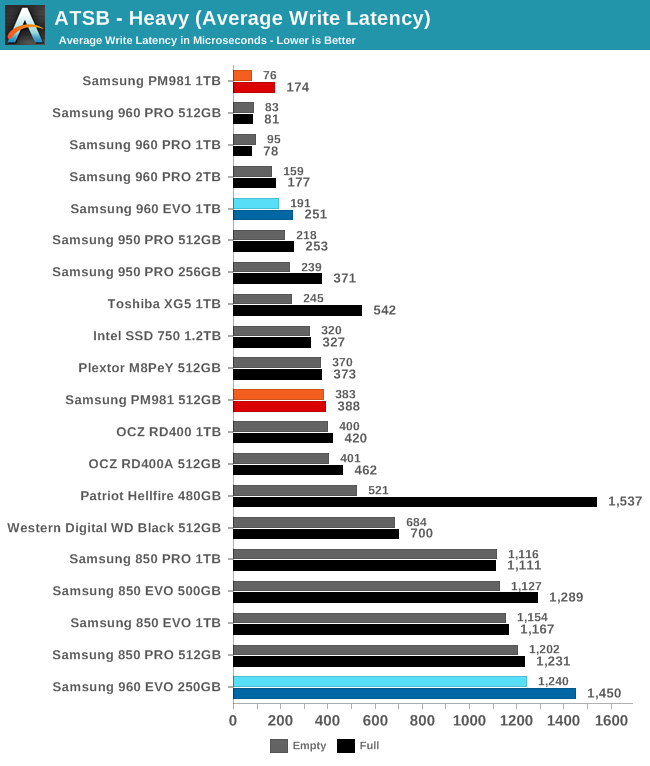
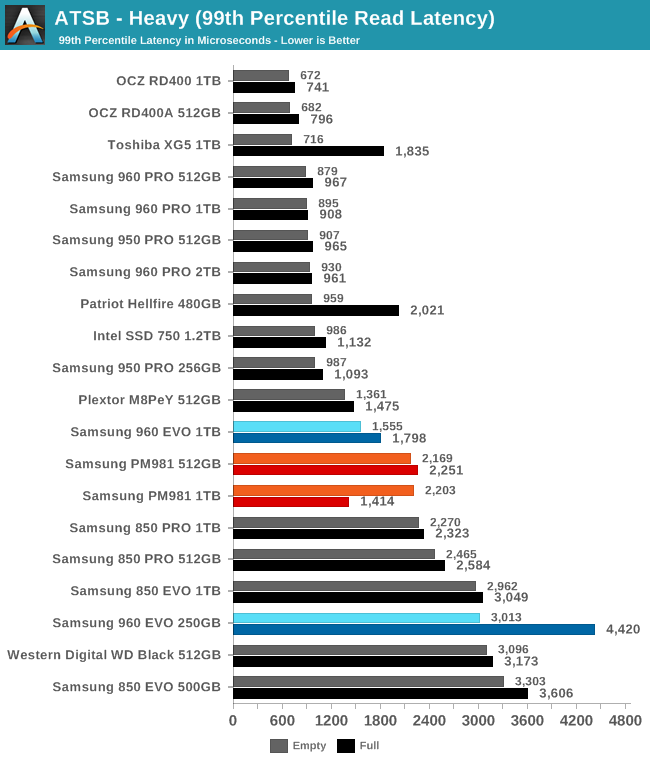
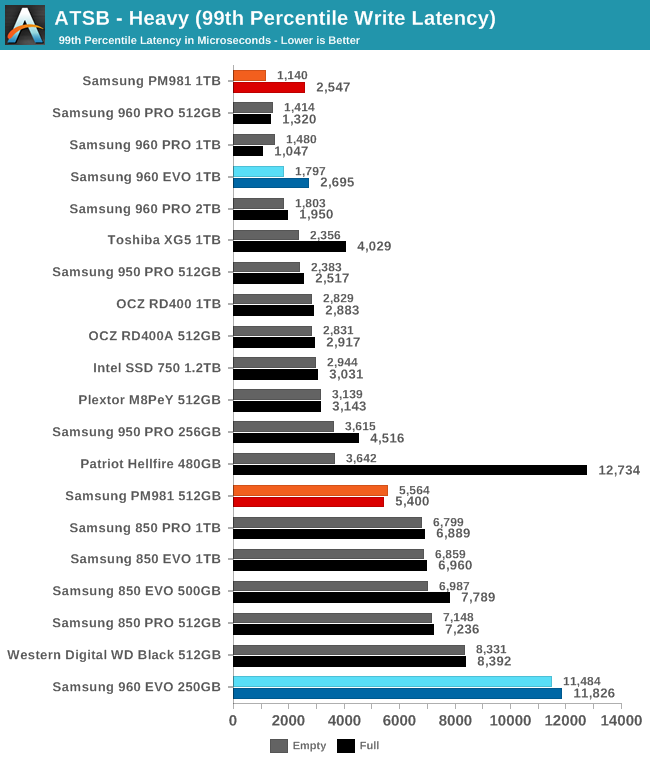
AnandTech Storage Bench - Heavy
Our Heavy storage benchmark is proportionally more write-heavy than The Destroyer, but much shorter overall. The total writes in the Heavy test aren't enough to fill the drive, so performance never drops down to steady state. This test is far more representative of a power user's day to day usage, and is heavily influenced by the drive's peak performance. The Heavy workload test details can be found here. This test is run twice, once on a freshly erased drive and once after filling the drive with sequential writes.
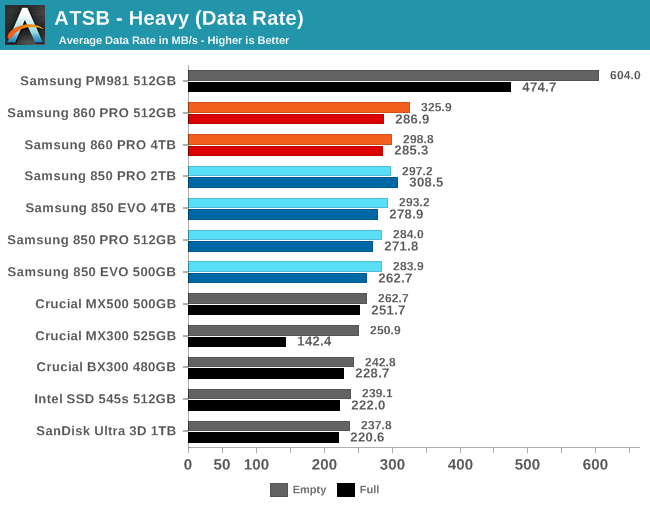
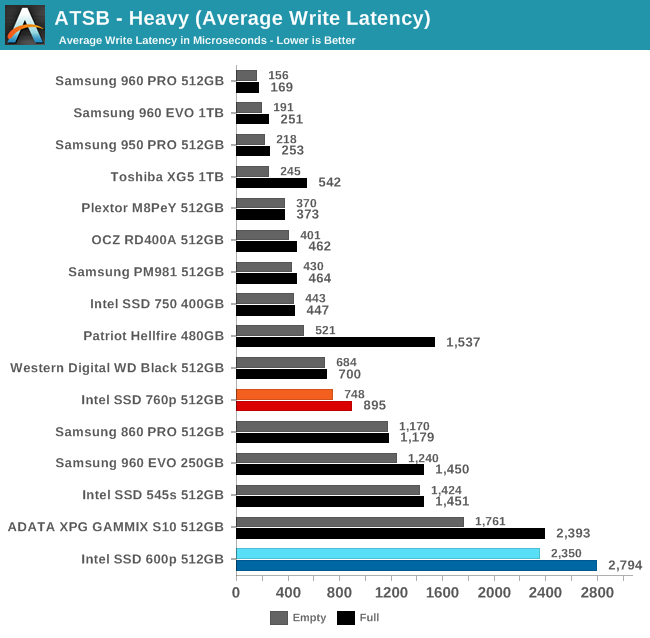
As with The Destroyer, Samsung's SATA SSDs were still on top before the Samsung 860 PRO arrived. The 860 PRO brings only modest improvements to the average data rates on the Heavy test, and the 512GB models is slightly faster than the 4TB model. The only real outlier here is the Crucial MX300, for its poor performance when the drive is full.
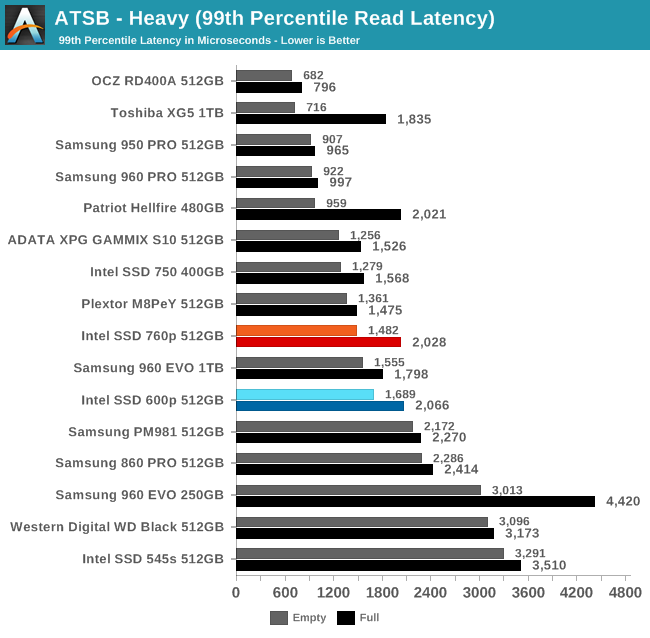
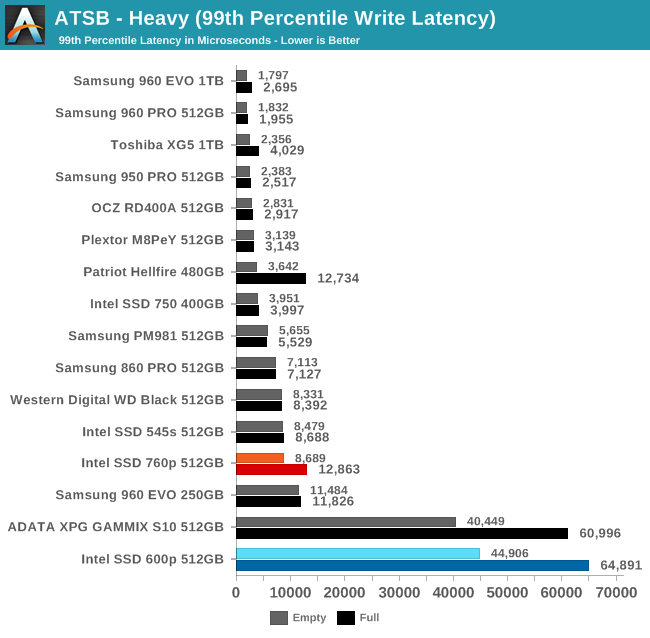
The Samsung MLC SSDs and the SanDisk Ultra 3D offer the best average and 99th percentile scores among the SATA drives, but even the current models from Intel and Crucial are close enough to be indistinguishable without benchmarking tools.
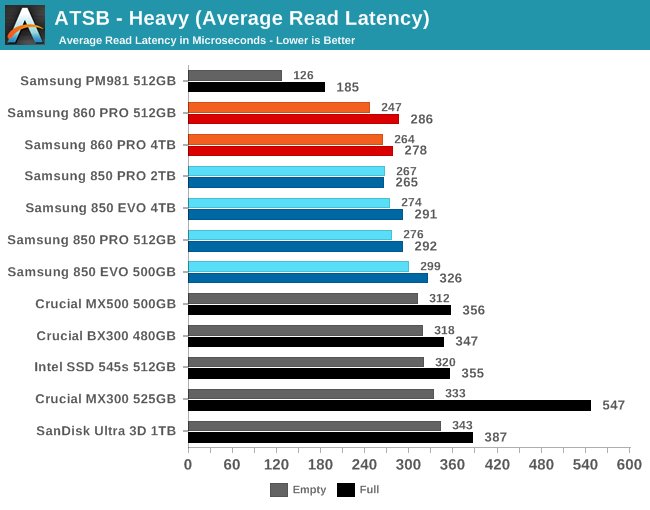
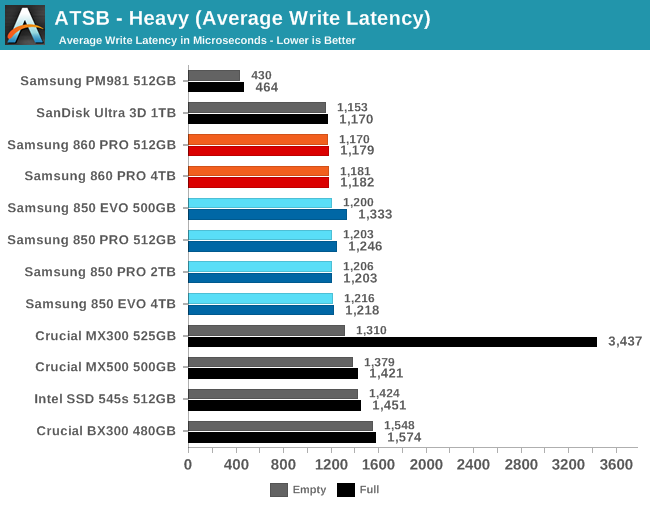
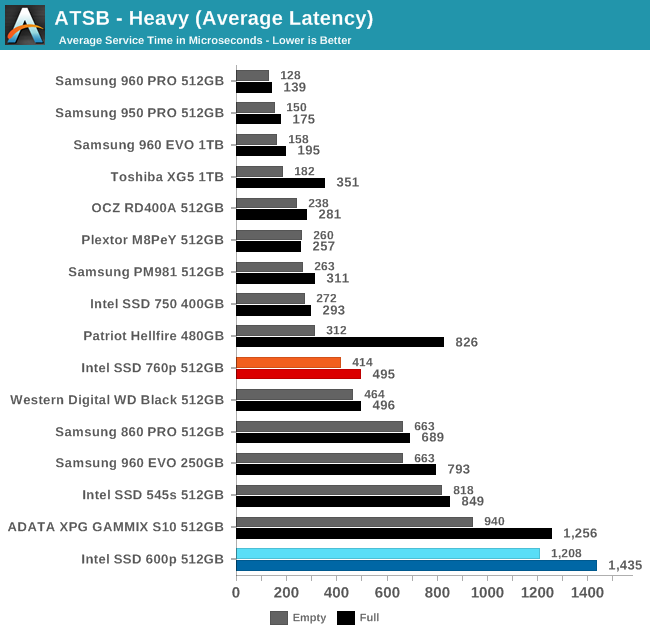
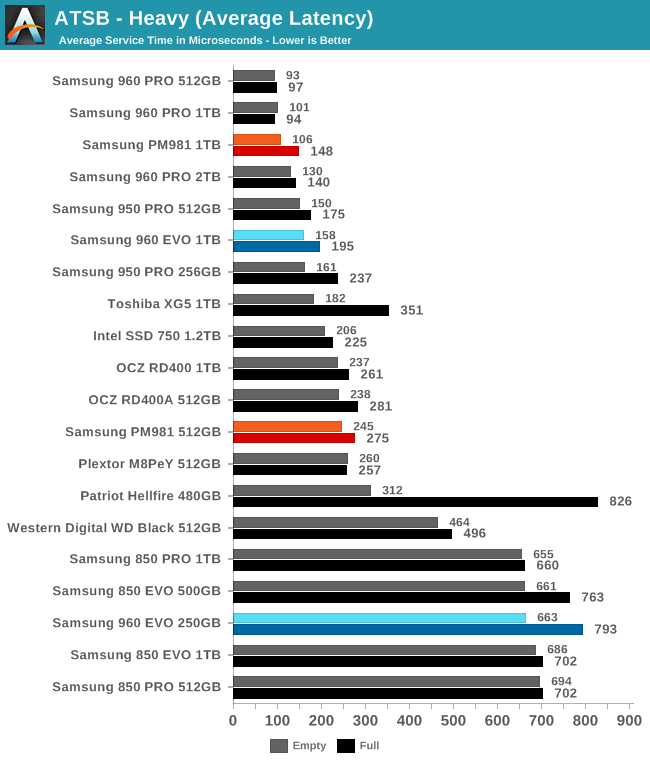
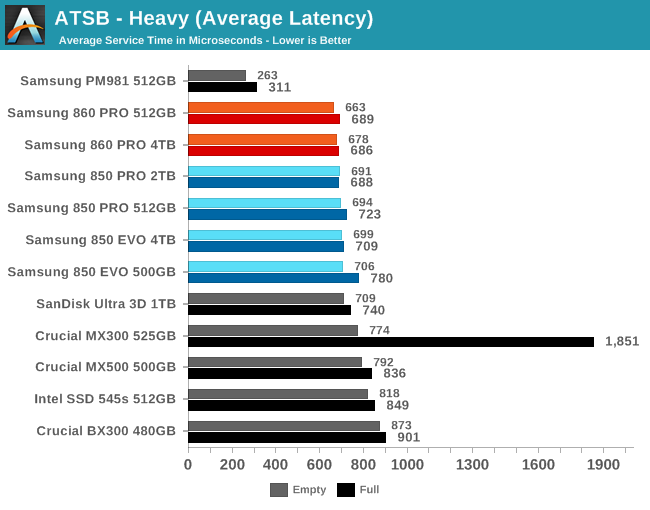
Most of the drives show small differences in average read latency between the full and empty drive test runs, but it's the write latencies that account for the bulk of the delays experienced during this test. The Samsung 860 PROs are among the several drives that show virtually no difference in average write latency when the drive is full.
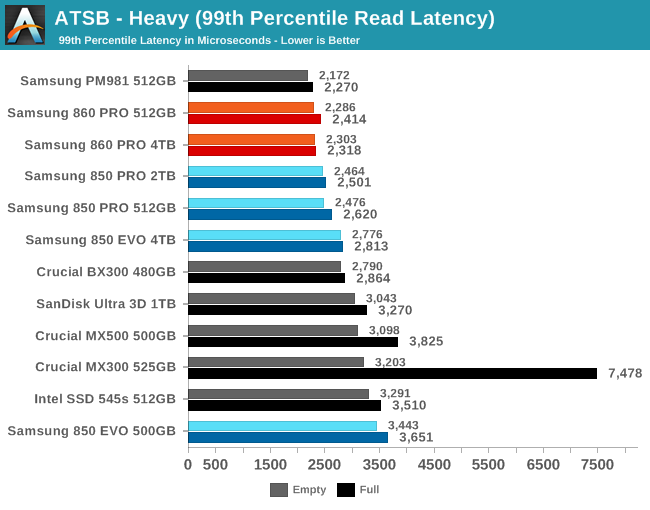
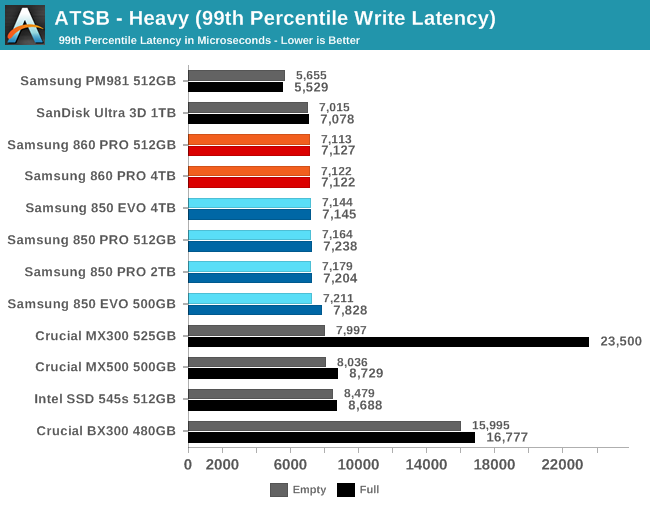
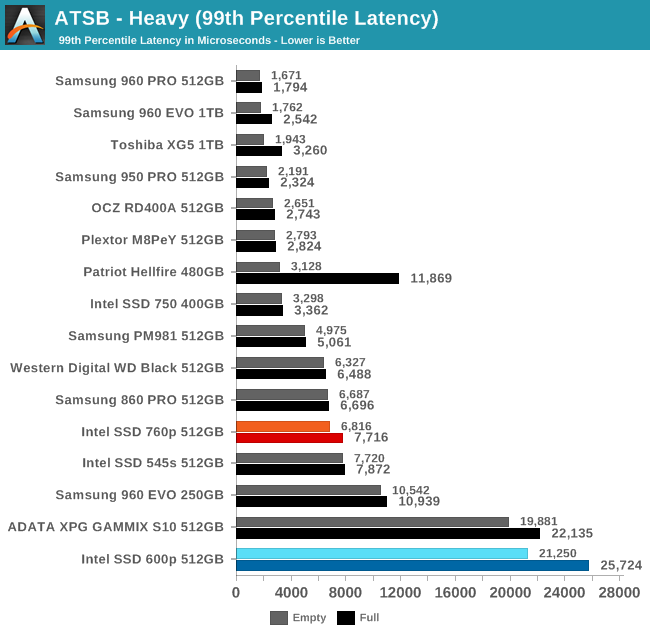
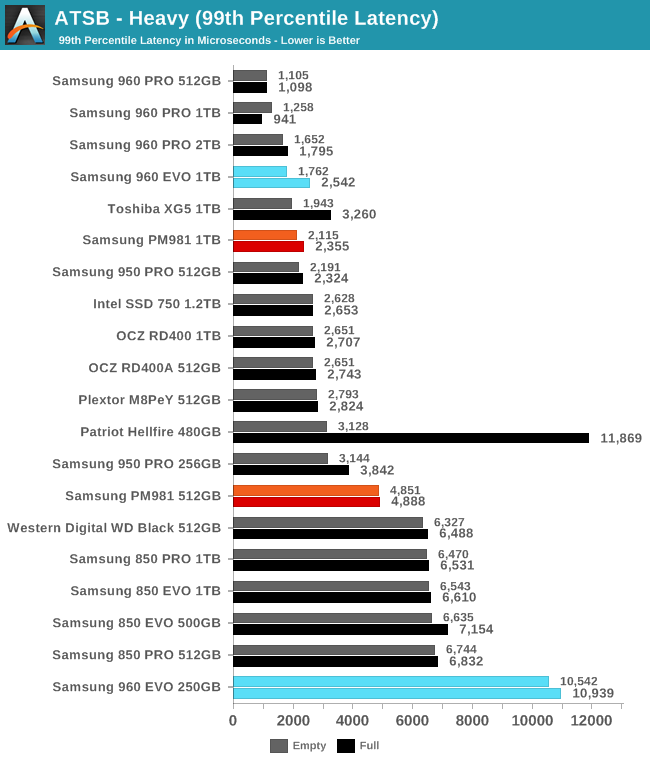
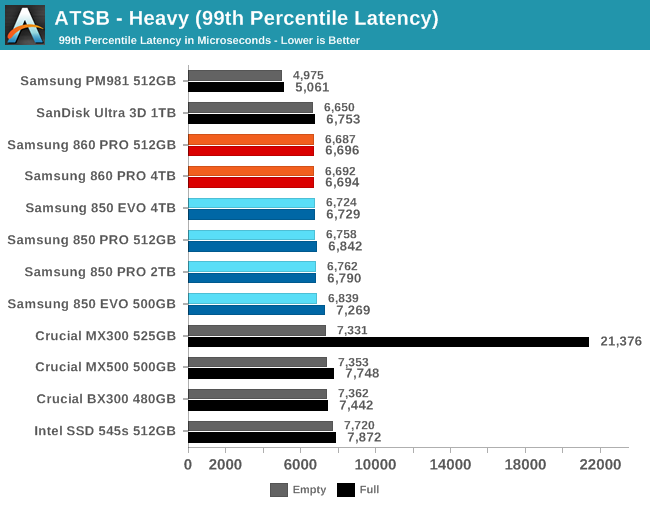
The 99th percentile read and write latency scores show that most of these SATA SSDs are equally competent at keeping latency under control. As usual, the Crucial MX300's full drive results stand out as particularly bad, and the BX300 is revealed to have a problem with high latency writes whether or not it is full.
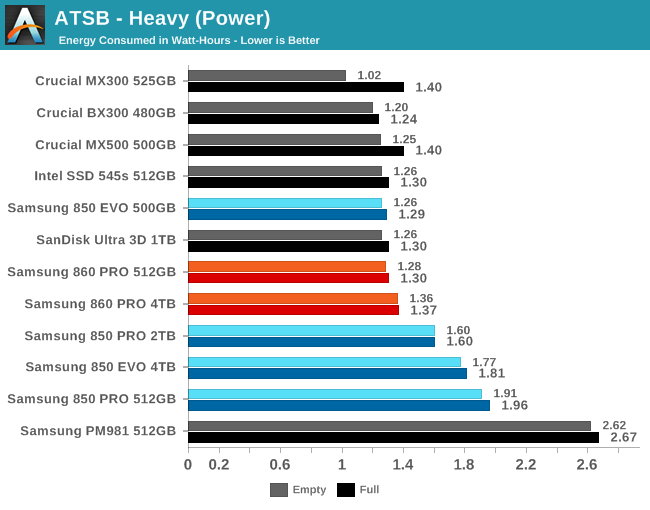
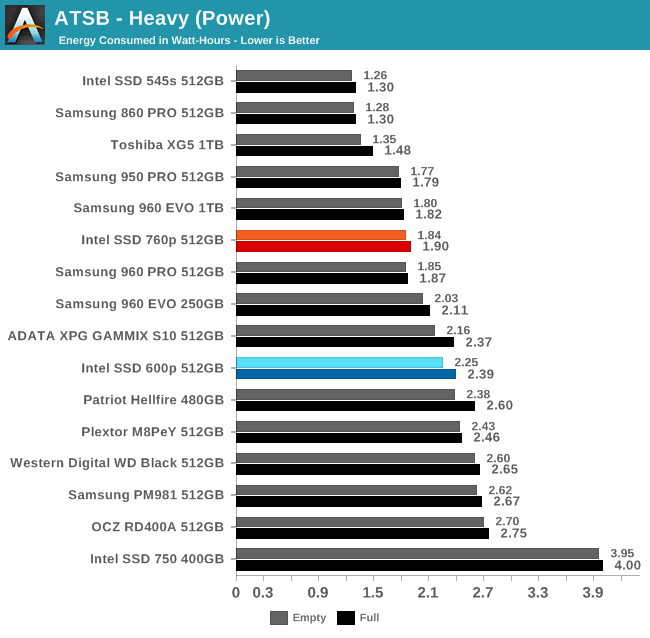
The 860 PRO mostly eliminates the gap in power efficiency relative to the modern competitors. The 4TB model requires slightly more power than the 512GB, but is still a substantial improvement over the multi-TB 850s.
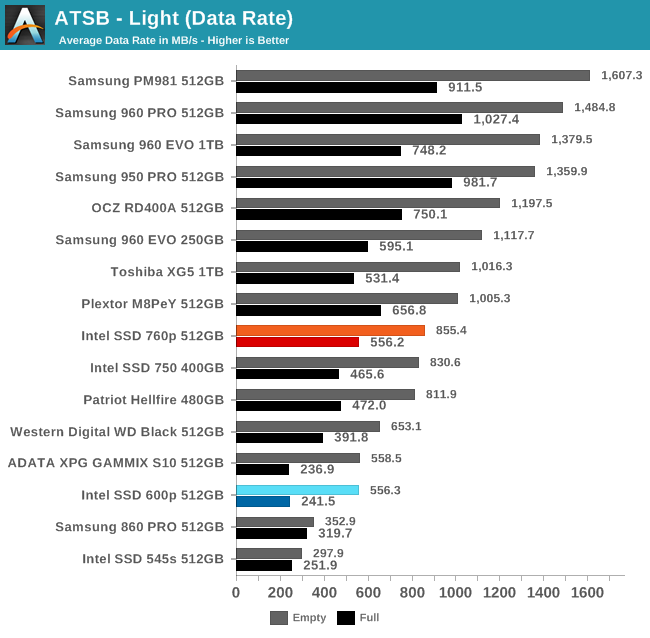
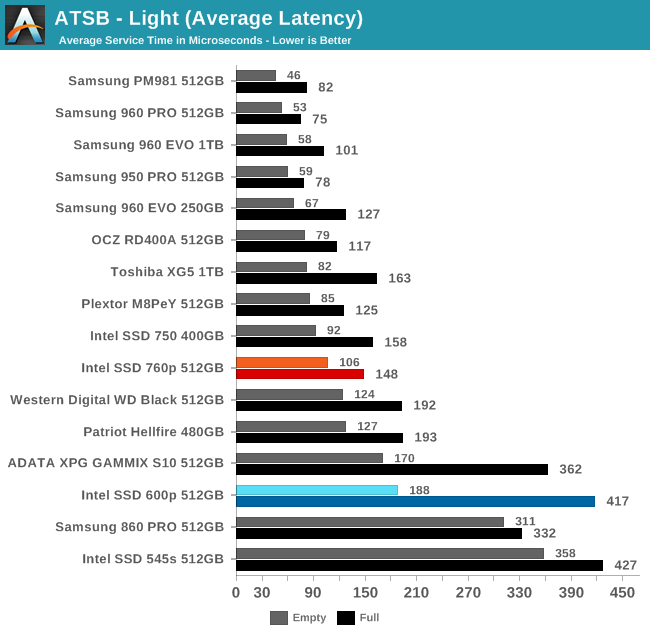
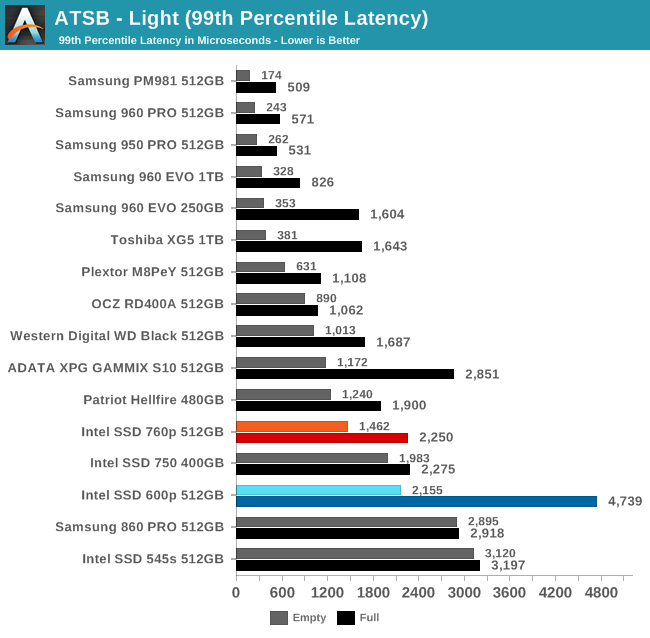
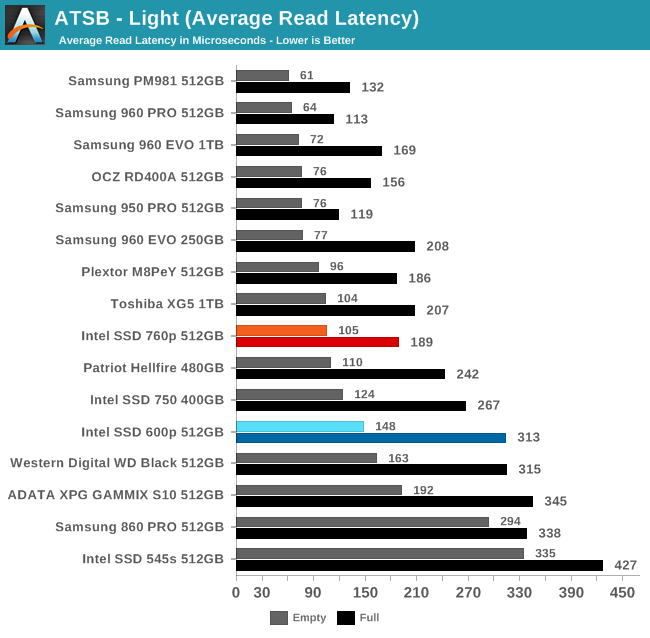
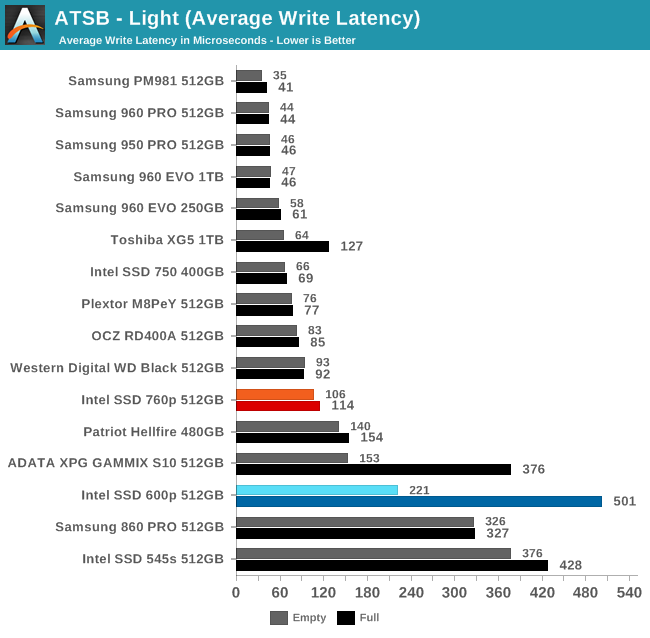
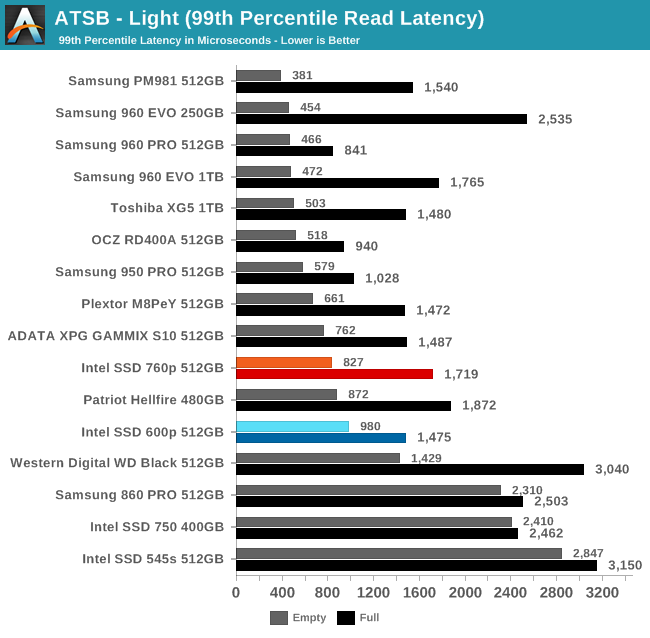
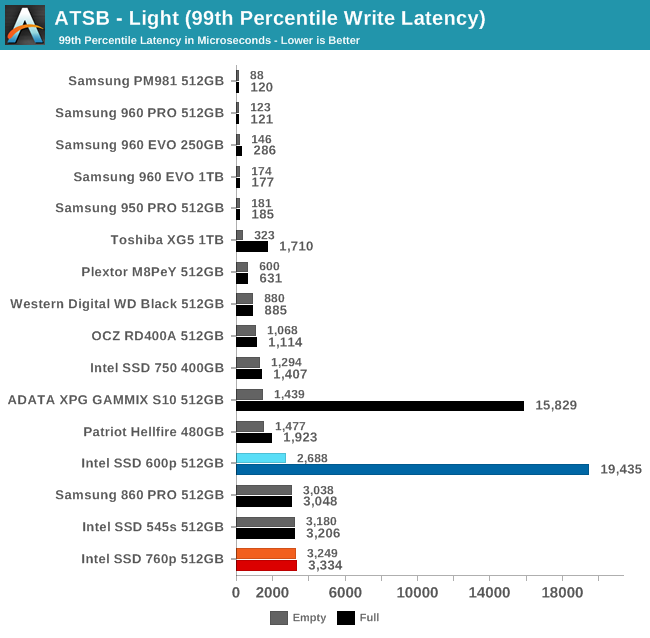
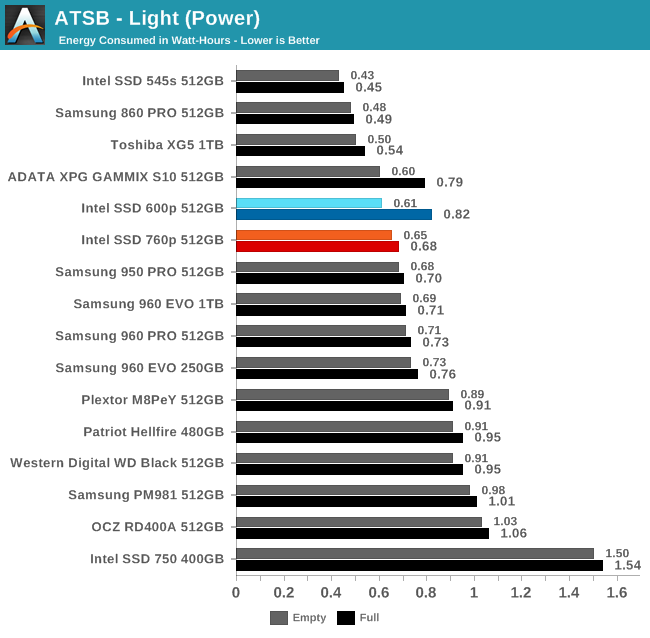
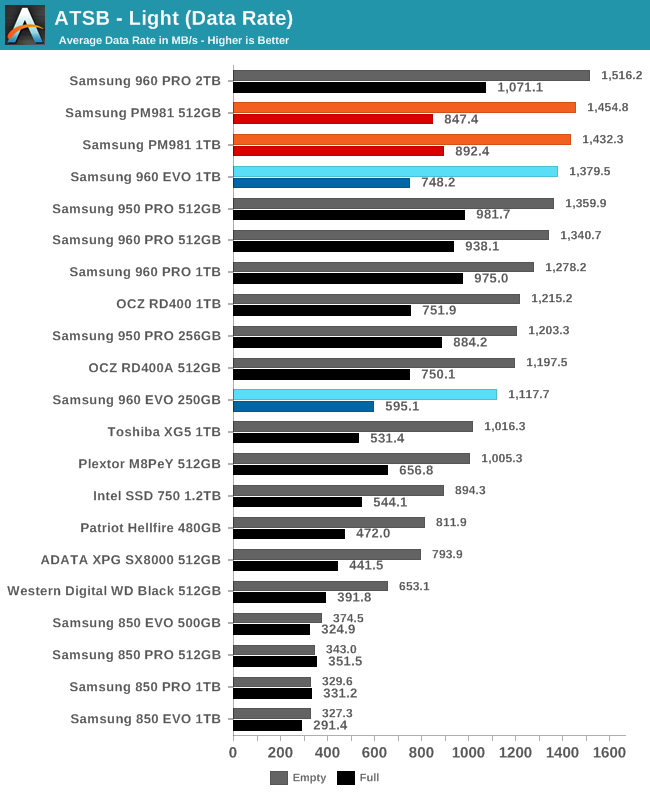
AnandTech Storage Bench - Light
Our Light storage test has relatively more sequential accesses and lower queue depths than The Destroyer or the Heavy test, and it's by far the shortest test overall. It's based largely on applications that aren't highly dependent on storage performance, so this is a test more of application launch times and file load times. This test can be seen as the sum of all the little delays in daily usage, but with the idle times trimmed to 25ms it takes less than half an hour to run. Details of the Light test can be found here. As with the ATSB Heavy test, this test is run with the drive both freshly erased and empty, and after filling the drive with sequential writes.
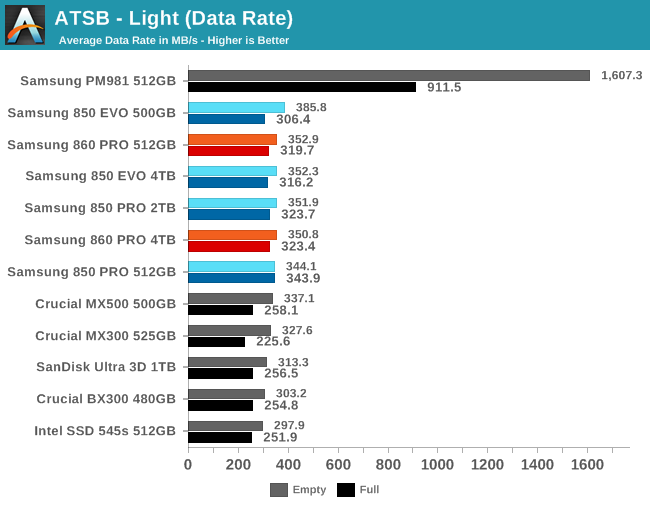
The Samsung SATA drives can mostly be distinguished from the other SATA drives by how much of their performance they retain when full; most of the competing drives show a bigger relative drop in average data rate. Between the Samsung drives, the differences are insignificant, and the peak performance of the competitors is pretty close to that of the Samsung drives.
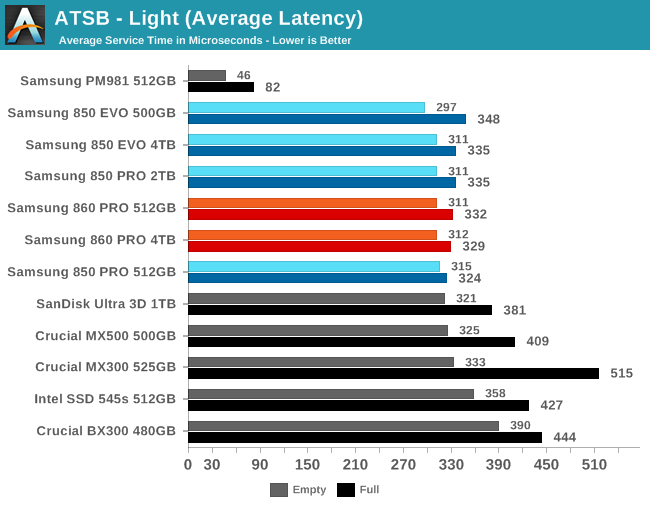
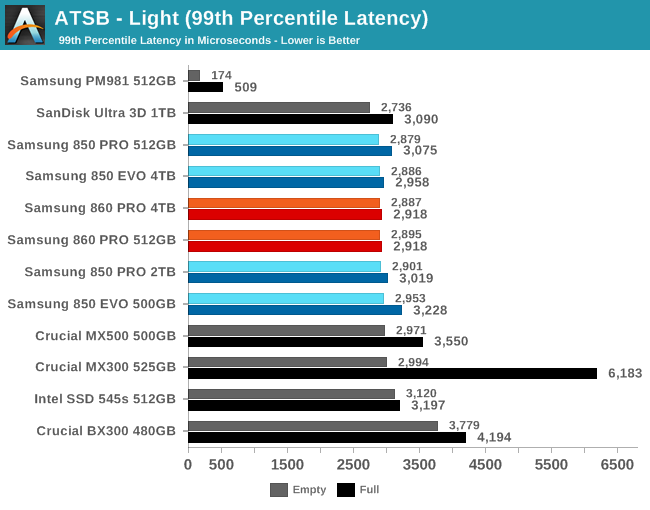
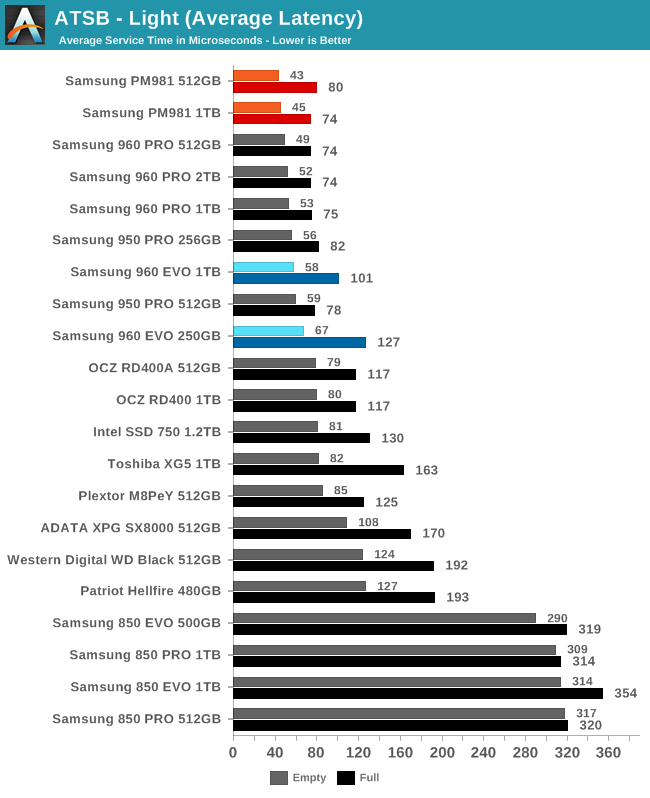
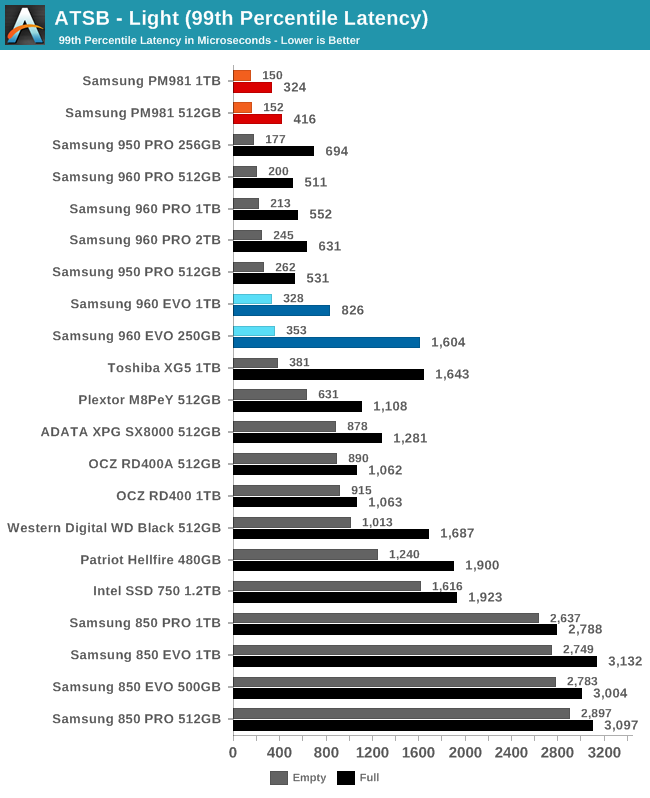
The average and 99th percentile latency scores on the Light test show that most of these SATA drives perform almost identically, but the 860 PROs have smaller full-drive performance hits than the other drives.
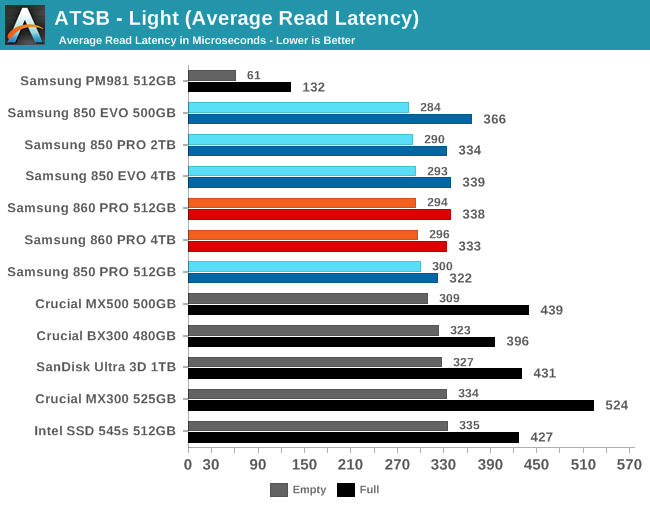
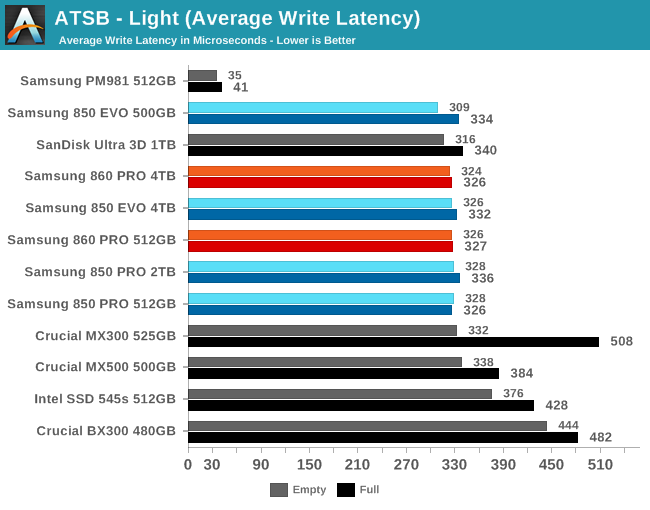
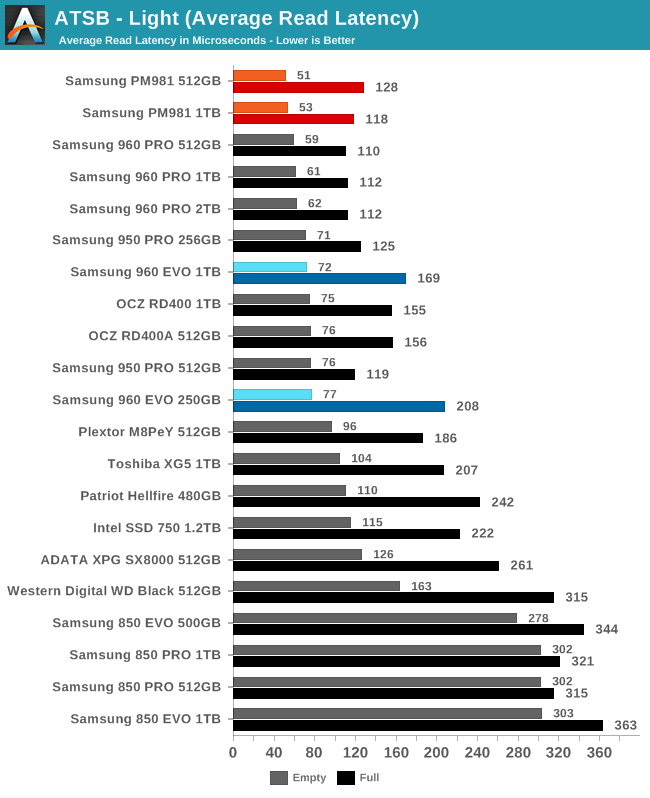
The average read latencies on the Light test tend to be a bit lower than the write latencies when the test is run on an empty drive, but when the drives are full, the read latencies climb to be slightly higher than the write latencies. The Samsung SATA SSDs all show smaller performance hits from being full than most of the competing SATA SSDs.
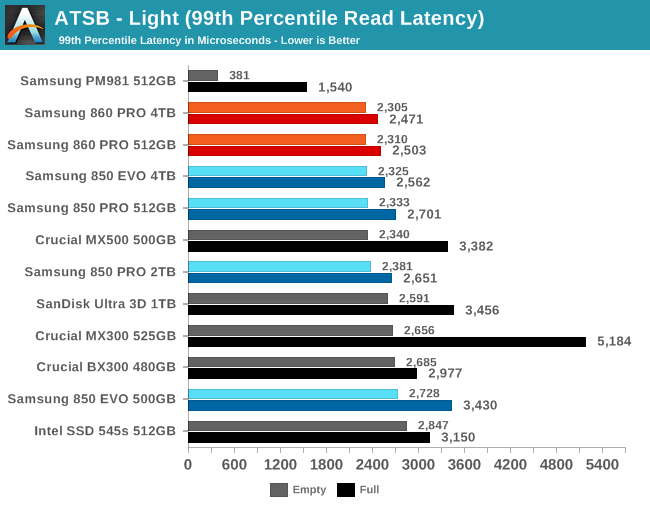
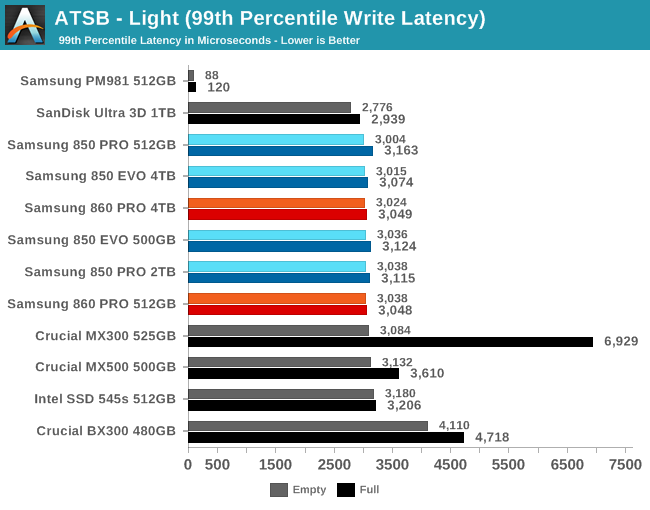
The 99th percentile read latencies are in the 2-3ms range and the 99th percentile write latencies hover right around 3ms. The Crucial drives provide the biggest outliers, but even the 5-6ms response times of the MX300 aren't bad as a worst-case performance measure.
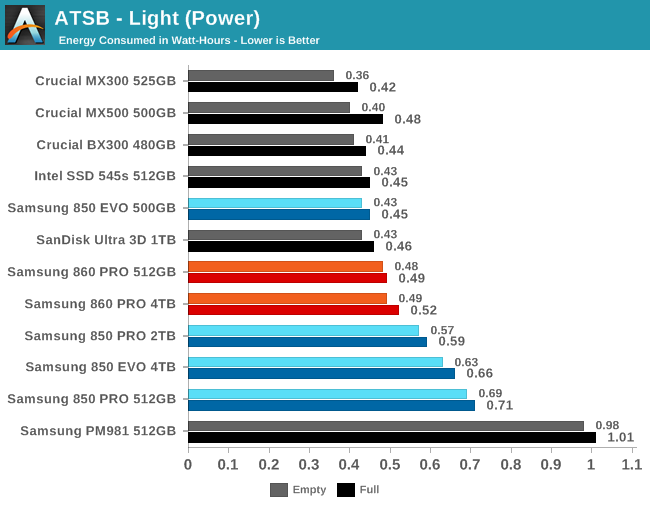
The 500 GB Samsung 850 EVO is once again the most efficient Samsung drive while the 860 PROs improve upon the poor efficiency of the 850 PROs but don't entirely catch up to the competition.
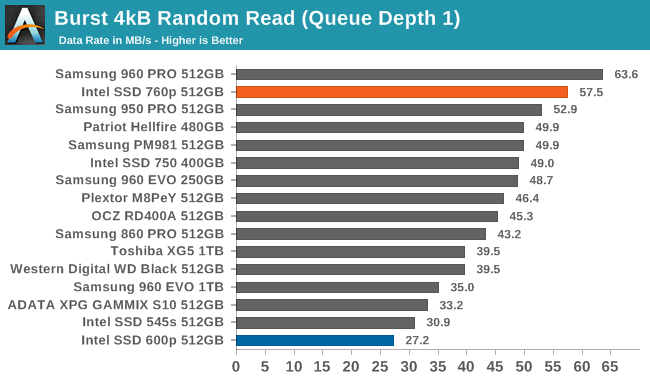
Random Read Performance
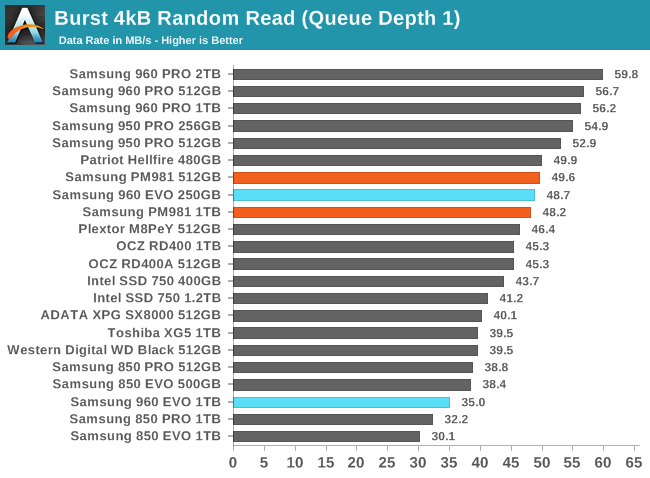
Our first test of random read performance uses very short bursts of operations issued one at a time with no queuing. The drives are given enough idle time between bursts to yield an overall duty cycle of 20%, so thermal throttling is impossible. Each burst consists of a total of 32MB of 4kB random reads, from a 16GB span of the disk. The total data read is 1GB.
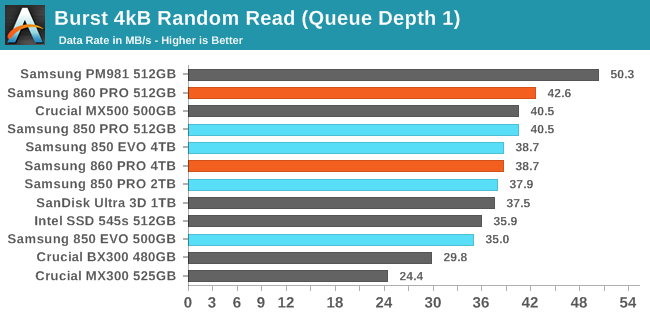
The 512GB Samsung 860 PRO has the fastest burst random read speed among these SATA SSDs, about 5% faster than the 850 PRO. The 4TB model is the same speed as the 4TB 850 EVO.
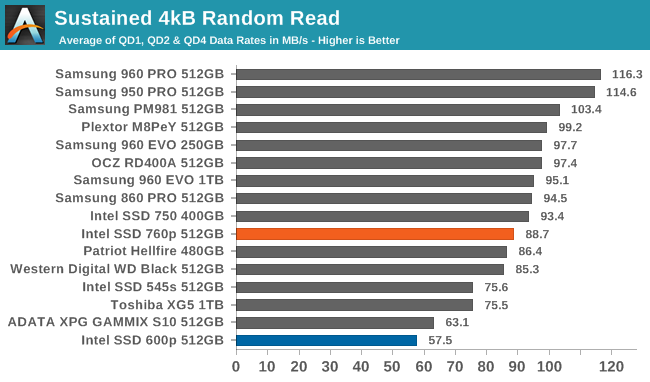
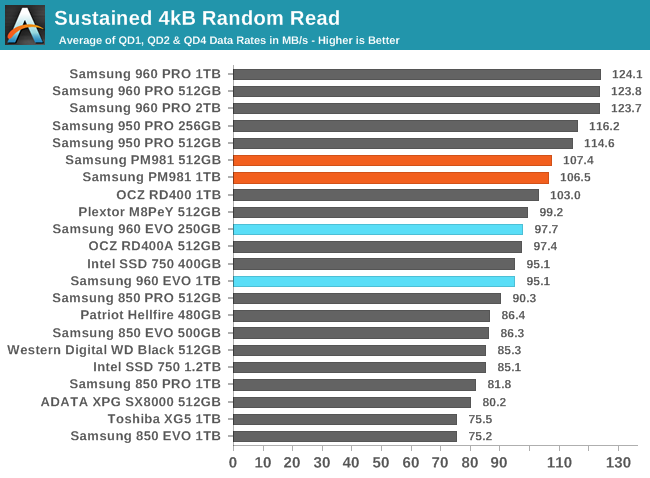
Our sustained random read performance is similar to the random read test from our 2015 test suite: queue depths from 1 to 32 are tested, and the average performance and power efficiency across QD1, QD2 and QD4 are reported as the primary scores. Each queue depth is tested for one minute or 32GB of data transferred, whichever is shorter. After each queue depth is tested, the drive is given up to one minute to cool off so that the higher queue depths are unlikely to be affected by accumulated heat build-up. The individual read operations are again 4kB, and cover a 64GB span of the drive.
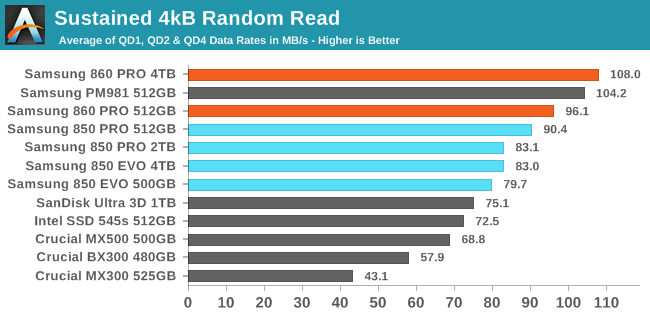
On the longer random read test involving some higher queue depths, the Samsung 860 PROs take a clear lead, and the 4TB model even outperforms the PM981 NVMe SSD.
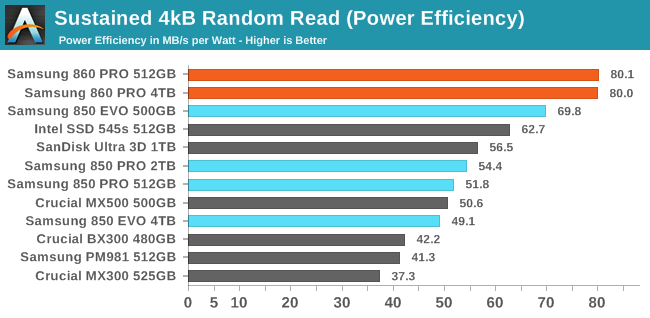
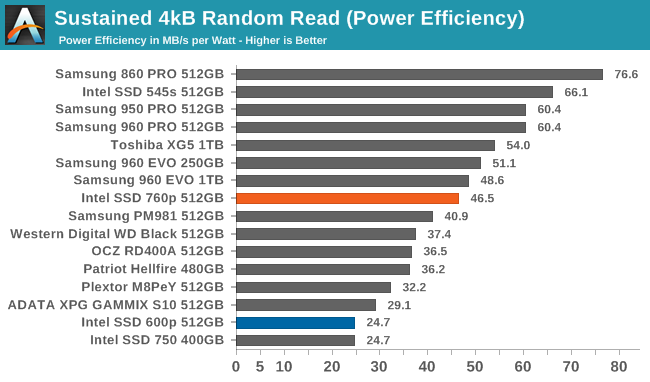
The two Samsung 860 PROs offer the same power efficiency, which is a huge step up from the 850 PRO's efficiency and significantly better than any of the competition.
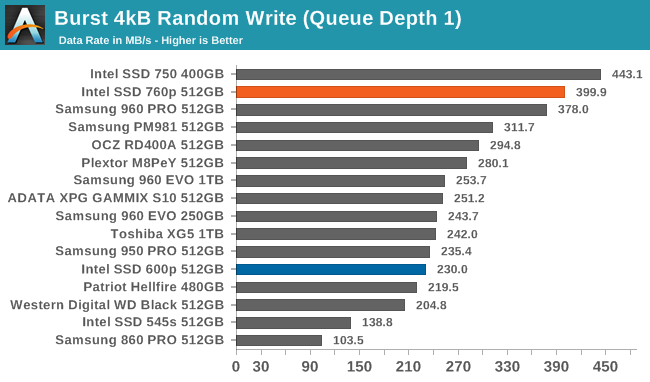
Random Write Performance
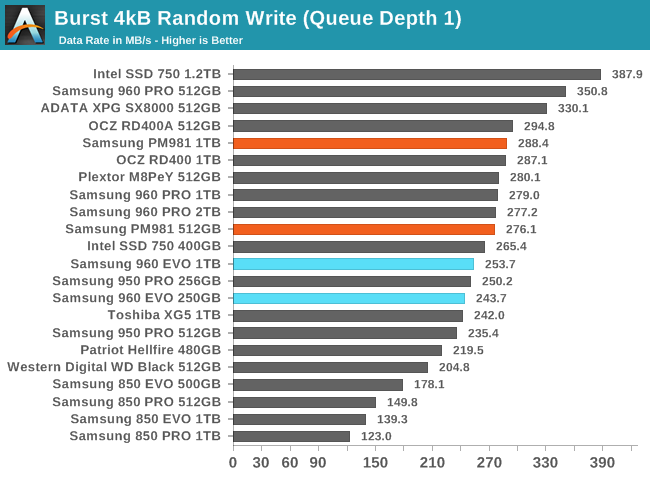
Our test of random write burst performance is structured similarly to the random read burst test, but each burst is only 4MB and the total test length is 128MB. The 4kB random write operations are distributed over a 16GB span of the drive, and the operations are issued one at a time with no queuing.
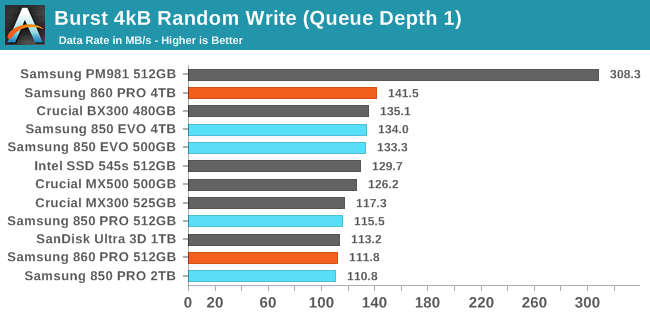
The 4TB 860 PRO has the fastest burst random write speed, while the 512GB model scores slightly worse than the 512GB 850 PRO.
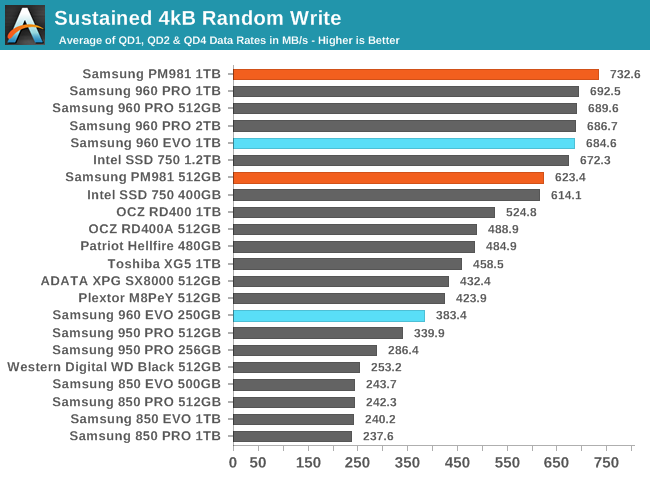
As with the sustained random read test, our sustained 4kB random write test runs for up to one minute or 32GB per queue depth, covering a 64GB span of the drive and giving the drive up to 1 minute of idle time between queue depths to allow for write caches to be flushed and for the drive to cool down.
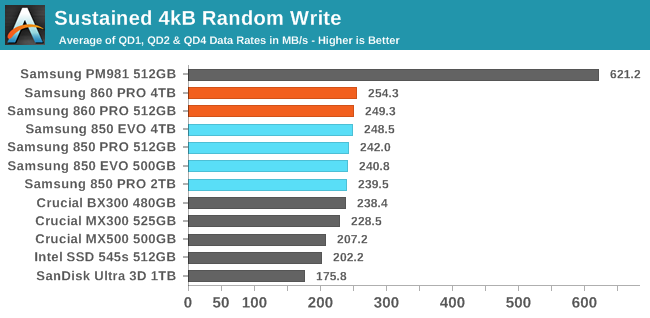
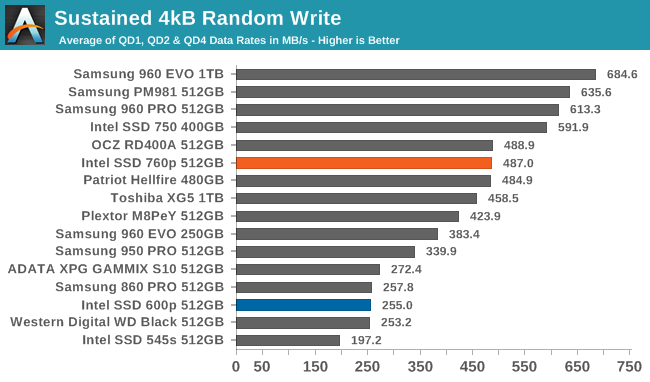
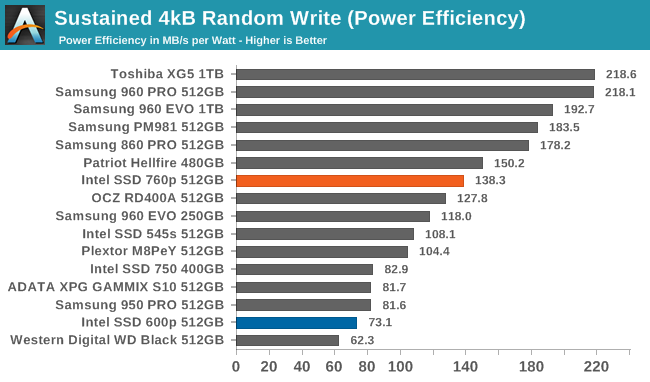
The sustained random write performance of the Samsung 860 PRO is a very slight improvement over their previous drives. Most of the competition is significantly slower on this test, but the Crucial BX300 is pretty close.
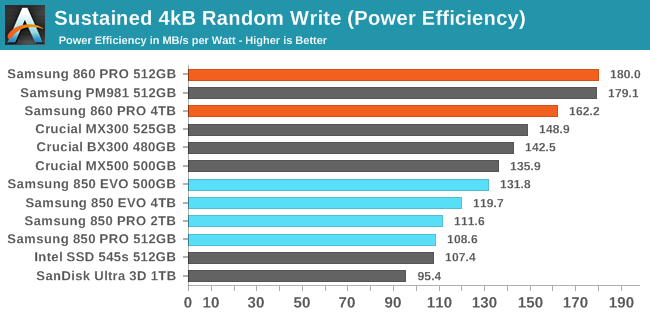
The Samsung 860 PROs are again the two most efficient SATA SSDs, and the 512GB model manages to match the efficiency of the much faster but more power hungry PM981.
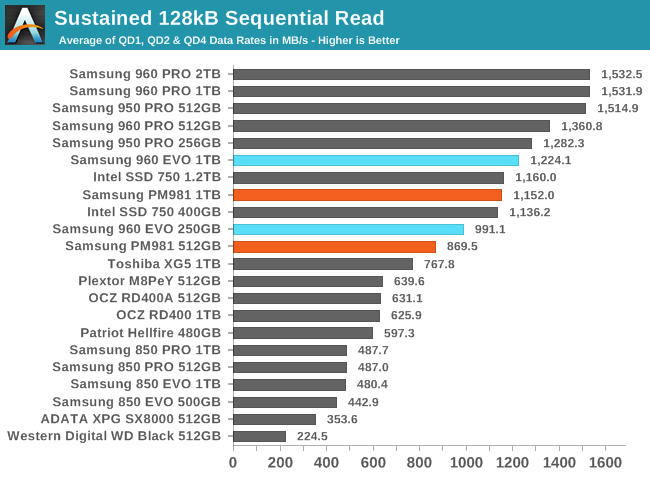
Sequential Read Performance
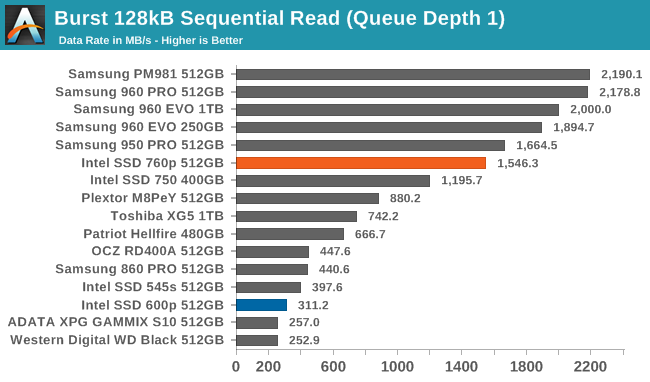
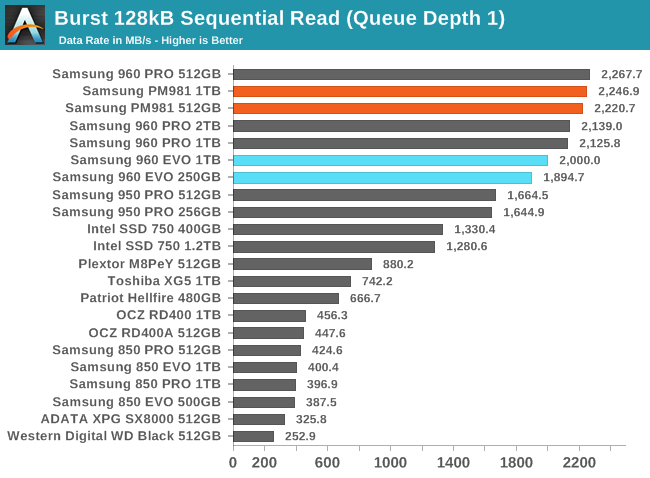
Our first test of sequential read performance uses short bursts of 128MB, issued as 128kB operations with no queuing. The test averages performance across eight bursts for a total of 1GB of data transferred from a drive containing 16GB of data. Between each burst the drive is given enough idle time to keep the overall duty cycle at 20%.
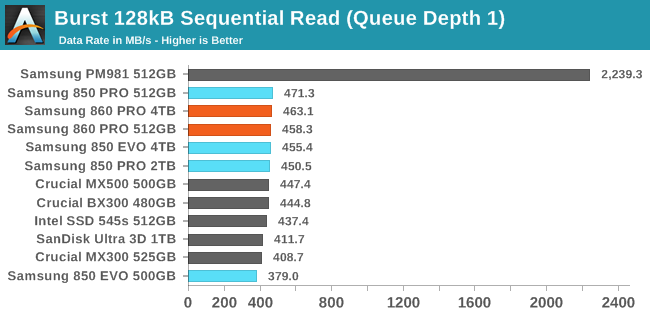
The burst sequential read speeds of the 860 PROs are good but not record setting, and the differences between the SATA drives are all dwarfed by the performance of the NVMe drive.
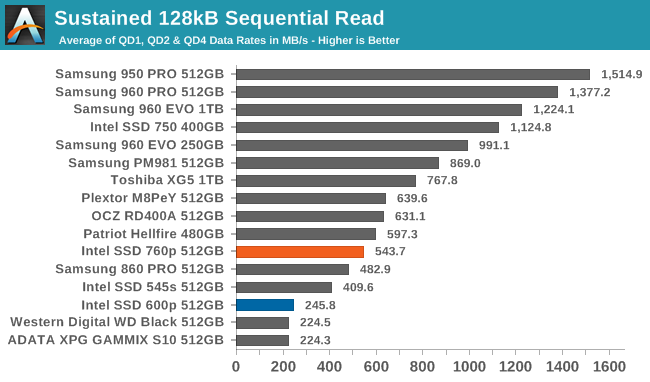
Our test of sustained sequential reads uses queue depths from 1 to 32, with the performance and power scores computed as the average of QD1, QD2 and QD4. Each queue depth is tested for up to one minute or 32GB transferred, from a drive containing 64GB of data.
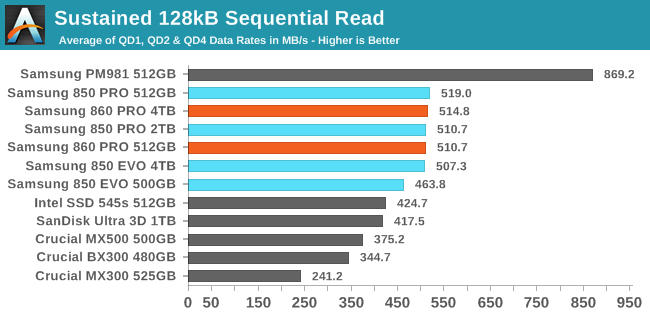
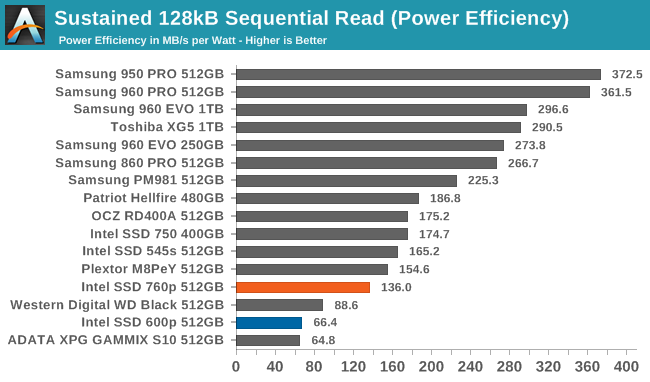
With the exception of the 500GB 850 EVO, all of the Samsung SATA drives in this bunch offer about the same sustained sequential read speed. These drives have a substantial advantage over the competing drives, which are led by the Intel 545s at about 85 MB/s slower than the 860 PRO.
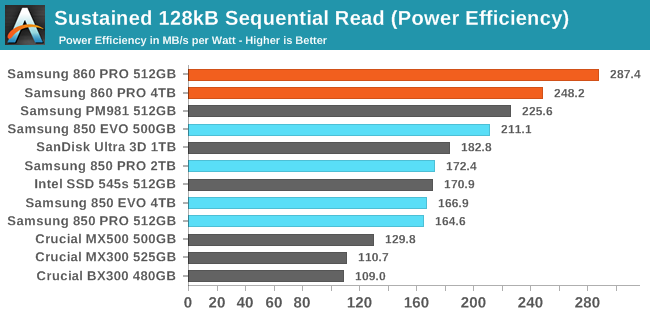
The two Samsung 860 PROs have the clear lead for power efficiency during sequential reads, above even the fast PM981 NVMe drive.
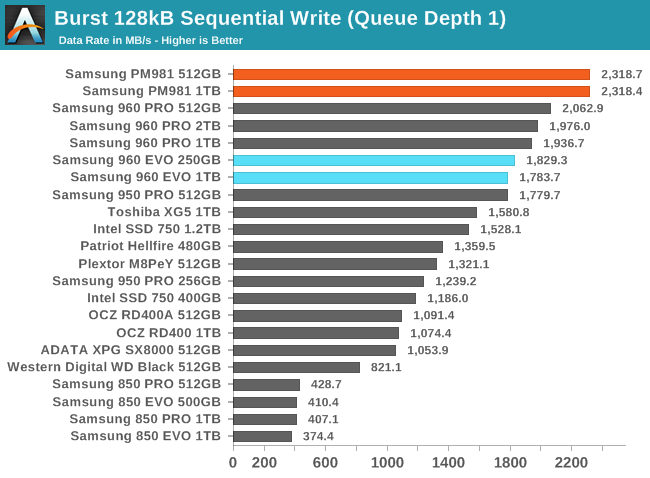
Sequential Write Performance
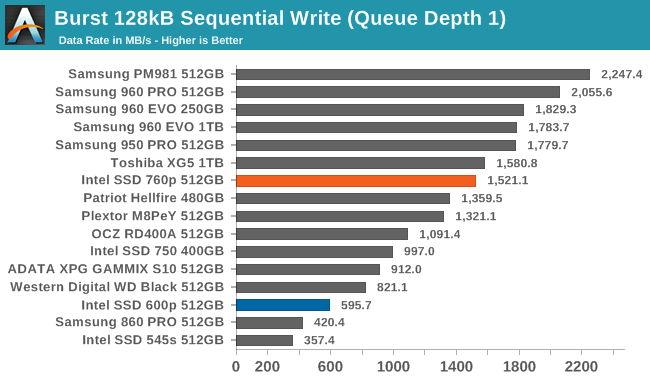
Our test of sequential write burst performance is structured identically to the sequential read burst performance test save for the direction of the data transfer. Each burst writes 128MB as 128kB operations issued at QD1, for a total of 1GB of data written to a drive containing 16GB of data.
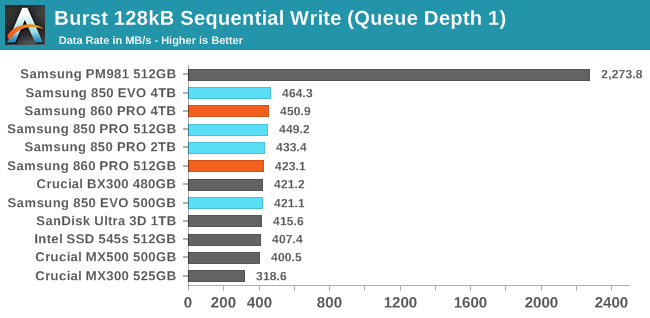
Both models of the Samsung 860 PRO show a bit of a regression on the burst sequential write test, with the 4TB 860 PRO coming in at 13 MB/s slower than the 4TB 850 EVO, and the 512GB 860 PRO is behind the 512GB 850 PRO by twice that margin.
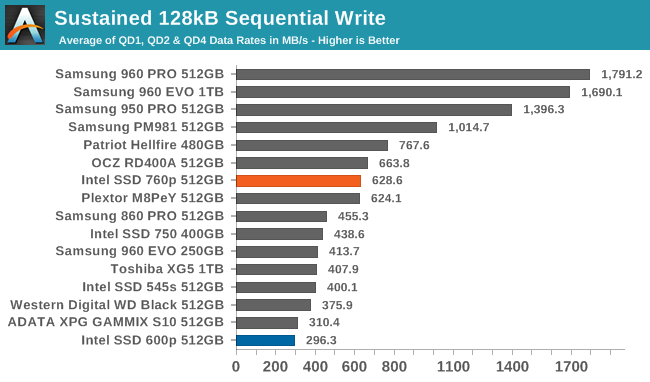
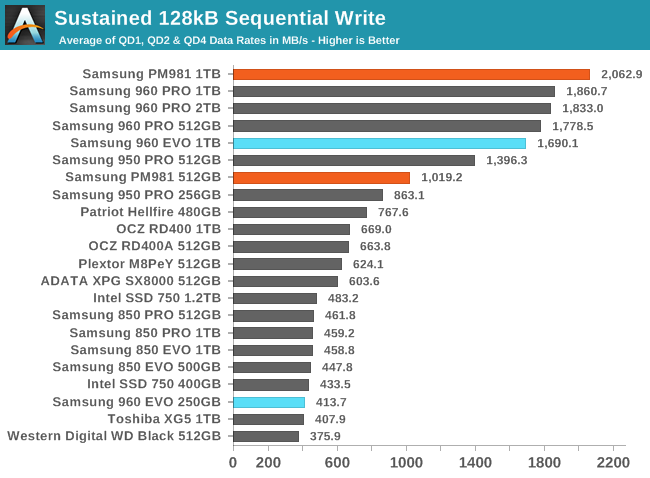
Our test of sustained sequential writes is structured identically to our sustained sequential read test, save for the direction of the data transfers. Queue depths range from 1 to 32 and each queue depth is tested for up to one minute or 32GB, followed by up to one minute of idle time for the drive to cool off and perform garbage collection. The test is confined to a 64GB span of the drive.
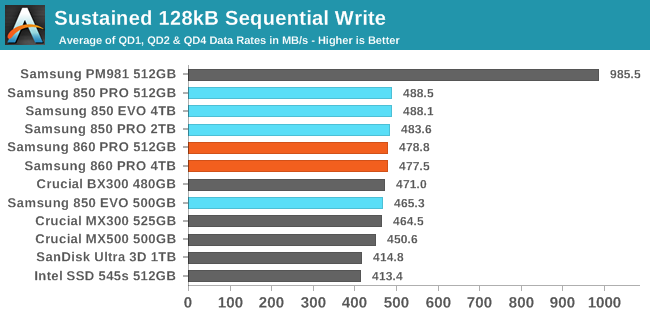
The sustained sequential write speeds of the Samsung 860 PRO are slightly lower than some of the 850s, but not noticeably. Only the Intel 545s and SanDisk Ultra 3D are slow enough to really care about.
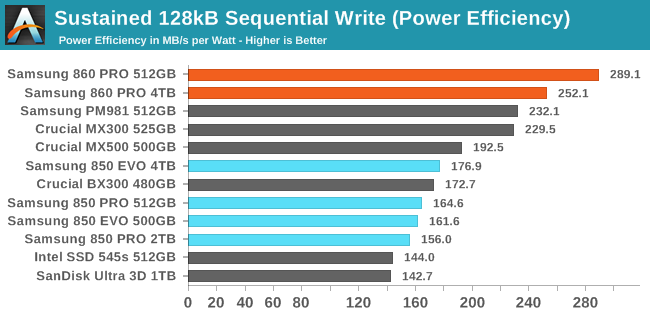
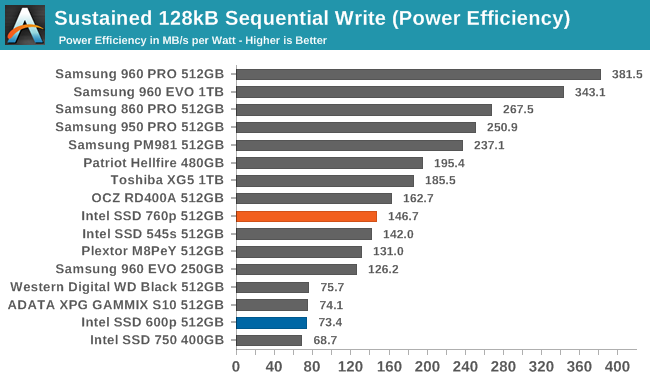
The power efficiency of the 860 PRO continues to be a huge improvement over the 850s, with the 512GB 860 PRO taking a big lead over everything else in its class.
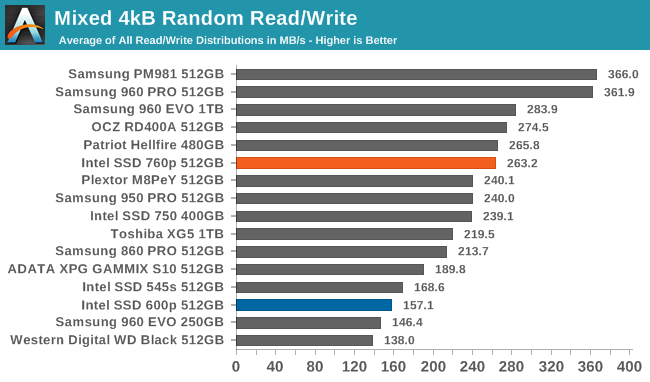
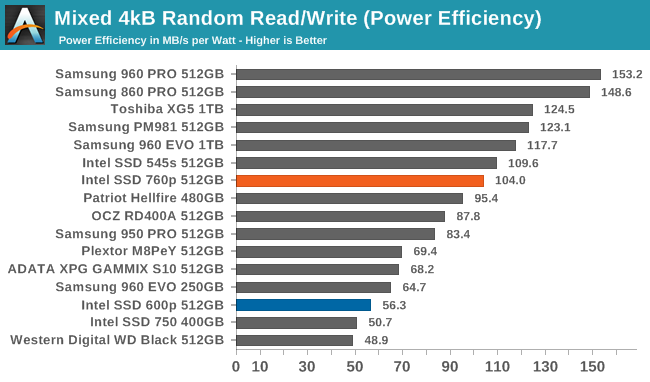
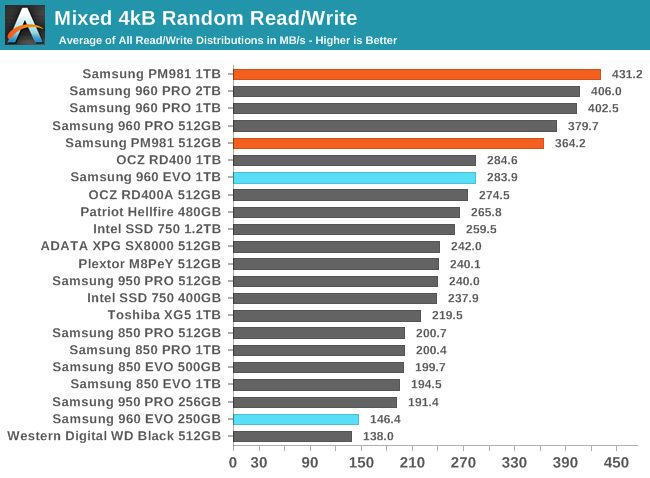
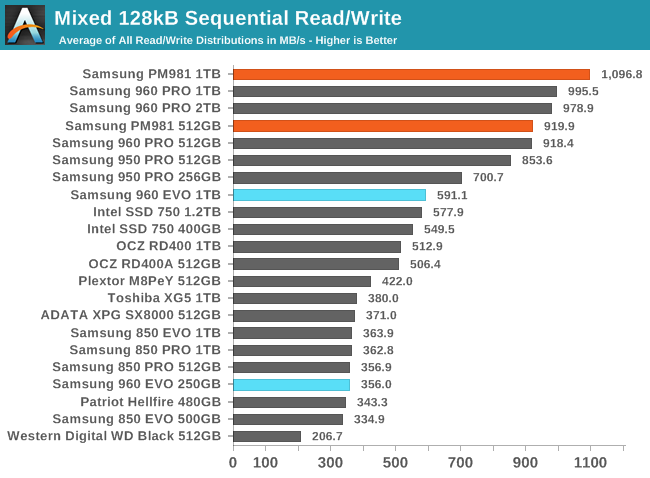
Mixed Random Performance
Our test of mixed random reads and writes covers mixes varying from pure reads to pure writes at 10% increments. Each mix is tested for up to 1 minute or 32GB of data transferred. The test is conducted with a queue depth of 4, and is limited to a 64GB span of the drive. In between each mix, the drive is given idle time of up to one minute so that the overall duty cycle is 50%.
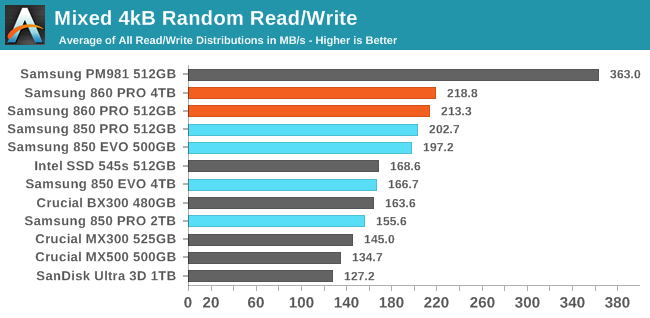
The Samsung 860 PRO is the fastest SATA SSD on our mixed random I/O test, with the 4TB model scoring slightly better than the 512GB model. This is a big improvement over the multi-TB 850s which were substantially slower than the half-TB models.
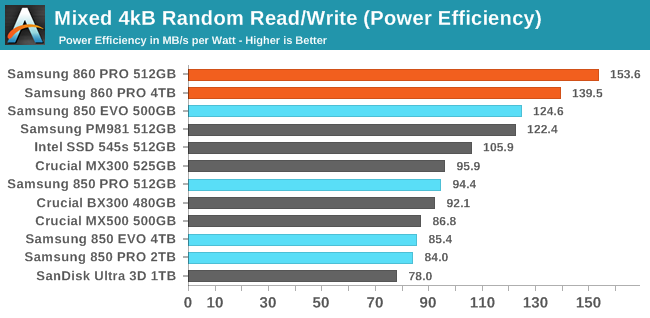
The 850 PRO is again the most efficient drive in the bunch, but the 512GB model is clearly more efficient than the 4TB despite being a bit slower.
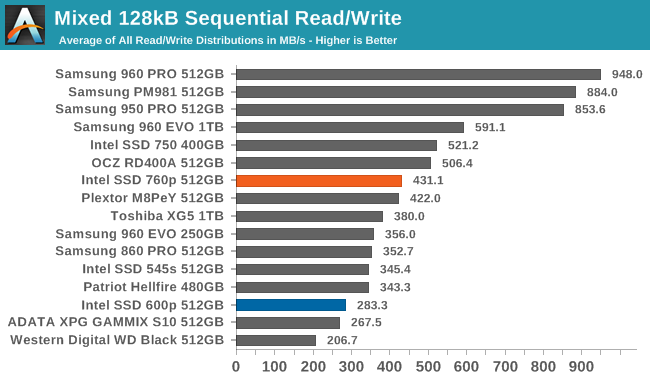
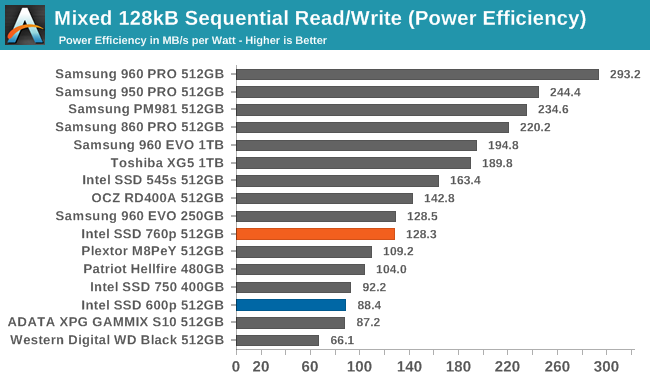
Mixed Sequential Performance
Our test of mixed sequential reads and writes differs from the mixed random I/O test by performing 128kB sequential accesses rather than 4kB accesses at random locations, and the sequential test is conducted at queue depth 1. The range of mixes tested is the same, and the timing and limits on data transfers are also the same as above.
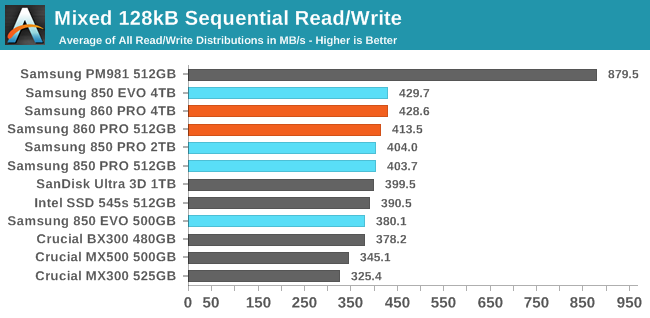
Neither capacity of the Samsung 860 PRO quite manages to top the performance of the 4TB 850 EVO on the mixed sequential test, but they're close enough.
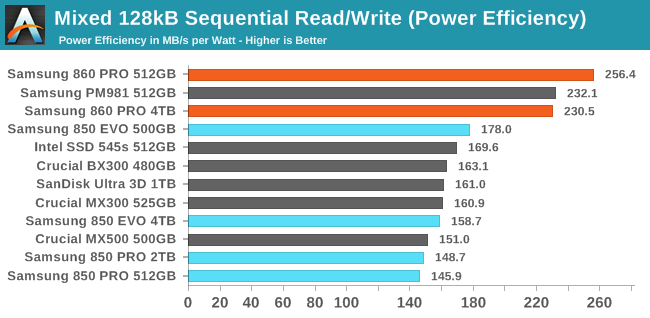
The power efficiency gap between the 860 PROs and the rest of the SATA SSDs is huge. The 512GB model takes first place, and the 4TB model is tied with the PM981 for second place efficiency.
Power Management
Real-world client storage workloads leave SSDs idle most of the time, so the active power measurements presented earlier in this review only account for a small part of what determines a drive's suitability for battery-powered use. Especially under light use, the power efficiency of a SSD is determined mostly be how well it can save power when idle.
SATA SSDs are tested with SATA link power management disabled to measure their active idle power draw, and with it enabled for the deeper idle power consumption score and the idle wake-up latency test. Our testbed, like any ordinary desktop system, cannot trigger the deepest DevSleep idle state.
Idle power management for NVMe SSDs is far more complicated than for SATA SSDs. NVMe SSDs can support several different idle power states, and through the Autonomous Power State Transition (APST) feature the operating system can set a drive's policy for when to drop down to a lower power state. There is typically a tradeoff in that lower-power states take longer to enter and wake up from, so the choice about what power states to use may differ for desktop and notebooks.
We report two idle power measurements. Active idle is representative of a typical desktop, where none of the advanced PCIe link or NVMe power saving features are enabled and the drive is immediately ready to process new commands. The idle power consumption metric is measured with PCIe Active State Power Management L1.2 state enabled and NVMe APST enabled.
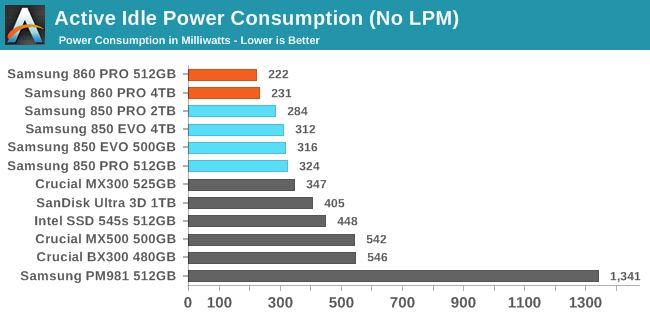
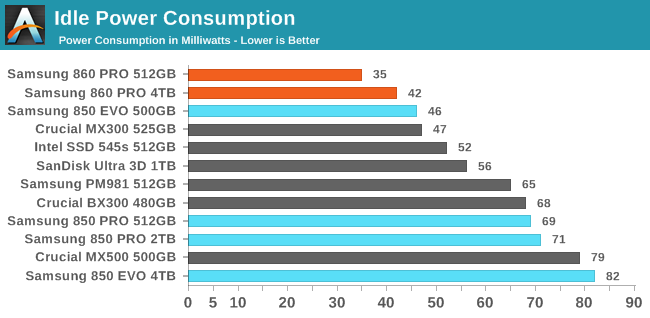
In addition to load power efficiency improvements, the 860 PRO brings modest improvements to idle power consumption. Samsung's active idle power consumption was already pretty good, but the 860 PRO provides further savings. The idle power in slumber state is a big improvement for both of the 860 PROs, likely due to the use of LPDDR4.
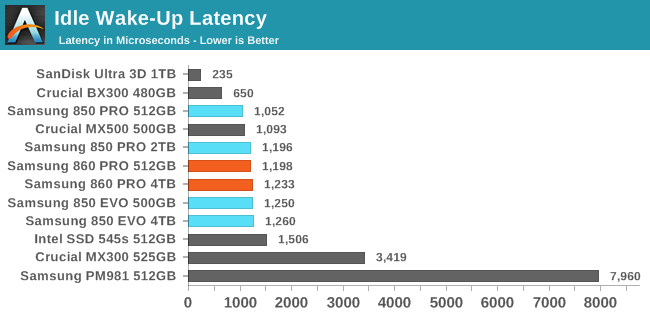
The idle wake-up latency of Samsung's drives hasn't changed, and is still hovering just above 1ms.
출처 - https://www.anandtech.com


%20SSD%20Review%3A%20Replacing%20A%20Legend&txt=%3Cimg%20alt%3D%22%22%20src%3D%22https%3A%2F%2Fimages.anandtech.com%2Fdoci%2F12348%2F860_512gb_575px.jpg%22%3E)