'월드 벤치마크'에 해당되는 글 109건

  1. 2019.07.21 RX 5700 XT vs RTX 2070 SUPER vs RTX 2080 벤치마크 by 랩터 인터내셔널
  2. 2019.07.21 AMD Ryzen 7 3700x vs 인텔 i7 9700k 벤치마크 by 랩터 인터내셔널
  3. 2019.07.21 AMD 라이젠9 3900X vs 인텔 Core i9-9900K 게임 성능 대결 by 랩터 인터내셔널
  4. 2019.07.21 AMD 라이젠 3600 VS 인텔 9600K 성능 승부 by 랩터 인터내셔널
  5. 2019.07.13 엔비디아 지포스RTX 2070 Super & RTX 2060 Super 리뷰 by 랩터 인터내셔널
  6. 2019.07.13 AMD 신형 3700X, 3900X vs 인텔 9900K, 9700K 성능 승부 by 랩터 인터내셔널
  7. 2019.04.21 삼성 갤럭시 폴드 리뷰 : 더 버지 / 월 스트리트 저널 / CNBC by 랩터 인터내셔널
  8. 2019.03.01 삼성 갤럭시S10 : 엑시노스 9820 vs 스냅드래곤 855 승부 by 랩터 인터내셔널
  9. 2019.02.26 엔비디아 지포스GTX 1660Ti 6GB 성능 리뷰 by 랩터 인터내셔널
  10. 2019.02.08 AMD 라데온7 16GB 성능 벤치마크 (Radeon VII) by 랩터 인터내셔널


RADEON RX 5700 XT vs GeForce RTX 2070 SUPER vs RTX 2080 (i9 9900k)

World of Warships - https://wgaffiliate.com/?a=2736&c=469...

Games :
Assassin's Creed Odyssey
Battlefield 5 - 01:00
Kingdom Come Deliverance - 02:22
Metro Exodus - 03:45
Forza Horizon 4 - 05:21
The Witcher 3 - 06:26
The Division 2 - 08:14
Rage 2 - 09:22
Rainbow Six Siege - 10:21

System:
Windows 10 Pro
Intel i9 9900k 5.0GHz
Asus ROG Strix Z390-F Gaming
RADEON RX 5700 XT 8GB
GeForce RTX 2070 Super 8GB
GeForce RTX 2080 8GB
16GB RAM 3200Mhz

반응형
Posted by 랩터 인터내셔널


Games :
Assassin's Creed Odyssey
Project Cars - 01:10
Battlefield 5 - 02:27
Rainbow Six Siege - 03:37
The Witcher 3 - 04:27
Metro Exodus - 05:38
Grand Theft Auto V - 06:43
HITMAN 2 - 08:04
The Division 2 - 09:09
Watch Dogs 2 - 10:05

System:
Windows 10 Pro
Intel i7 9700k 3.6GHz
Asus ROG Strix Z390-F Gaming
AMD Ryzen 7 3700x 3.6GHz
GIGABYTE X570 AORUS PRO
GeForce RTX 2080 OC 8GB
16Gb RAM 3600Mhz

반응형
Posted by 랩터 인터내셔널

  Intel Core i9-9900K AMD Ryzen 9 3900X
Architecture Coffee Lake Zen 2
Socket 1151 AM4
Cores / Threads 8 / 16 12 / 24
Base Frequency (GHz) 3.6 3.8
Boost Frequency
(Active Cores - GHz)
1/2 Cores - 5.0
3/4 Cores - 4.8
5-8 Cores - 4.7
4.6 (1 Core)
L3 Cache (MB) 16 64
Process 14nm++ 7nm
TDP (Watts) 95 105
Memory Speed (official) DDR4-2666 DDR4-3200
Memory Controller Dual-Channel Dual-Channel
Integrated UHD Graphics GT2 - Up to 1200MHz No
Recommended Customer Pricing $488 $499


AMD의 신형 12코어 라이젠9 3900X와 인텔의 8코어 Core i9-9900K 게임 성능 대결 결과입니다.


출처 - https://www.tomshardware.com

반응형
Posted by 랩터 인터내셔널


라이젠 3600 과 인텔 9600K 의 기본 벤치 및 게임성능을 비교 테스트 해봤습니다.
라이젠 3600의 경우 아직까지 바이오스 부분과 안정화 그리고 게임의 경우 최적화 부분에서 약간 문제가 있는것 같습니다.


How does AMD’s new Ryzen 5 3600 CPU compare against Intel’s i5-9600K? I’ve benchmarked games at 1080p and 1440p resolutions to show you the gaming differences, both at stock settings and while overclocked.

반응형
Posted by 랩터 인터내셔널

NVIDIA GeForce RTX 20 Series Lineup
Card Price
GeForce RTX 2080 Ti MSRP: $999
Street Price: $1249
GeForce RTX 2080 Super MSRP: $699
GeForce RTX 2080 EOL ($699)
GeForce RTX 2070 Super MSRP: $499
GeForce RTX 2070 EOL ($499)
GeForce RTX 2060 Super MSRP: $399
GeForce RTX 2060 MSRP & Street Price: $349


RTX 2060 Super 모델은 기존 2060보다 50달러 증가된 399달러, RTX 2070 Super 모델은 같은 가격으로 책정


NVIDIA GeForce Specification Comparison
  RTX 2080 RTX 2070 Super RTX 2070 RTX 2060 Super RTX 2060
CUDA Cores 2944 2560 2304 2176 1920
ROPs 64 64 64 64 48
Core Clock 1515MHz 1605MHz 1410MHz 1470MHz 1365MHz
Boost Clock 1710MHz 1770MHz 1620MHz 1650MHz 1680MHz
Memory Clock 14Gbps GDDR6 14Gbps GDDR6 14Gbps GDDR6 14Gbps GDDR6 14Gbps GDDR6
Memory Bus Width 256-bit 256-bit 256-bit 256-bit 192-bit
VRAM 8GB 8GB 8GB 8GB 6GB
Single Precision Perf. 10.1 TFLOPS 9.1 TFLOPS 7.5 TFLOPS 7.2 TFLOPS 6.5 TFLOPS
TDP 215W 215W 175W 175W 160W
GPU TU104 TU104 TU106 TU106 TU106
Transistor Count 13.6B 13.6B 10.8B 10.8B 10.8B
Architecture Turing Turing Turing Turing Turing
Manufacturing Process TSMC 12nm "FFN" TSMC 12nm "FFN" TSMC 12nm "FFN" TSMC 12nm "FFN" TSMC 12nm "FFN"
Launch Date 09/20/2018 07/09/2019 10/17/2018 07/09/2019 1/15/2019
Launch Price $699 $499 $499 $399 $349


기존 노멀 모델과 수퍼 모델의 스펙 차이점.


RTX 2070 Super 모델은 기존 2070에서 쿠다 코어가 증가한 2560기, 코어 클럭과 부스트 클럭도 상승하여 각각 1605MHz / 1770MHz, 그에 따른 트랜지스터 카운트와 TDP가 증가하고 있다. (175W -> 215W)


RTX 2060 Super 모델은 기존 2060에서 쿠다 코어가 증가한 2176기, 메모리 인터페이스가 192비트에서 256비트로 증가, 코어 클럭도 상승하여 1470MHz, 부스트 클럭은 30MHz 감소한 1650MHz, 트랜지스터 카운트 동일, TDP가 증가. (160W -> 175W)


July 2019 GPU Pricing Comparison
AMD Price NVIDIA
  $1249 GeForce RTX 2080 Ti
Radeon VII $699 GeForce RTX 2080 Super
  $499 GeForce RTX 2070 Super
Radeon RX 5700 XT $449  
  $399 GeForce RTX 2060 Super
Radeon RX 5700 $379  
  $349 GeForce RTX 2060


가격대에 때른 라데온 vs 지포스, 2060 수퍼와 2070 수퍼 모델 모두 라데온과 같은 가격대가 없는 절묘한 포지션


[ 테스트 시스템 ]


CPU: Intel Core i9-9900K @ 5.0GHz
Motherboard: ASRock Z390 Taichi
Power Supply: Corsair AX1200i
Hard Disk: Phison E12 PCIe NVMe SSD (960GB)
Memory: G.Skill Trident Z RGB DDR4-3600 2 x 16GB (17-18-18-38)
Case: NZXT Phantom 630 Windowed Edition
Monitor: Asus PQ321
Video Cards: NVIDIA GeForce GTX 2070 Super Founders Edition
NVIDIA GeForce GTX 2060 Super Founders Edition
NVIDIA GeForce GTX 2080 Founders Edition
NVIDIA GeForce GTX 2070 Founders Edition
NVIDIA GeForce GTX 2060 Founders Edition
AMD Radeon RX Vega 64
Video Drivers: NVIDIA Release 431.15
AMD Radeon Software Adrenalin 2019 Edition 19.6.3
OS: Windows 10 Pro (1903)


Shadow of the Tomb Raider


F1 2019


Assassin's Creed Odyssey


Metro Exodus


Strange Brigade


Total War: Three Kingdoms


The Division 2


Grand Theft Auto V

Now a truly venerable title, GTA V is a veteran of past game suites that is still graphically demanding as they come. As an older DX11 title, it provides a glimpse into the graphically intensive games of yesteryear that don't incorporate the latest features. Originally released for consoles in 2013, the PC port came with a slew of graphical enhancements and options. Just as importantly, GTA V includes a rather intensive and informative built-in benchmark, somewhat uncommon in open-world games.

The settings are identical to its previous appearances, which are custom as GTA V does not have presets. To recap, a "Very High" quality is used, where all primary graphics settings turned up to their highest setting, except grass, which is at its own very high setting. Meanwhile 4x MSAA is enabled for direct views and reflections. This setting also involves turning on some of the advanced rendering features - the game's long shadows, high resolution shadows, and high definition flight streaming - but not increasing the view distance any further.


Forza Horizon 4


출처 - https://www.anandtech.com

반응형
Posted by 랩터 인터내셔널


AMD가 3세대 라이젠(젠2) 아키텍처 기반의 3700X, 3900X 를 공식 발표했다.


먼저 3700X는 8코어 16스레드, 베이스 3.6, 부스트 4.4의 동작 클럭과 32MB L3 캐시, TDP 65와트의 스펙으로 가격은 329달러


3900X는 12코어 24스레드, 베이스 3.8, 부스트 4.6의 동작 클럭과 64MB L3 캐시, TDP 105와트의 스펙으로 가격은 499달러


World of Tanks enCore IGP Low Medium High
Average FPS        
95th Percentile        


Shadow of War IGP Low Medium High
Average FPS        


Ashes Classic IGP Low Medium High
Average FPS        
95th Percentile        


Strange Brigade DX12 IGP Low Medium High
Average FPS        
95th Percentile        


Strange Brigade Vulkan IGP Low Medium High
Average FPS        
95th Percentile        


GTA 5 IGP Low Medium High
Average FPS        
95th Percentile        


F1 2018 IGP Low Medium High
Average FPS        
95th Percentile        


출처 - https://www.anandtech.com

반응형
Posted by 랩터 인터내셔널


삼성전자는 4월 26일 스크린 문제에 대한 보도에도 불구하고 여전히 갤럭시 폴드(Galaxy Fold)를 출시하고 있습니다. 이러한 문제에도 불구하고 우리의 리뷰는 가장 중요한 질문에 답합니다 : 스크린, 카메라, 성능 및 소프트웨어 경험이 멈추었습니까? - 더 버지 리뷰 -


WSJ의 조안나 스턴은 삼성의 첫 폴더블 폰에 대해 검토할 큰 계획을 세웠습니다. 그 후 스크린이 깨지기 시작했고,,, - 월 스트리트 저널 리뷰 -


반응형
Posted by 랩터 인터내셔널


삼성 갤럭시S10 스마트폰에 탑재되는 엑시노스 9820과 스냅드래곤 855에 대한 성능 비교


PCMark Work 2.0 - Web Browsing 2.0PCMark Work 2.0 - Web Browsing 2.0

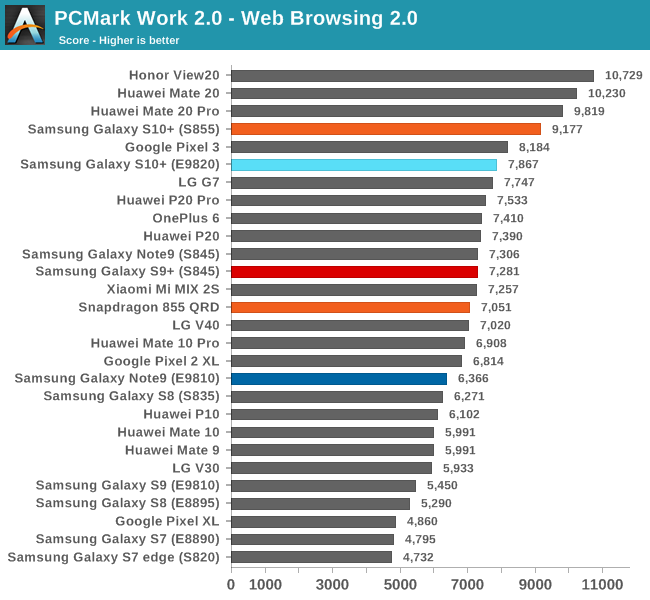
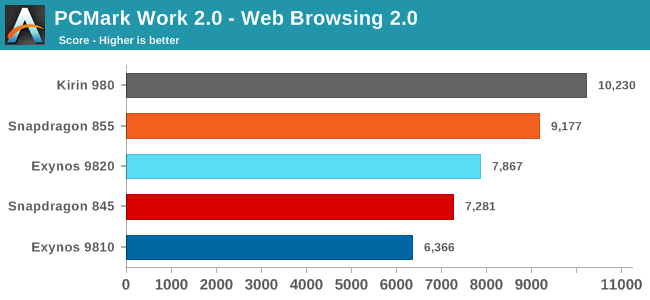
In PCMark’s Web Browsing test, the new Galaxy S10s both perform well. What is interesting to see here is that compared to the scores we initially ran on Qualcomm’s reference device back in January, the Snapdragon 855 Galaxy S10 represents a notable uplift, and seems to be a better representation of the capability of the chip compared to the QRD.

It’s to be noted that the comparisons I’m making today are all on the new Android 9 firmwares – I don’t have updated figures for the Exynos S9 or the Snapdragon Note9, but have the latest numbers on the Snapdragon S9 and Exynos Note9, which should be identical to their sister series' counter-parts.

The new Exynos 9820 Galaxy S10 now showcases a large performance upgrade compared to last year’s Exynos 9810 units. The new chip’s figures are good and better than the Snapdragon 845, however aren’t able to match either the Snapdragon 855 nor the HiSilicon Kirin 980 – the latter two both based on Arm’s newest Cortex A76 CPU cores.

PCMark Work 2.0 - Video EditingPCMark Work 2.0 - Video Editing

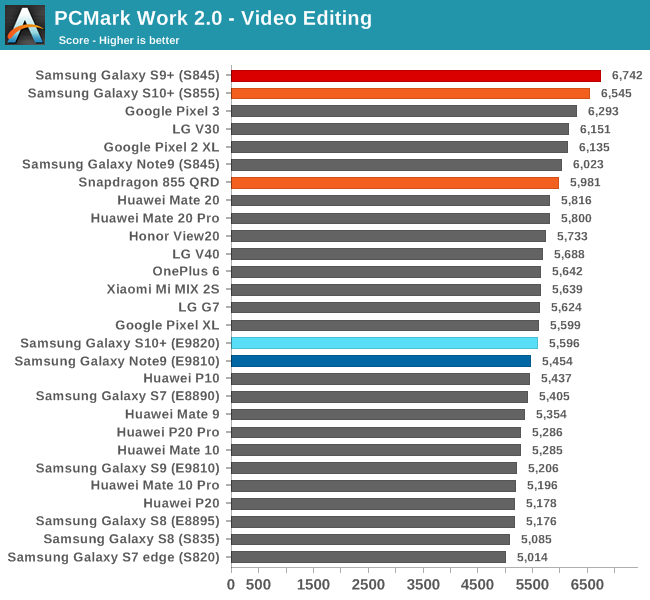
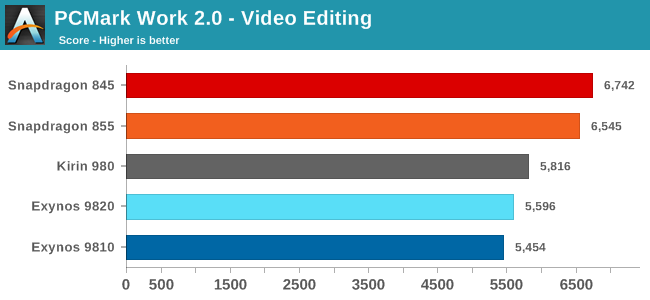
The video editing test is less relevant nowadays as performance differences between different platforms are quite minor. Still the new Exynos still shows a distinct performance difference to the Snapdragon counter-part, similar to what we saw last year.

PCMark Work 2.0 - Writing 2.0PCMark Work 2.0 - Writing 2.0

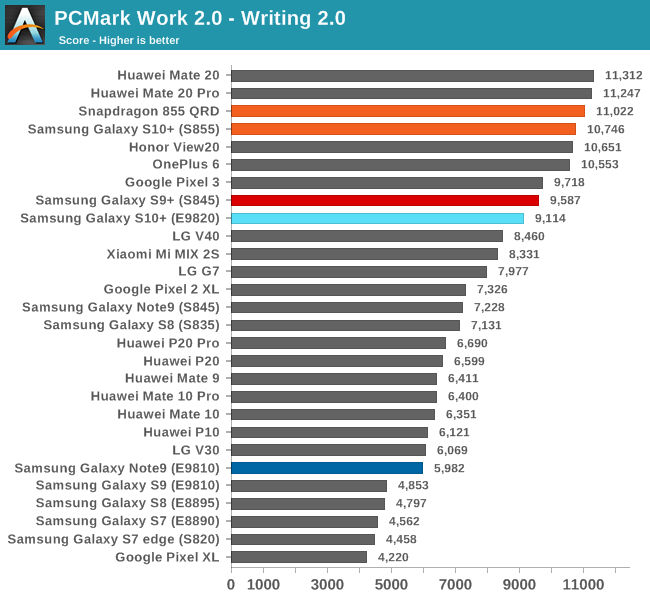
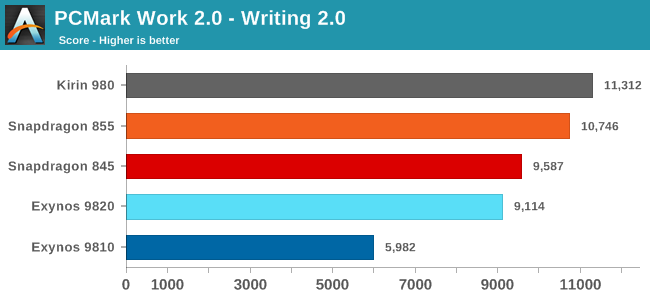
The writing test is probably the single most important component of PCMark when it comes to representing the experienced performance of a device. The Snapdragon 855 Galaxy S10 falls in line with the QRD’s performance, which is excellent.

The new Exynos 9820 Galaxy S10 represents a major jump for Samsung, scoring double what we’ve seen on the Exynos 9810 units last year. Likely what this means is that Samsung has solved some of the most important performance issues plaguing the Exynos S9/Note9. The phone still lags behind the new Snapdragon 855 as well as the Kirin 980. We’re not sure if this continued difference is due to hardware or scheduler, and we won’t be able to find out until a more in-depth investigation at a later date.

PCMark Work 2.0 - Photo Editing 2.0PCMark Work 2.0 - Photo Editing 2.0

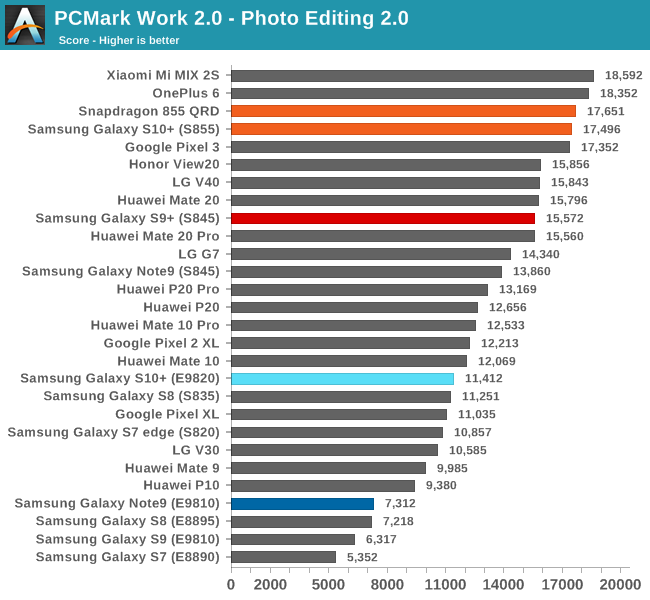
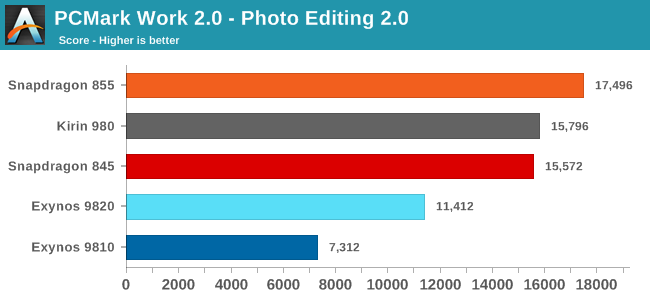
In the Photo Editing test we see the new Exynos 9820 similarly performing almost twice as well as last year’s Samsung silicon. Here it’s clearer that the difference is due to new improved scheduler reactivity as the workload isn’t necessarily throughput limited. The continued performance detriment to the Snapdragon and Kirin chipsets however still points our that Samsung’s APIs still aren’t as well optimised.

PCMark Work 2.0 - Data ManipulationPCMark Work 2.0 - Data Manipulation

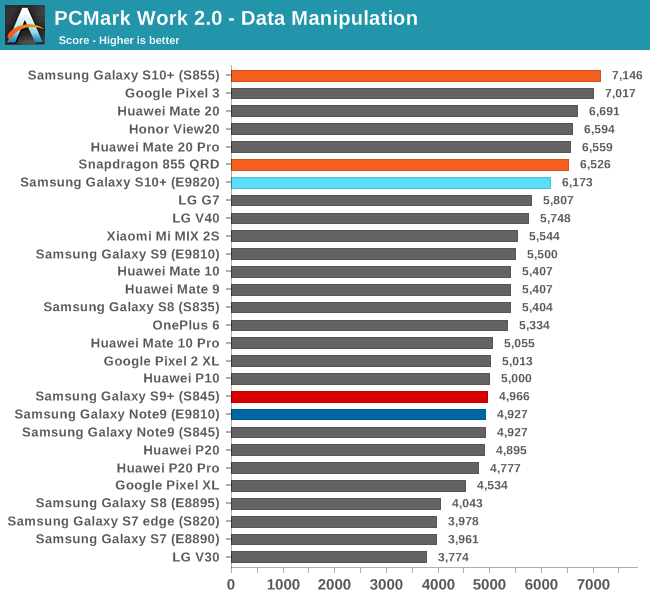
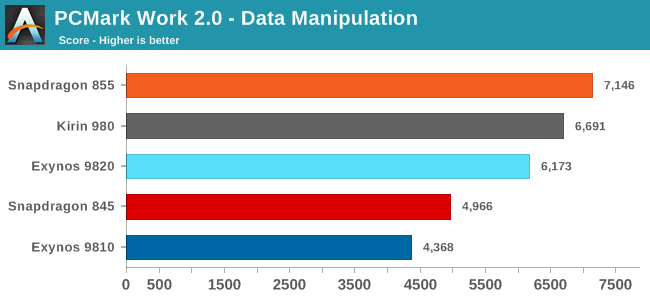
Finally, the Data Manipulation score is more single-thread limited workload. Here, the new Snapdragon 855 Galaxy S10 takes the top spot among devices. The new Exynos 9820 doesn’t fall too far behind, and does represent a big boost over the Galaxy S9 in either versions.

Speedometer 2.0 - OS WebViewSpeedometer 2.0 - OS WebView

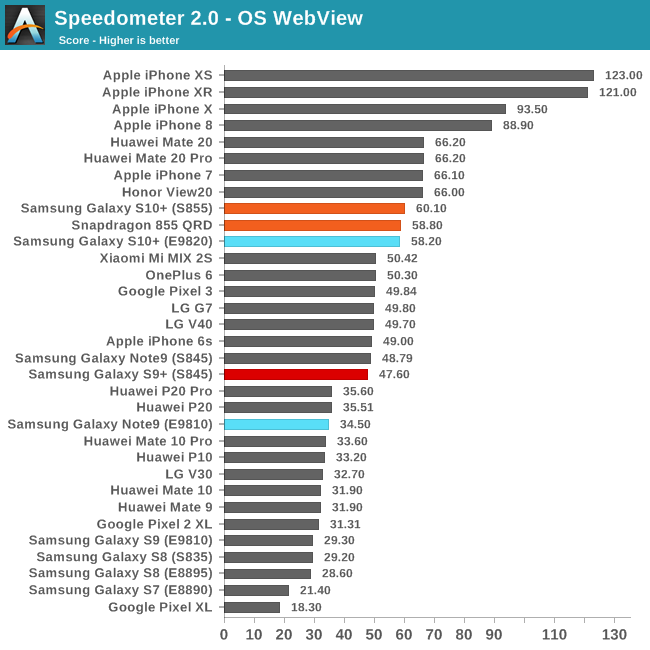
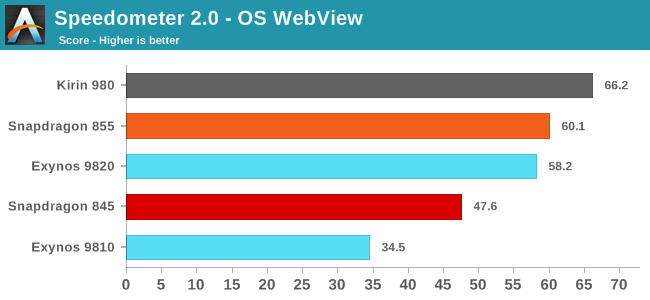
Switching over to a browser benchmark, the new Galaxy S10s both perform almost identically. The performance of the Snapdragon 855 is a bit better than the QRD we tested in January, however it’s still lagging behind the Kirin 980.

The Exynos 9820’s performance here represents a huge boost compared to the Exynos 9810. The score presented here not only represents the possibly much better scheduler, but also hardware improvements on the part of the new cluster and microarchitecture designs.

Performance looks “OK” for the Exynos – Though Snapdragon looks to be leading

Overall the new Galaxy S10s are both in line with expectations. The Snapdragon 855 Galaxy S10’s performance isn’t much of a surprise, as we had covered the chipset in detail at Qualcomm’s performance preview event. The Galaxy S10 actually performs better than the QRD – putting to rest some of the worries we had on the early platform. It’s to be noted that Qualcomm here still lags a tad behind HiSilicon’s Kirin 980 in some aspects, probably a result of the latter’s better memory latency.

The new Exynos 9820 performs significantly better than last year’s 9810. Here Samsung seems to have taken note of the scheduler slowness that has plagued the last 3 generations of Samsung SoCs. Besides some obvious software improvements, the new M4 microarchitecture also seems to have upped the performance. Samsung claims 20% better performance than the 9810, which looks to be reasonable.

Battery Life To Be Determined

Today’s results only represent a bare minimum in terms of benchmarking Samsung’s new devices. While the new Exynos 9820 can’t keep up to the Snapdragon 855 in terms of performance, it’s no longer such a stark difference as we saw last year.

Most importantly, there’s still one big open question: power efficiency. As we’ve covered in our preview of the Snapdragon 855, the new Cortex A76 derived cores on a new 7nm process node showcase some outstanding efficiency figures. HiSilicon’s Kirin 980 is able to power some of highest endurance flagship devices today, and I expect the Snapdragon 855 to be able to achieve the same. If the new Exynos is able to achieve the same is something we’ll have to find out at a later date. We have to remember that Samsung’s chipset not only has to fix its microarchitectural efficiency issues, but also comes with a process manufacturing disadvantage as the chip is produced on a (theoretically) inferior 8nm process.

Unfortunately we won’t have the Galaxy S10 in-house for review until after public availability on March 8th – so we’ll have to be a little more patient before we can post a more detailed analysis of Samsung’s new flagship devices.


출처 - https://www.anandtech.com

반응형
Posted by 랩터 인터내셔널


aHR0cDovL21lZGlhLmJlc3RvZm1pY3JvLmNvbS83


EVGA GeForce GTX 1660 Ti XC Black Gaming
GeForce RTX 2060 FE
GeForce GTX 1060 FE
GeForce GTX 1070 FE
Architecture (GPU)
Turing (TU116)
Turing (TU106)Pascal (GP106)Pascal (GP104)
CUDA Cores
1536
1920
1280
1920
Peak FP32 Compute
5.4 TFLOPS
6.45 TLFOPS
4.4 TFLOPS6.5 TFLOPS
Tensor Cores
N/A
240
N/AN/A
RT Cores
N/A
30
N/AN/A
Texture Units
96
120
80120
Base Clock Rate
1500 MHz
1365 MHz
1506 MHz1506 MHz
GPU Boost Rate
1770 MHz
1680 MHz
1708 MHz1683 MHz
Memory Capacity
6GB GDDR6
6GB GDDR6
6GB GDDR58GB GDDR5
Memory Bus
192-bit
192-bit
192-bit256-bit
Memory Bandwidth
288 GB/s
336 GB/s
192 GB/s256 GB/s
ROPs
48
48
48
64
L2 Cache
1.5MB
3MB
1.5MB2MB
TDP
120W
160W
120W150W
Transistor Count
6.6 billion
10.8 billion
4.4 billion7.2 billion
Die Size
284 mm²445 mm²200 mm²314 mm²
SLI Support
No
No
NoYes (MIO)

엔비디아의 지포스GTX 1660Ti는 Turing (TU116) 아키텍처의 1536 쿠다코어, 5.4테라플롭스 FP32 컴퓨트 성능, 96 텍스처 유닛, 48ROP, 120W TDP, 베이스 클럭 1500 - 부스트 클럭 1770, 192비트 6GB GDDR6 메모리가 탑재됩니다.


GTX 시리즈로 발표된 것과 같이 RTX 시리즈의 텐서 코어와 RT 코어는 제거됐으며 다이사이즈는 284mm², 트랜지스터 카운트는 6.6 빌리언 입니다.


aHR0cDovL21lZGlhLmJlc3RvZm1pY3JvLmNvbS83

aHR0cDovL21lZGlhLmJlc3RvZm1pY3JvLmNvbS84


지포스GTX 1660Ti는 텐서 코어와 RT코어가 없지만 튜링 아키텍처의 우수함으로 기존 1060 대비 매우 높은 GPGPU 연산 성능을 발휘합니다.


aHR0cDovL21lZGlhLmJlc3RvZm1pY3JvLmNvbS83


Ashes of the Singularity - FPS - 1920x1080, DX12, 4x MSAA Crazy


Battlefield V - FPS - 1920x1080, DX12 Ultra


Destiny 2 - FPS - 1920x1080, DX11, SMAA Highest


Far Cry 5 - FPS - 1920x1080, DX11, HD Textures On Ultra


Forza Horizon 4 - FPS - 1920x1080, DX12, 2x MSAA Ultra

Grand Theft Auto V - FPS - 1920x1080, DX11, 4x MSAA Very High

Metro  Last Light - FPS - 1920x1080, DX11, SSAA Very High


Shadow of the Tomb Raider - FPS - 1920x1080, DX12, SMAAT2x Highest


Tom Clancy\'s The Division - FPS - 1920x1080, DX12 Ultra


Tom Clancy\'s Ghost Recon - FPS - 1920x1080, DX11 Very High


The Witcher 3 - FPS - 1920x1080, DX11 Ultra


Wolfenstein II  The New Colossus - FPS - 1920x1080, Vulkan Ãber, TSSAA (8TX)


Ashes of the Singularity - FPS - 2560x1440, DX12, 4x MSAA Crazy


Battlefield V - FPS - 2560x1440, DX12 Ultra


Destiny 2 - FPS - 2560x1440, DX11, SMAA Highest


Far Cry 5 - FPS - 2560x1440, DX11, HD Textures On Ultra


Forza Horizon 4 - FPS - 2560x1440, DX12, 2x MSAA Ultra


Grand Theft Auto V - FPS - 2560x1440, DX11, 4x MSAA Very High


Metro  Last Light - FPS - 2560x1440, DX11 Very High


Shadow of the Tomb Raider - FPS - 2560x1440, DX12, TAA Highest


Tom Clancy\'s The Division - FPS - 2560x1440, DX12 Ultra


Tom Clancy\'s Ghost Recon - FPS - 2560x1440, DX11 Very High


The Witcher 3 - FPS - 2560x1440, DX11 Ultra


Wolfenstein II  The New Colossus - FPS - 2560x1440, Vulkan Ãber, TSSAA (8TX)


출처 - https://www.tomshardware.com

반응형
Posted by 랩터 인터내셔널


AMD의 신형 라데온7이 마침내 발매 되었습니다.


라데온7은 GPU 측면으로 종합 16GB HBM2 메모리가 장착되어 있습니다.


aHR0cDovL21lZGlhLmJlc3RvZm1pY3JvLmNvbS9D

라데온7의 GPGPU 연산 성능은 FP16과 FP32 모두 RTX 2080보다 떨어지며 FP64는 앞섭니다.


aHR0cDovL21lZGlhLmJlc3RvZm1pY3JvLmNvbS9T


라데온7의 아키텍처 다이어그램 입니다.


T1.jpg


라데온7의 GPU 아키텍처는 베가20 입니다. 세이더는 3840 유닛, 텍스처 240 유닛, 베이스 클럭 1400, 부스트 클럭 1750, 4096비트 16GB HBM2를 장착하고 있습니다. 또한 ROP는 64 유닛, L2캐시는 4MB, 트랜지스터는 13.2B, 다이사이즈는 331mm2이며 TDP는 300와트 입니다. 추가적인 텐서 코어와 RT 코어 또한 없습니다.


카드 구성입니다.


Ashes of the Singularity - FPS - 2560x1440, DX12, 4x MSAA Crazy


Battlefield V - FPS - 2560x1440, DX12 Ultra


Destiny 2 - FPS - 2560x1440, DX11, SMAA Highest


Far Cry 5 - FPS - 2560x1440, DX11 Ultra


Grand Theft Auto V - FPS - 2560x1440, DX11, 4x MSAA Very High


Metro  Last Light - FPS - 2560x1440, DX11, SSAA Very High


Rise of the Tomb Raider - FPS - 2560x1440, DX12, SSAA Very High


Tom Clancy\'s The Division - FPS - 2560x1440, DX12 Ultra


Tom Clancy\'s Ghost Recon - FPS - 2560x1440, DX11 Very High


The Witcher 3 - FPS - 2560x1440, DX11 Ultra


Wolfenstein II  The New Colossus - FPS - 2560x1440, Vulkan Ãber, TSSAA (8TX)


Ashes of the Singularity - FPS - 3840x2160, DX12 Extreme


Battlefield V - FPS - 3840x2160, DX12 Ultra


Destiny 2 - FPS - 3840x2160, DX11 Highest


Far Cry 5 - FPS - 3840x2160, DX11 Ultra


Grand Theft Auto V - FPS - 3840x2160, DX11 Very High

Metro  Last Light - FPS - 3840x2160, DX11 Very High


Rise of the Tomb Raider - FPS - 3840x2160, DX12 Very High


Tom Clancy\'s The Division - FPS - 3840x2160, DX12 Ultra


Tom Clancy\'s Ghost Recon - FPS - 3840x2160, DX11 Very High


The Witcher 3 - FPS - 3840x2160, DX11 Ultra


Wolfenstein II  The New Colossus - FPS - 3840x2160, Vulkan Ultra, TSSAA (8TX)


aHR0cDovL21lZGlhLmJlc3RvZm1pY3JvLmNvbS9S


aHR0cDovL21lZGlhLmJlc3RvZm1pY3JvLmNvbS9S


y side.


AMD Radeon VII

Nvidia GeForce RTX 2080 FE

Maximum Fan Speed, Open Test Bench

2,927 RPM (Gaming workload)

1,907 RPM (Gaming workload)

Average Fan Speed, Open Test Bench

2,911 RPM (Warmed up)

1,887 RPM  (Warmed up)

Maximum Fan Speed, Closed Case

2,949 RPM (Gaming workload)

1,959 RPM (Gaming workload)

Average Fan Speed, Closed Case

2,927 RPM (Warmed up)

1,942 RPM (Warmed up)

Peak Noise Measurements (Gaming workload) 

49.2 dB(A), Closed case

39.6 dB(A), Closed case

Idle Noise Measurements

32.1 dB(A)

31.3 dB(A)


출처 - https://www.tomshardware.com


반응형
Posted by 랩터 인터내셔널