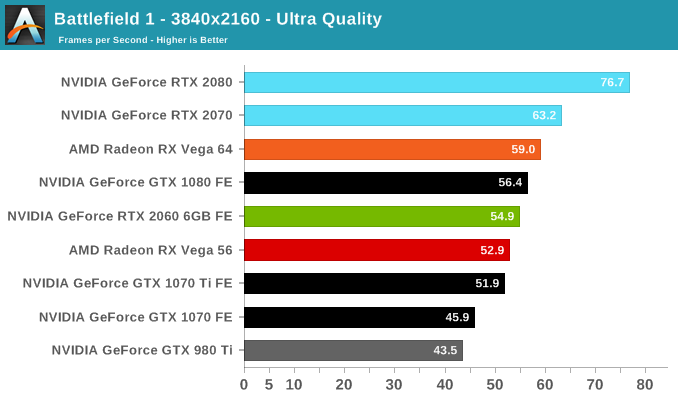
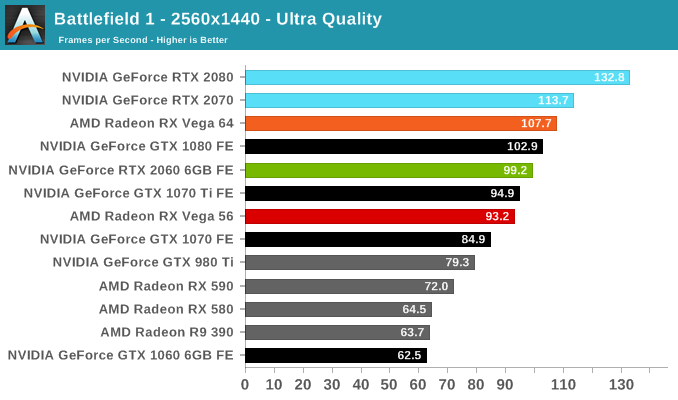
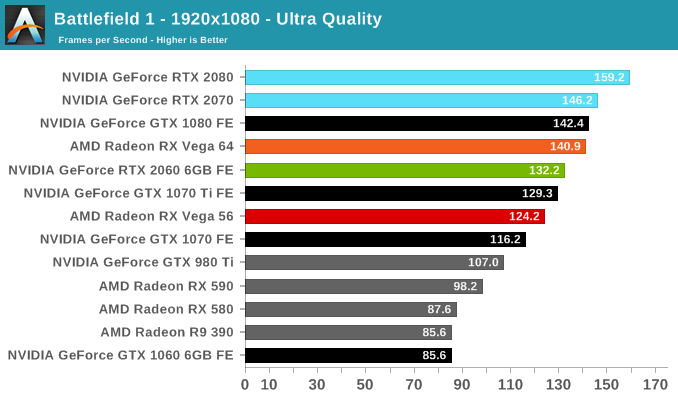
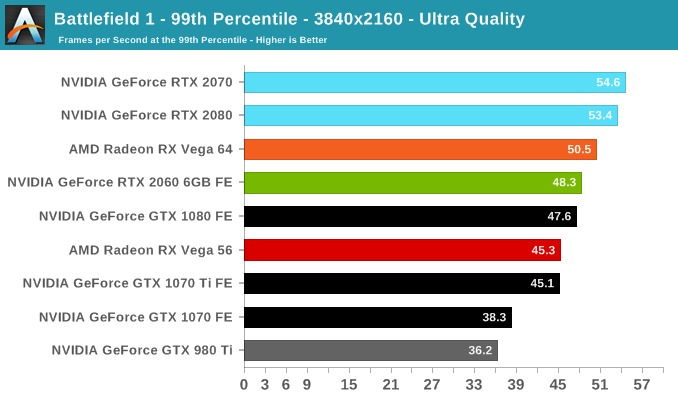
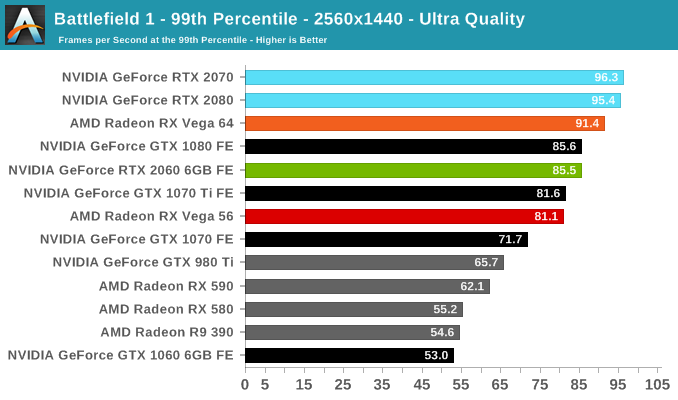
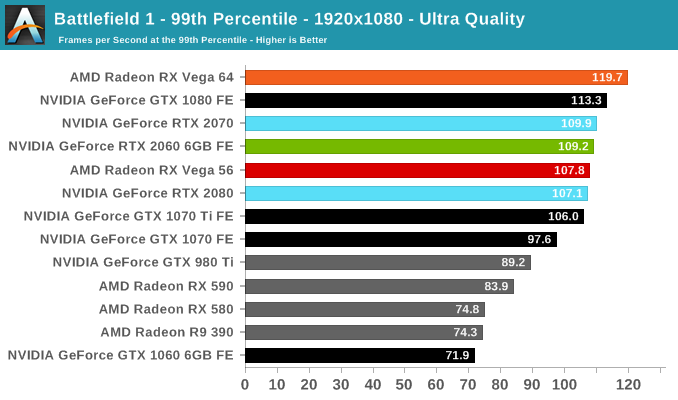
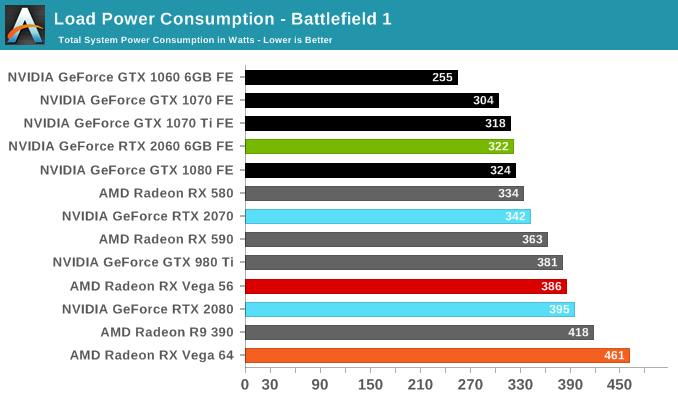
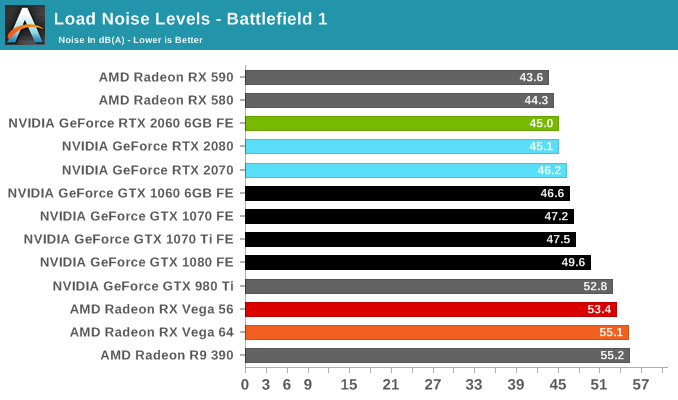
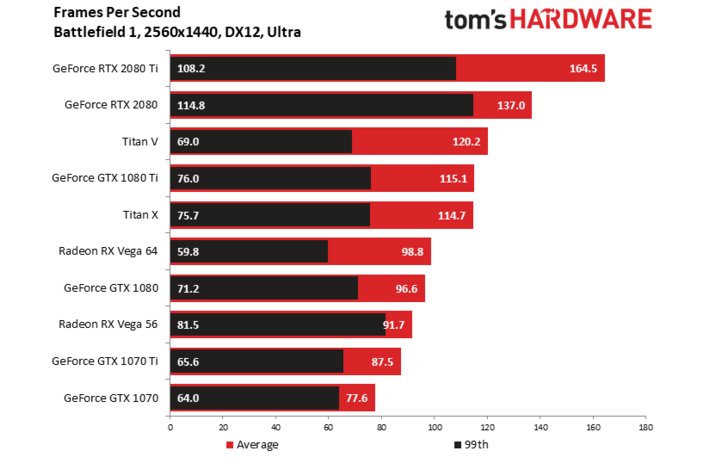
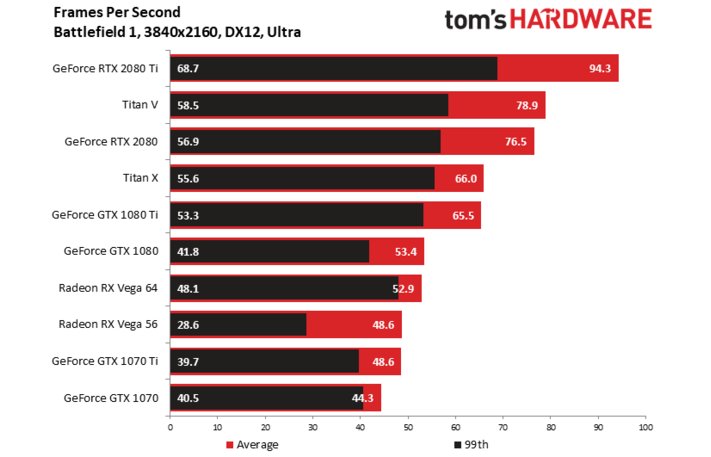
Battlefield 1 has made the rounds for some time, and after the optimizations over the years both manufacturers generally enjoy solid performance across the board. The RTX 2060 (6GB) is no exception and fares well, splitting the difference between the GTX 1070 Ti and GTX 1080. This also means it opens a lead on the RX Vega 56.
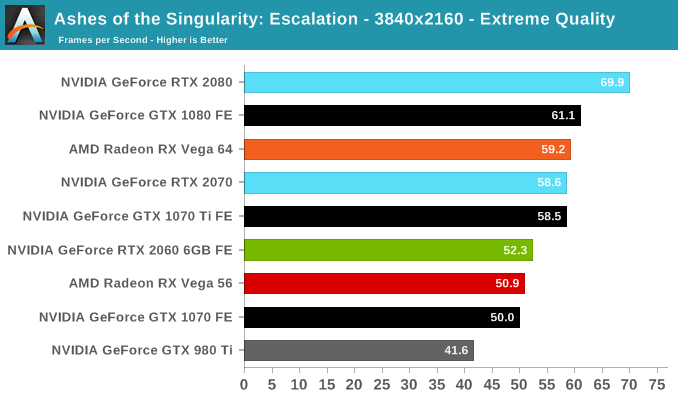
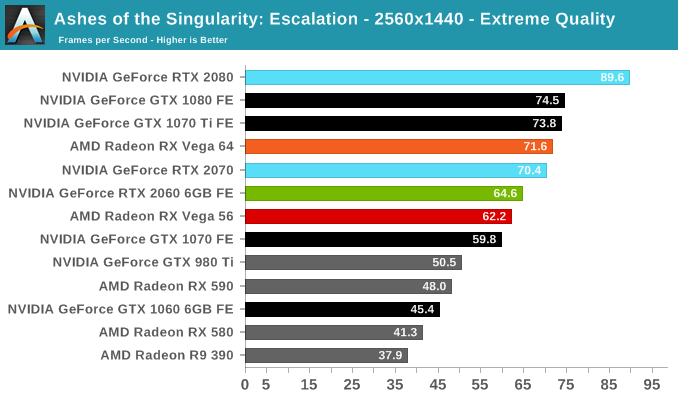
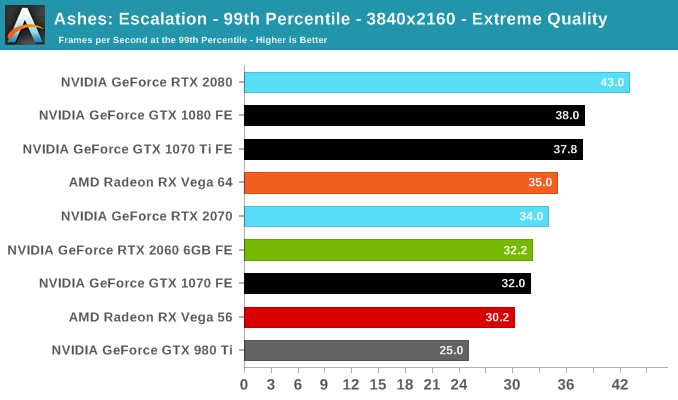
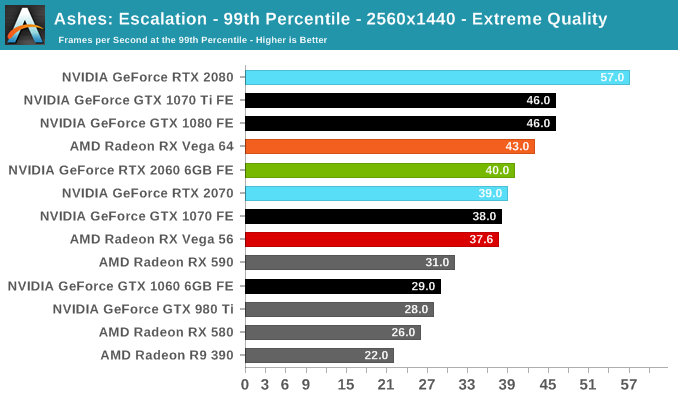
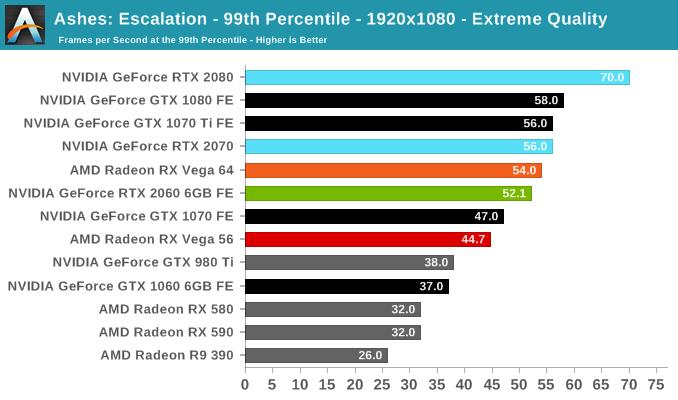
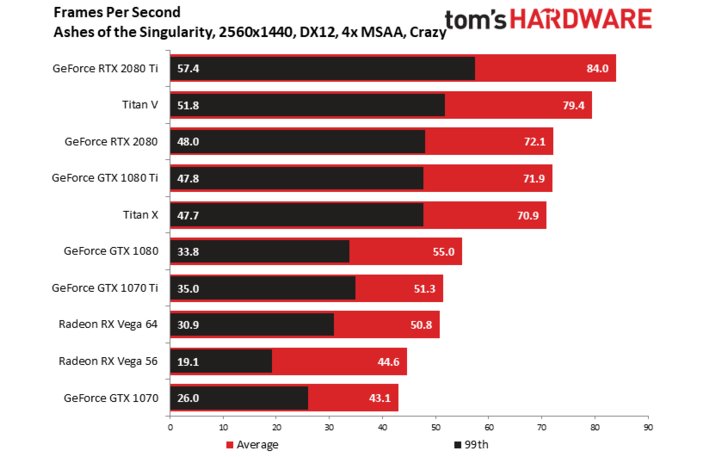
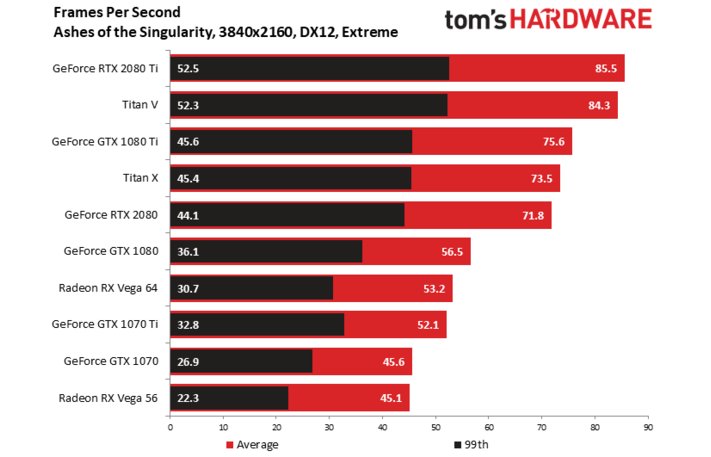
Somewhat surprisingly, the RTX 2060 (6GB) performs poorly in Ashes, closer to the GTX 1070 than the GTX 1070 Ti. Although it is still ahead of the RX Vega 56, it's not an ideal situation, where the lead over the GTX 1060 6GB is cut to around 40%.
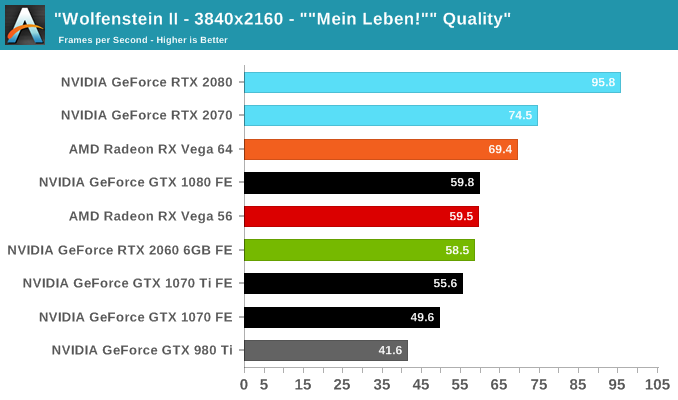
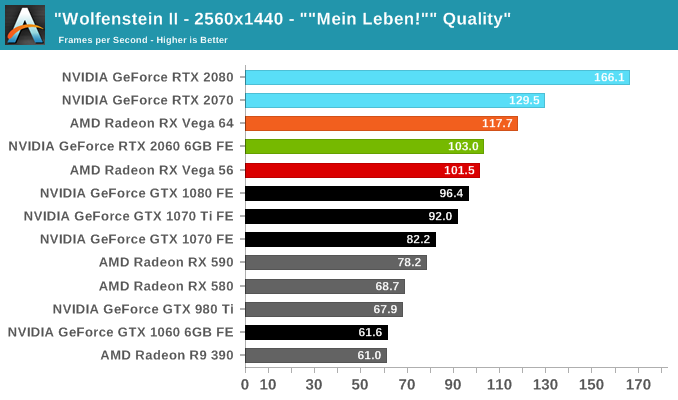
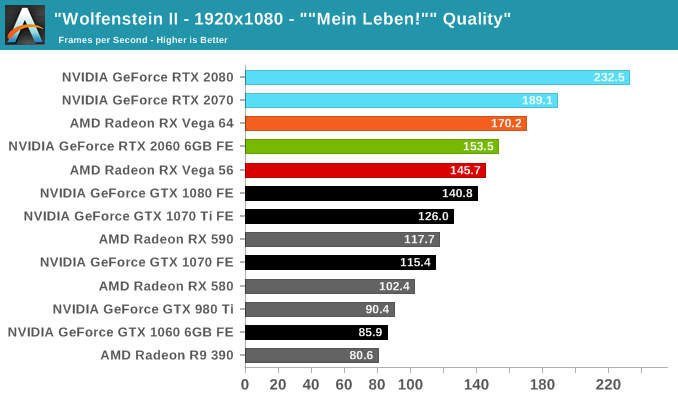
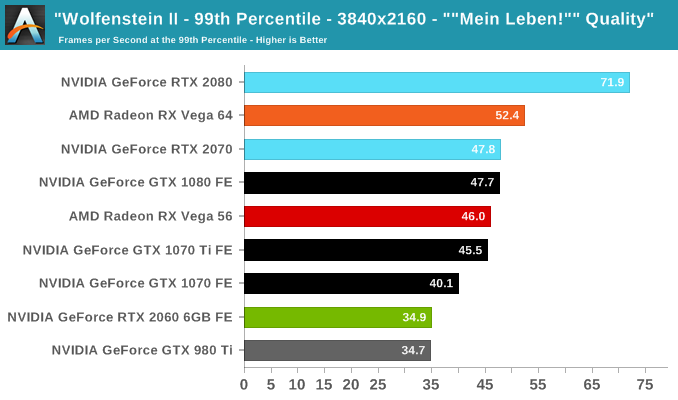
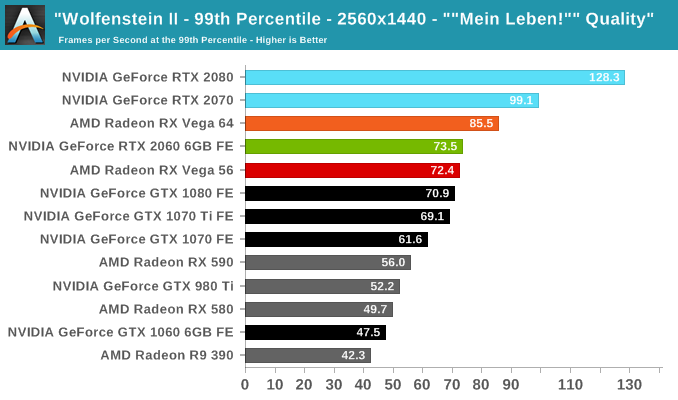
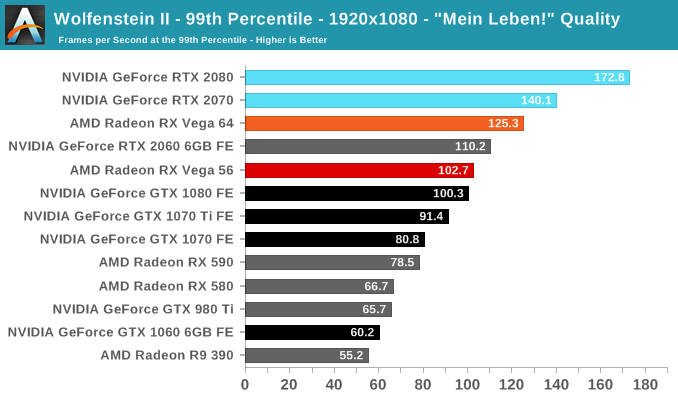
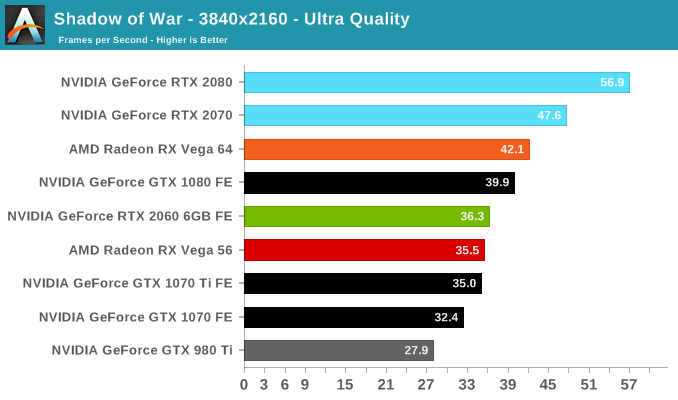
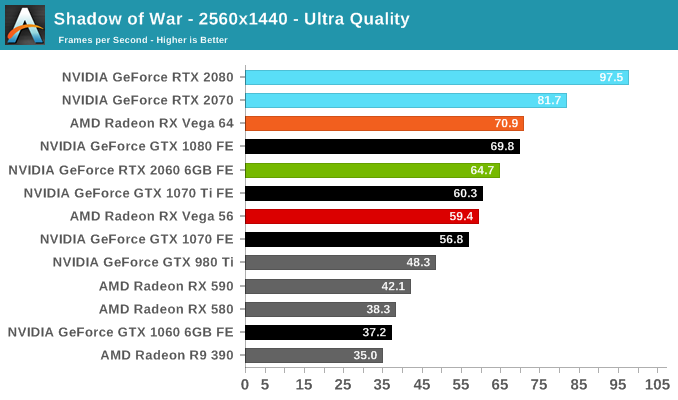
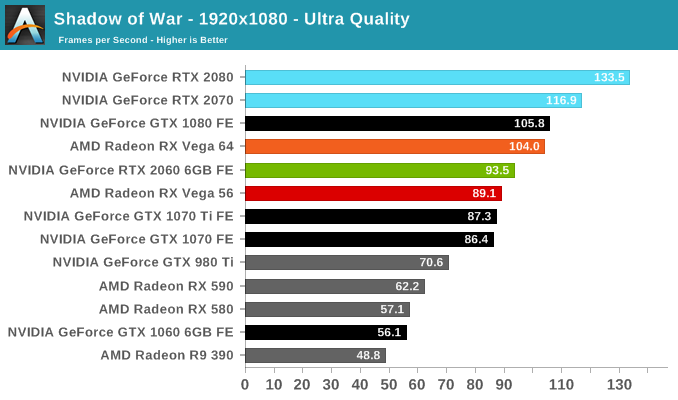
In summary, Wolfenstein II tends to scales well, enables high framerates with minimal CPU bottleneck, enjoys running on modern GPU architectures, and consumes VRAM like nothing else. For the Turing-based RTX 2060 (6GB), this results in outpacing the GTX 1080 as well as RX Vega 56 at 1080p/1440p. The 4K results can be deceiving; looking closer at 99th percentile framerates shows a much steeper dropoff, more likely than not to be related to the limitations of the 6GB framebuffer. We've already seen the GTX 980 and 970 struggle at even 1080p, chained by 4GB video memory.
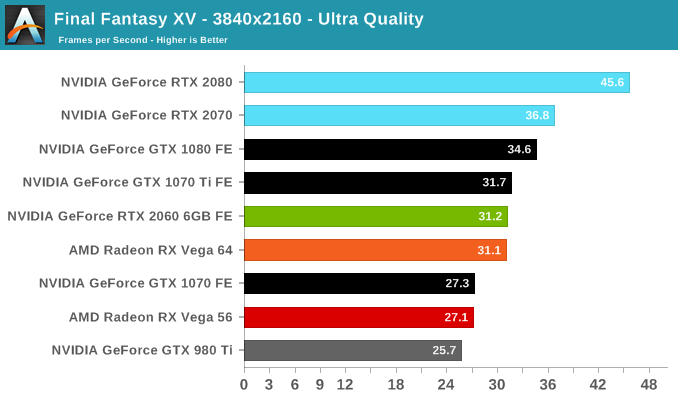
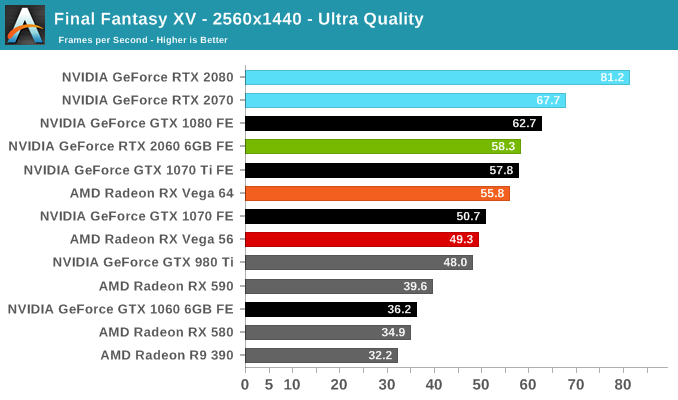
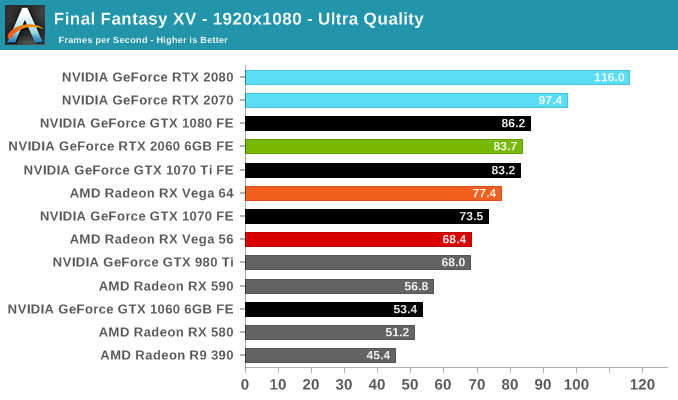
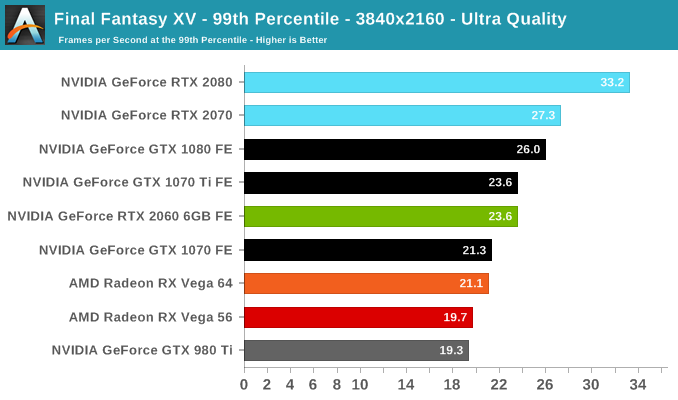
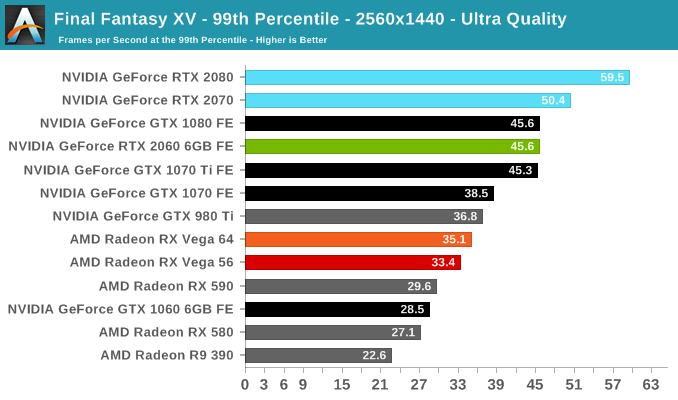
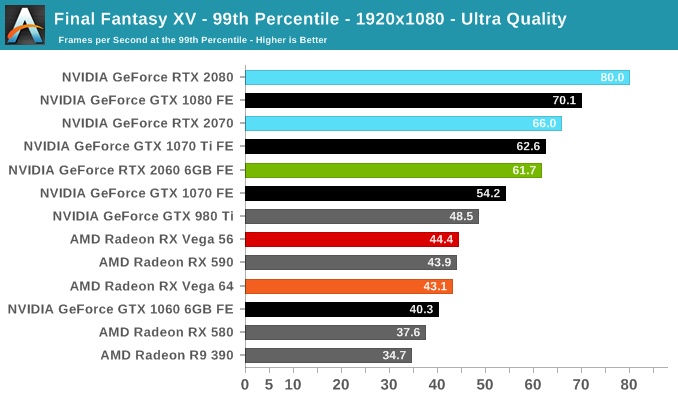
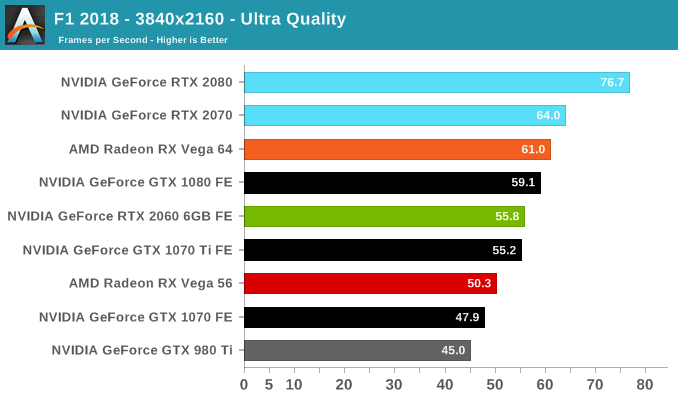
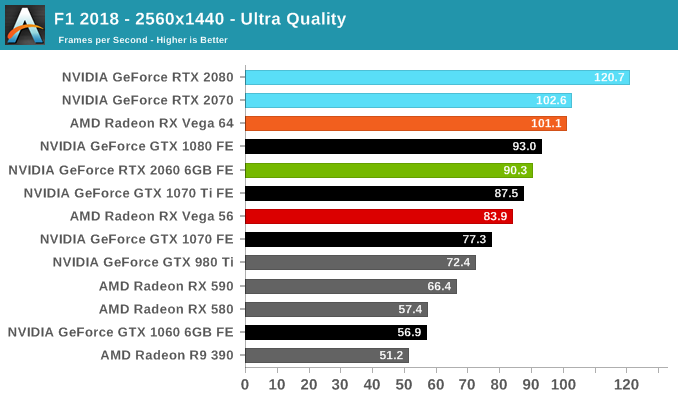
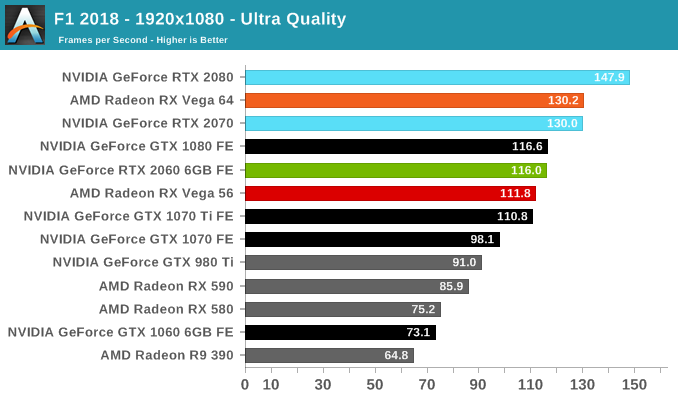
At 1080p and 1440p, the RTX 2060 (6GB) returns to its place between the GTX 1080 and GTX 1070 Ti. Final Fantasy is less favorable to the Vega cards so the RTX 2060 (6GB) is already faster than the RX Vega 64. With the relative drop in 4K performance, there are more hints of 6GB being potentially insufficient.
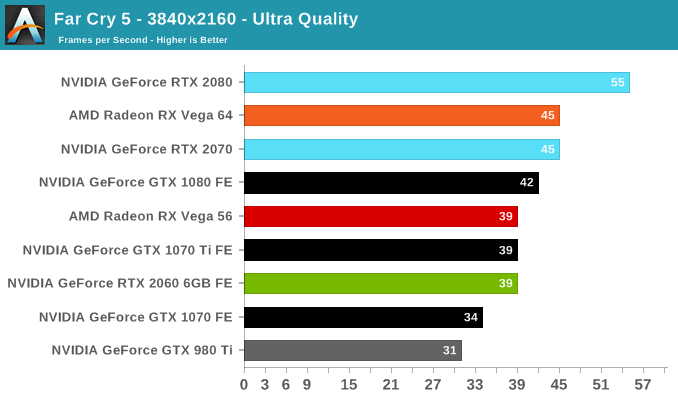
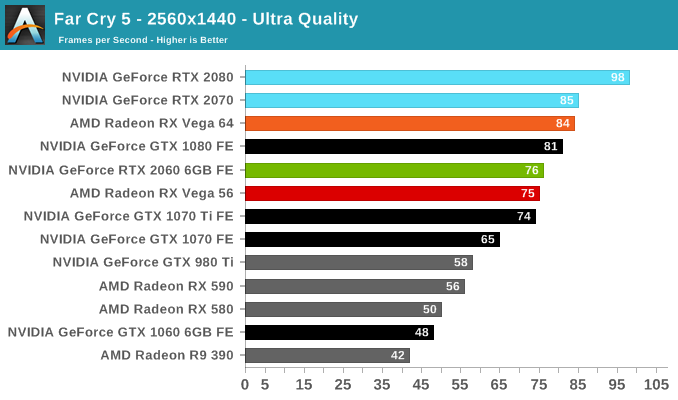
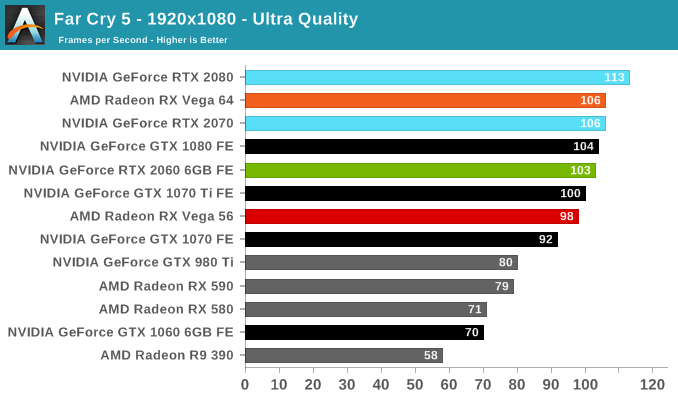
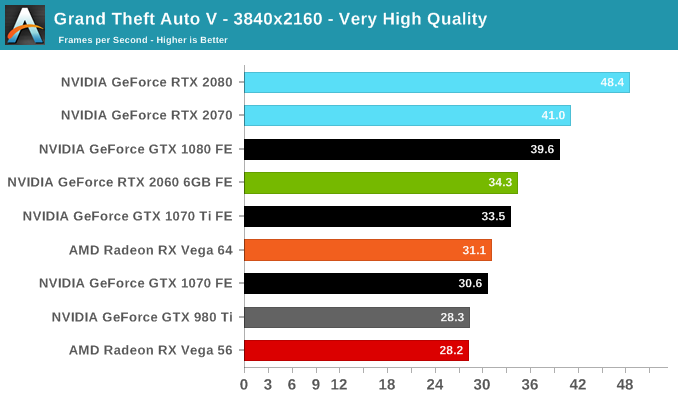
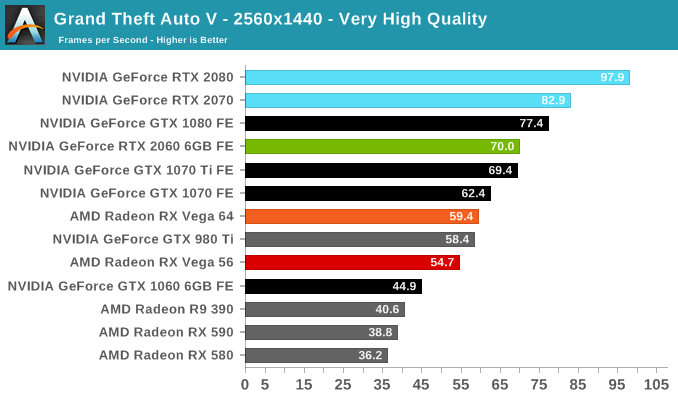
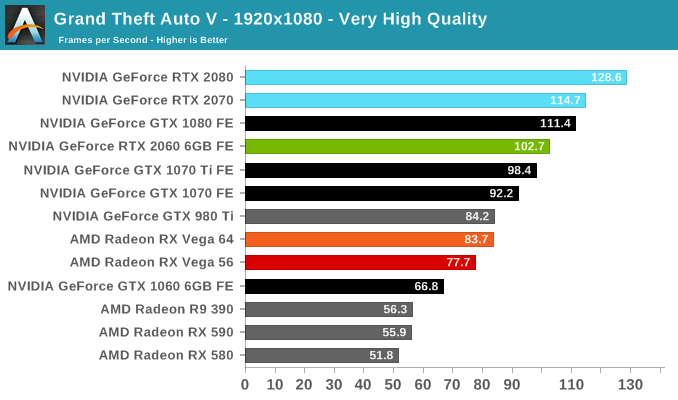
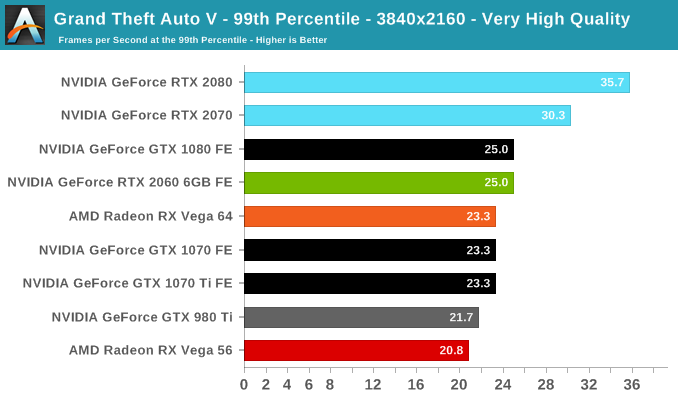
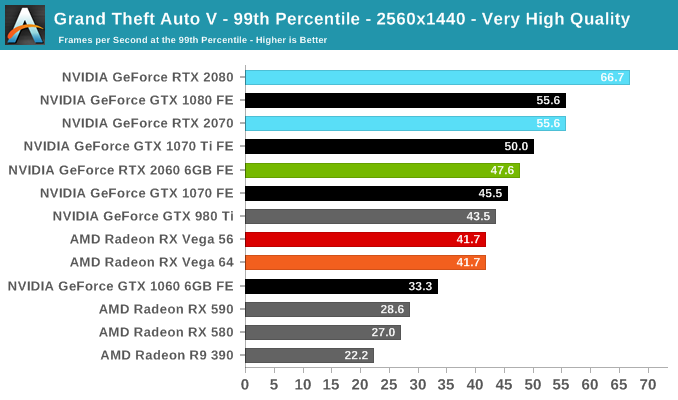
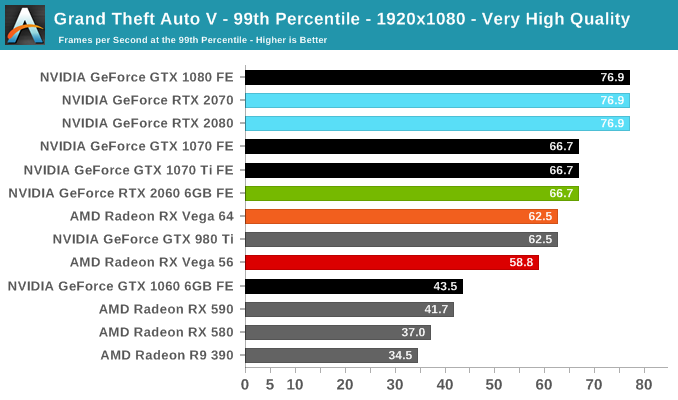
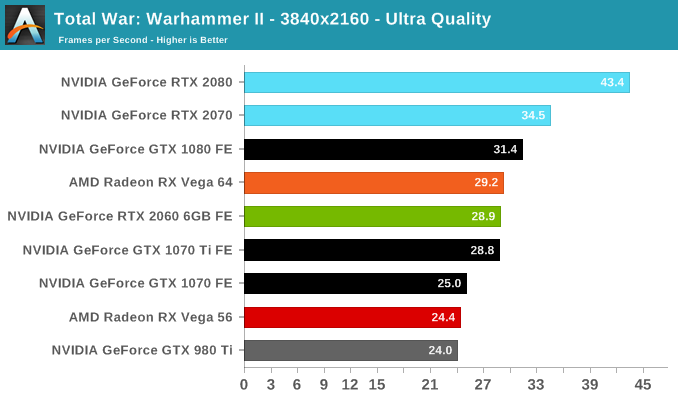
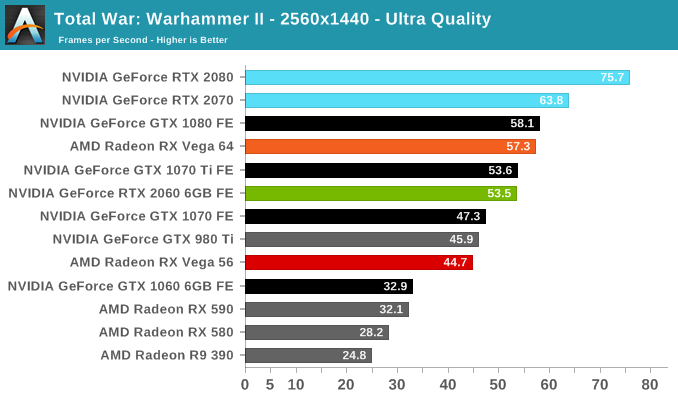
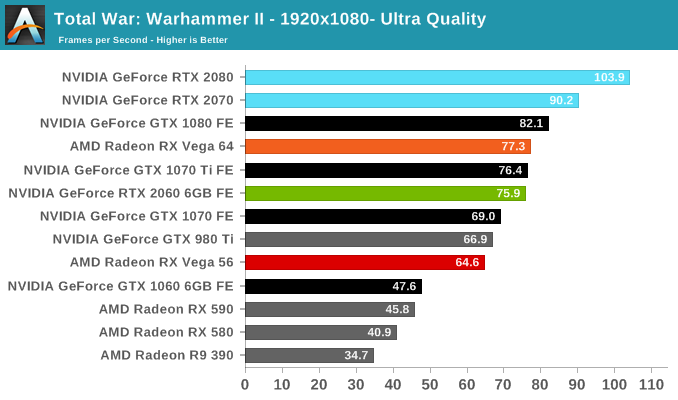
NVIDIA hardware tend to do well here, and for all intents and purposes the RTX 2060 (6GB) FE is equivalent to the GTX 1070 Ti FE in performance. Which means that the RTX 2060 is essentially on the level of the RX Vega 64, an ideal position for it to be in.
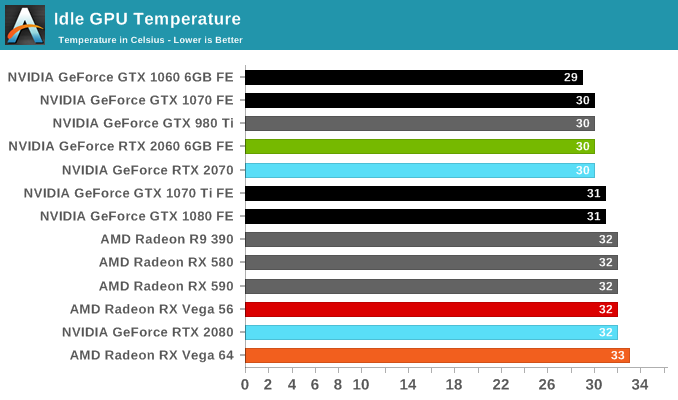
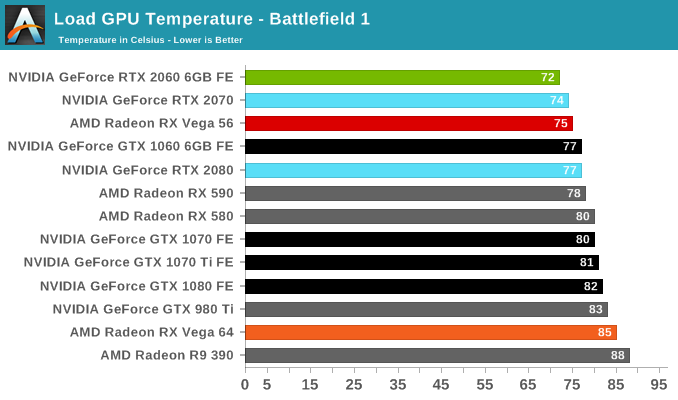
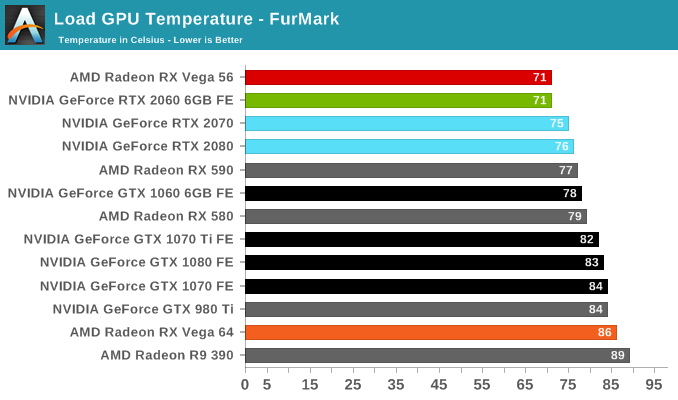
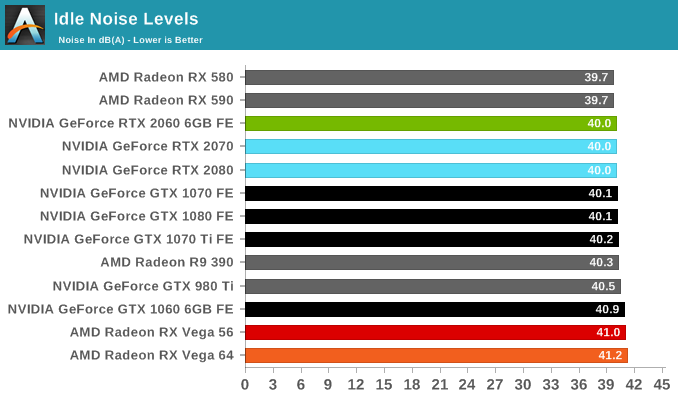
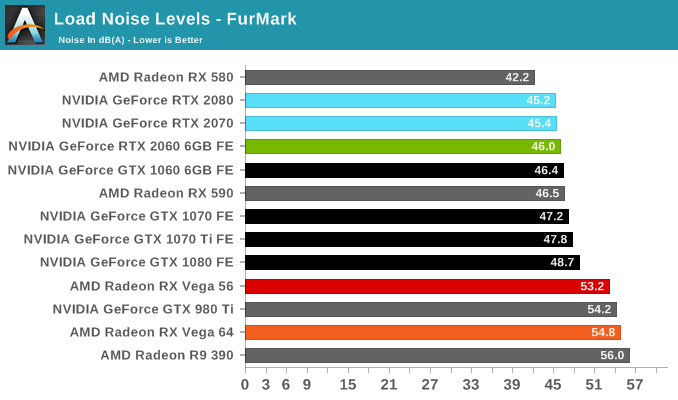
Temperature & Noise
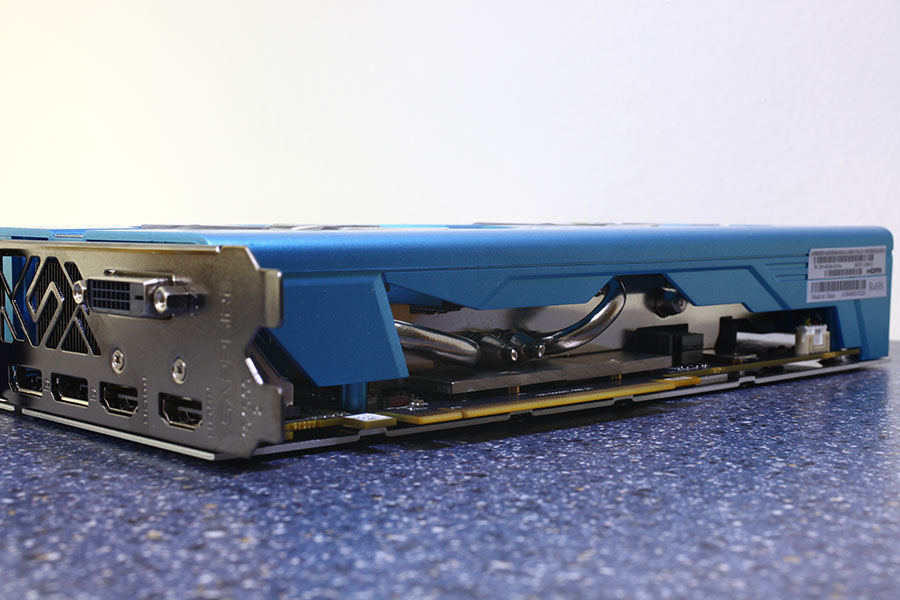
With an open air cooler design with dual axial fans, the results are in line with what we've seen with the other RTX Founders Editions.
베이스 클럭은 3.0GHz, 부스트 클럭은 4.4 / 4.5GHz로 동작하고, L3 캐시는 24.75MB 탑재되고 있습니다. 메모리 인터페이스는 쿼드 채널 DDR4-2666, 44PCIe 레인, TDP는 165W, LGA 2066 인터페이스를 지원하며 내장그래픽은 없습니다.
Active Cores
1 -2
3 - 4
5 - 12
13 - 16
17 - 18
Core i9-9980XE Turbo Boost
4.5
4.2
4.1
3.9
3.8
Core i9-7980XE Turbo Boost
4.4
4.0
3.9
3.5
3.4
코어별 동작 클럭을 보면 1~2코어는 최대 4.5, 3~4코어는 최대 4.2, 5~12코어는 최대 4.1, 13~16코어는 최대 3.9, 17~18코어는 최대 3.8 클럭으로 동작하여 기존의 7980XE 모델 모다 향상된 동작 클럭을 확인할 수 있습니다.
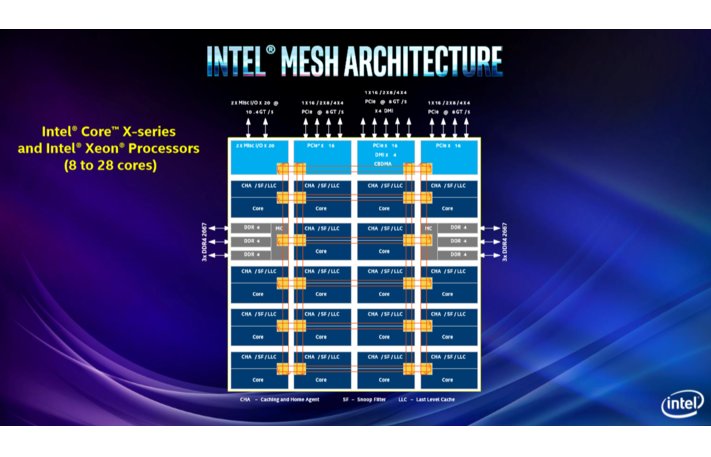
또한 9980XE는 메인스트림에 사용되는 링버스 아키텍처가 아닌 메시 아키텍처로 설계되고 있습니다. 이 기술은 기본적으로 X-Y 라우팅 시스템이 있는 그리드 형태입니다. 이것은 거대한 버스를 원으로 그리기보다는 훨씬 더 컴팩트 한 큐브 토폴로지를 통해 시간을 절약 할 수 있다는 것을 의미합니다.
Cores / Threads
Base / Boost (GHz)
L3 Cache (MB)
PCIe 3.0
DRAM
TDP
MSRP/RCP
Price Per Core
TR 2990WX
32 / 64
3.0 / 4.2
64
64 (4 to PCH)
Quad DDR4-2933
250W
$1799
$56
TR 2970WX
24 / 48
3.0 / 4.2
64
64 (4 to PCH)
Quad DDR4-2933
250W
$1299
$54
Core i9-9980XE
18 / 36
3.0 / 4.5
24.75
44
Quad DDR4-2666
165W
$1979
$110
Core i9-7980XE
18 / 36
2.6 / 4.4
24.75
44
Quad DDR4-2666
165W
$1999
$111
TR 2950X
16 / 32
3.5 / 4.4
32
64 (4 to PCH)
Quad DDR4-2933
180W
$899
$56
Core i9-9960X
16 / 32
3.1 / 4.5
22
44
Quad DDR4-2666
165W
$1684
$105
Core i9-7960X
16 / 32
2.8 / 4.4
22
44
Quad DDR4-2666
165W
$1699
$106
Core i9-9940X
14 / 28
3.3 / 4.5
19.25
44
Quad DDR4-2666
165W
$1387
$99
TR 2920X
12 / 24
3.5 / 4.3
32
64 (4 to PCH)
Quad DDR4-2933
180W
$649
$54
Core i9-9920X
12 / 24
3.5 / 4.5
19.25
44
Quad DDR4-2666
165W
$1189
$99
Core i9-7920X
12 /24
2.9 / 4.4
16.50
44
Quad DDR4-2666
140W
$1199
$100
Core i9-9900X
10 / 20
3.5 / 4.5
19.25
44
Quad DDR4-2666
165W
$989
$98.9
Core i9-7900X
10 / 20
3.3 / 4.3
13.75
44
Quad DDR4-2666
140W
$999
$99
Core i9-9820X
10 / 20
3.3 / 4.2
16.5
44
Quad DDR4-2666
165W
$889
$88.9
Core i9-9800X
8 / 16
3.8 / 4.5
16.5
44
Quad DDR4-2666
165W
$589
$73.65
Core i9-9900K
8 / 16
3.6 / 5.0
16
16
Dual DDR4-2666
95W
$500
$62.5
인텔과 AMD의 하이엔드 프로세서 간 스펙 비교표 입니다. 9980XE는 코어당 가격이 110달러로 7980XE와 동등합니다.
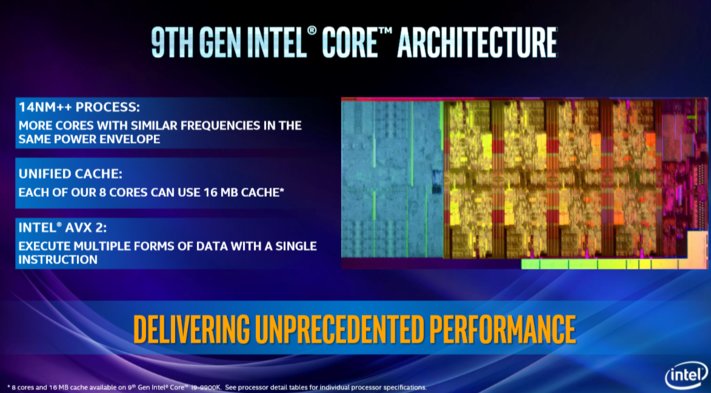
신형 Core i9-9900K, Core i7-9700K, Core i5-9600K 제품은 모두 커피레이크 아키텍처 기반에 소켓 1151 인터페이스, 14nm++ 제조 공정, TDP 95W, DDR4-2666 메모리 지원 등은 공통 사항 입니다.
각 제품은 상위 모델부터 8코어 16스레드 / 8코어 8스레드 / 6코어 6스레드이며 각 베이스 클럭은 3.6 - 3.6 - 3.7, L3 캐시는 16MB - 12MB - 9MB 입니다.
가격은 9900K 제품이 488달러, 9700K 제품이 374달러, 9600K 제품이 262달러 입니다.
Base
1 Core
2 Cores
3 Cores
4 Cores
5 Cores
6 Cores
7 Cores
8 Cores
Core i9-9900K (GHz)
3.6
5.0
5.0
4.8
4.8
4.7
4.7
4.7
4.7
Core i7-9700K (GHz)
3.6
4.9
4.8
4.7
4.7
4.6
4.6
4.6
4.6
Core i7-8700K (GHz)
3.7
4.7
4.6
4.4
4.4
4.3
4.3
-
-
Core i7-8086K (GHz)
4.0
5.0
4.6
4.5
4.4
4.4
4.3
-
-
Core i5-9600K (GHz)
3.7
4.6
4.5
4.4
4.4
4.3
4.3
-
-
Core i5-8600K (GHz)
3.6
4.3
4.2
4.2
4.2
4.1
4.1
-
-
각 제품별 동작 클럭 입니다.
9900K는 베이스 3.6에서 1~2코어 최대 5.0, 3~4코어 최대 4.8, 5~8코어 최대 4.7로 높은 클럭 속도를 나타냅니다. 9700K는 베이스 3.6에서 1~2코어 최대 4.8~4.9, 3~4코어 최대 4.7, 5~8코어 최대 4.6 클럭이며 9600K는 베이스 3.7에서 1~3코어 최대 4.5~4.6, 3코어~4코어 최대 4.4, 5코어~6코어 최대 4.3 클럭으로 동작 합니다.
U.S. Wraith Ripper Corsair H115i Enermax Liqtech 240 TR4 II
Power Consumption Measurement
Contact-free DC Measurement at PCIe Slot (Using a Riser Card) Contact-free DC Measurement at External Auxiliary Power Supply Cable Direct Voltage Measurement at Power Supply 2x Rohde & Schwarz HMO 3054, 500 MHz Digital Multi-Channel Oscilloscope with Storage Function 4x Rohde & Schwarz HZO50 Current Probe (1mA - 30A, 100 kHz, DC) 4x Rohde & Schwarz HZ355 (10:1 Probes, 500 MHz) 1x Rohde & Schwarz HMC 8012 Digital Multimeter with Storage Function
Thermal Measurement
1x Optris PI640 80 Hz Infrared Camera + PI Connect Real-Time Infrared Monitoring and Recording
Acoustic Measurement
NTI Audio M2211 (with Calibration File, Low Cut at 50Hz) Steinberg UR12 (with Phantom Power for Microphones) Creative X7, Smaart v.7 Custom-Made Proprietary Measurement Chamber, 3.5 x 1.8 x 2.2m (L x D x H) Perpendicular to Center of Noise Source(s), Measurement Distance of 50cm Noise Level in dB(A) (Slow), Real-time Frequency Analyzer (RTA) Graphical Frequency Spectrum of Noise
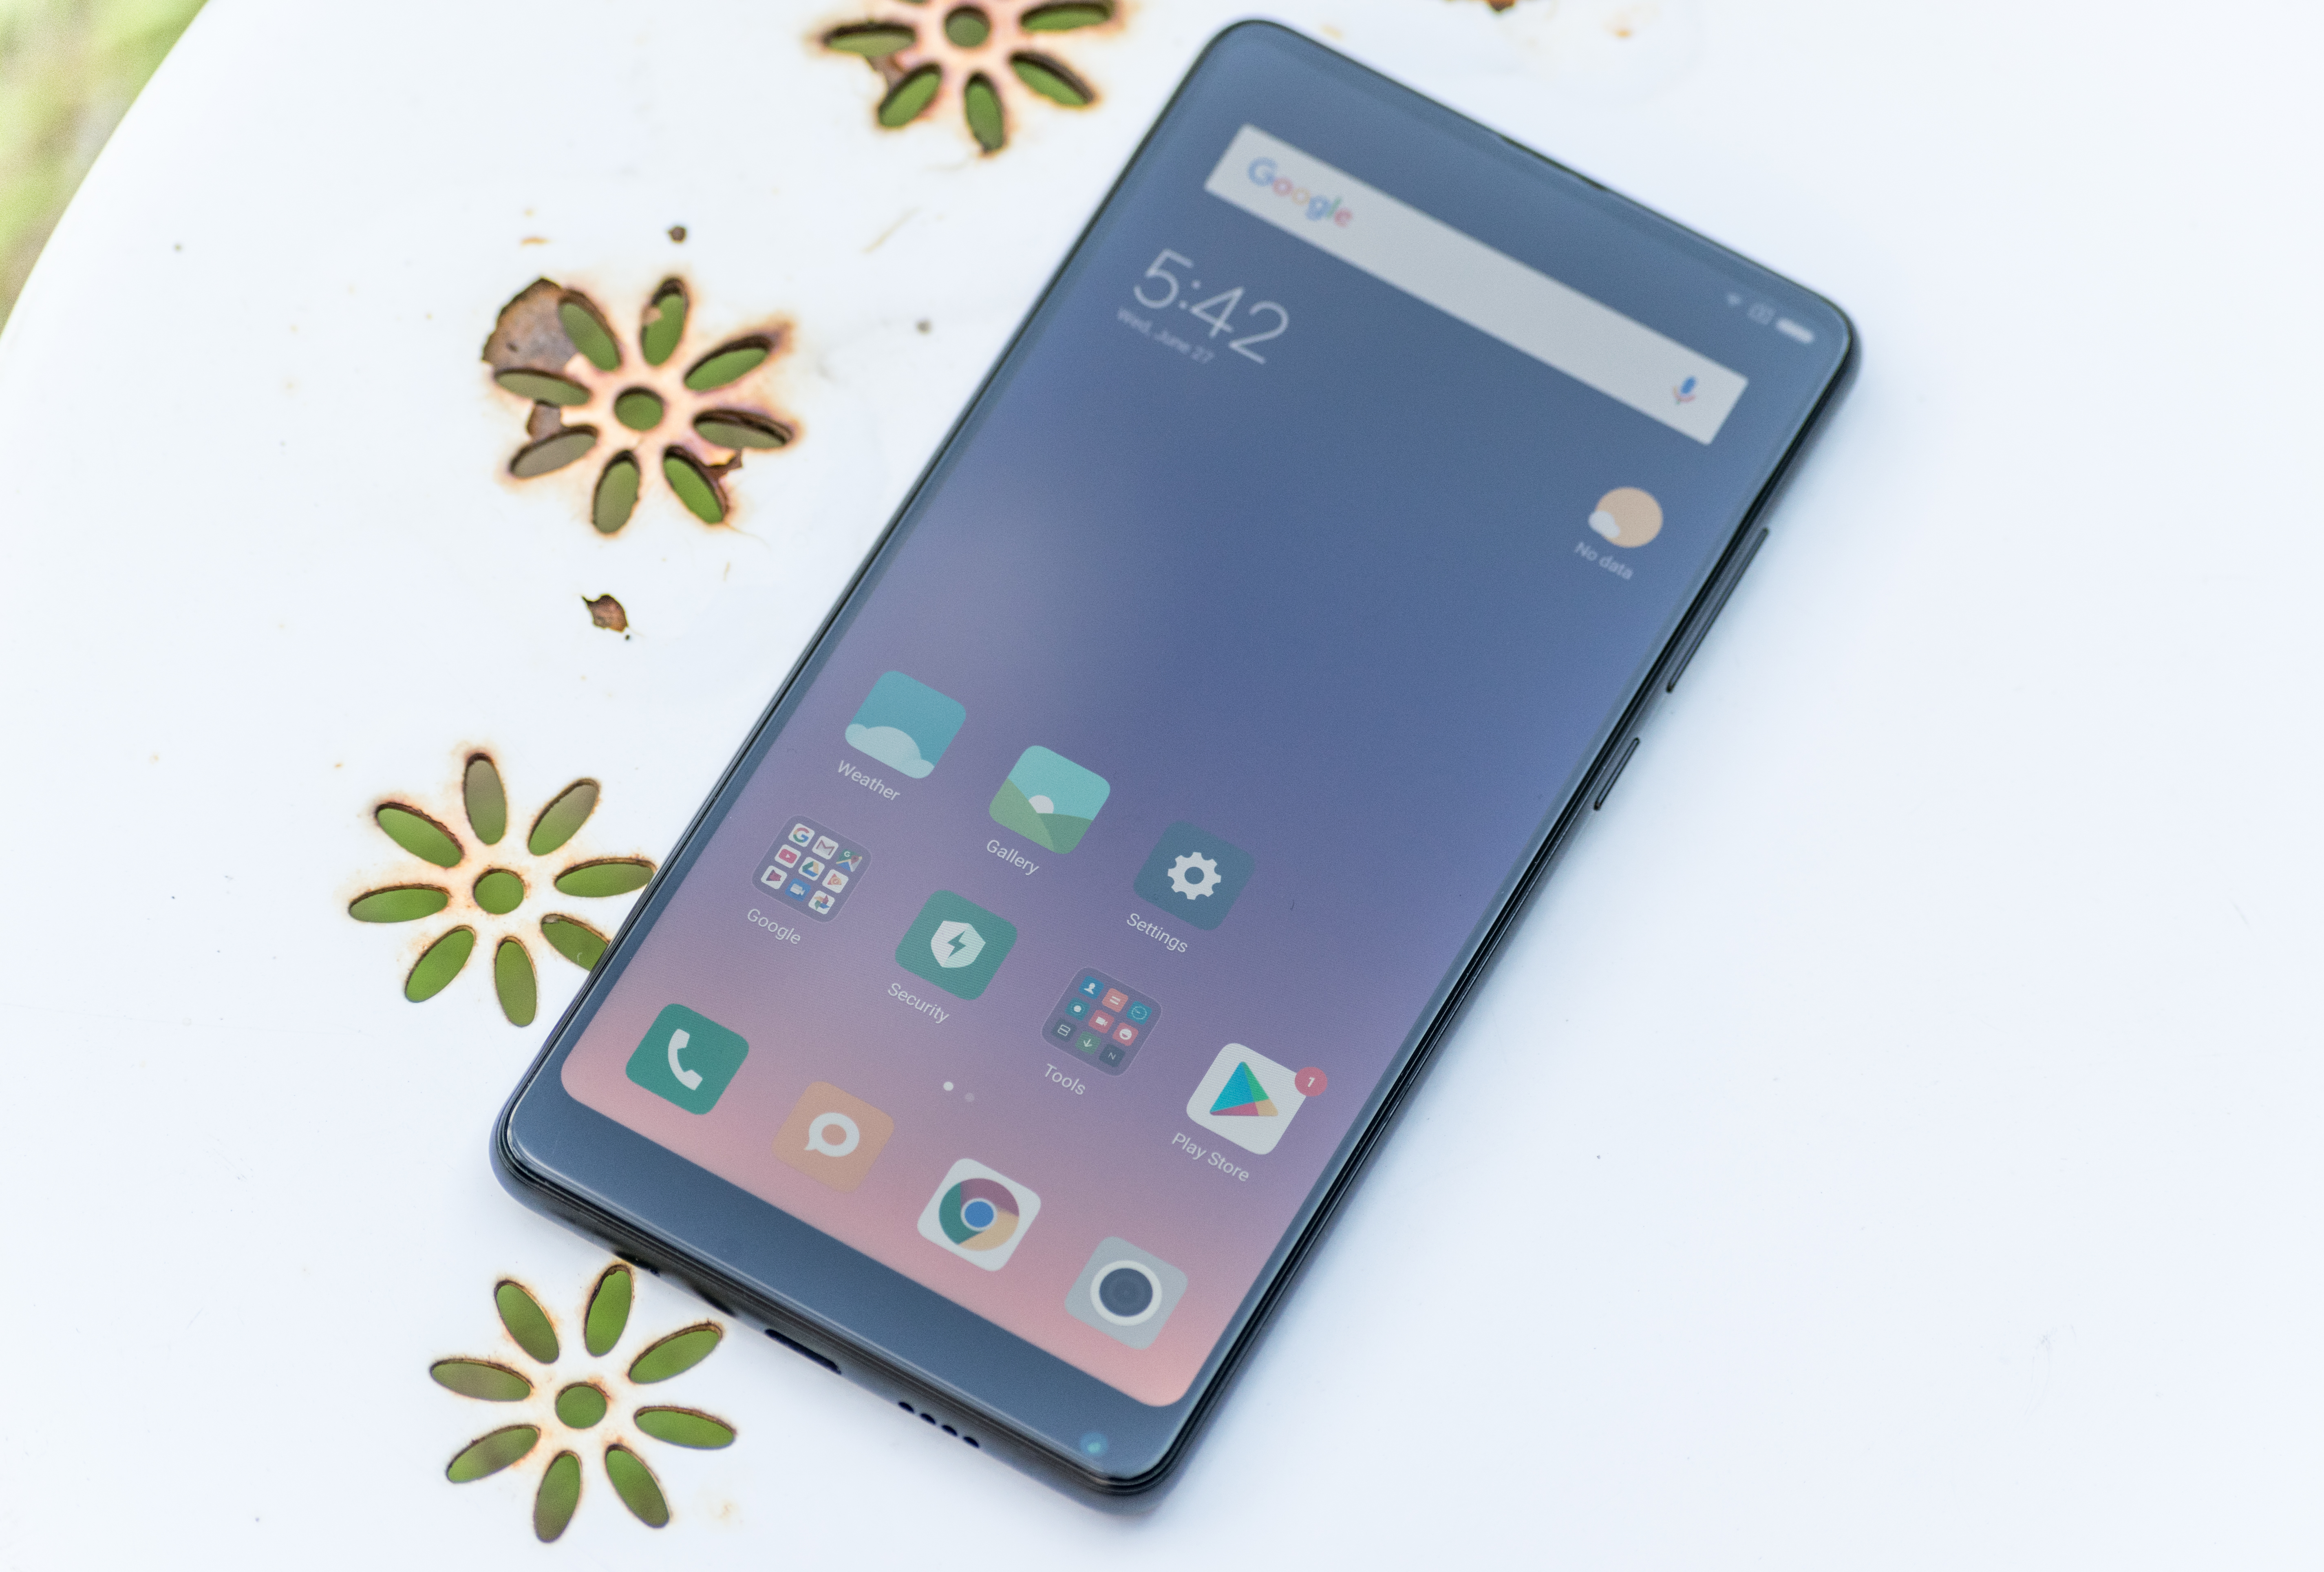
The Mi MIX 2 comes with a Snapdragon 845 and we’ve more extensively covered the performance and characteristics of the SoC in our performance preview as well as in the Galaxy S9 review. So while we’re not expecting any surprises in terms of performance, we’ll see that software configurations can be differ quite a bit from the implementation that we’ve tested on Samsung’s devices.
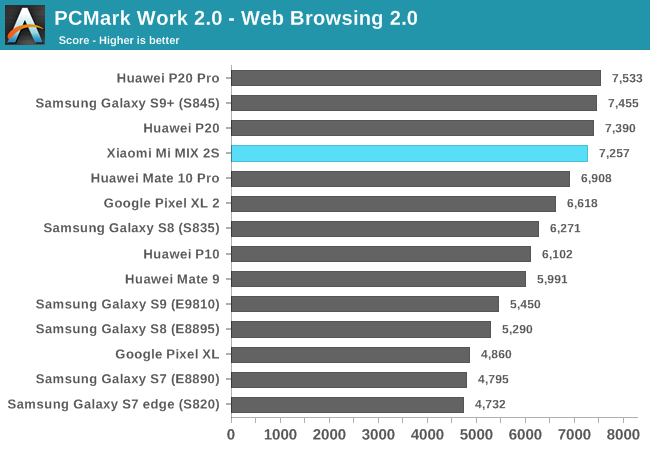
In the PCMark’s Web Browsing 2.0 test the difference in performance isn’t too great. The test’s workload has become relatively light-weight enough in that its tasks have become short enough to not fully migrate to larger cores at the peak operating performance points.
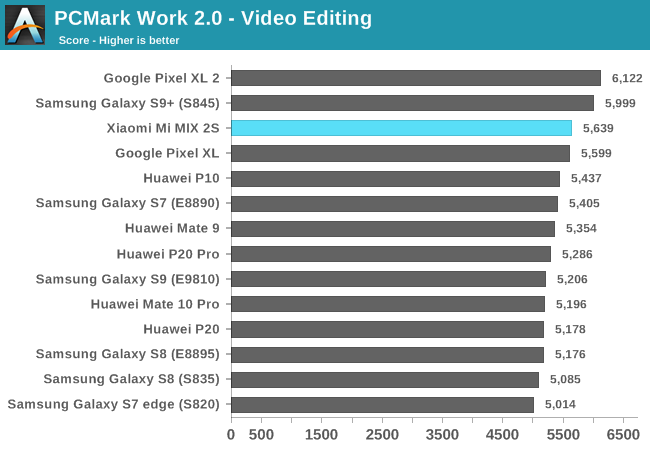
The video editing test is also a test in which most of today’s flagships only show minor differences between each other.
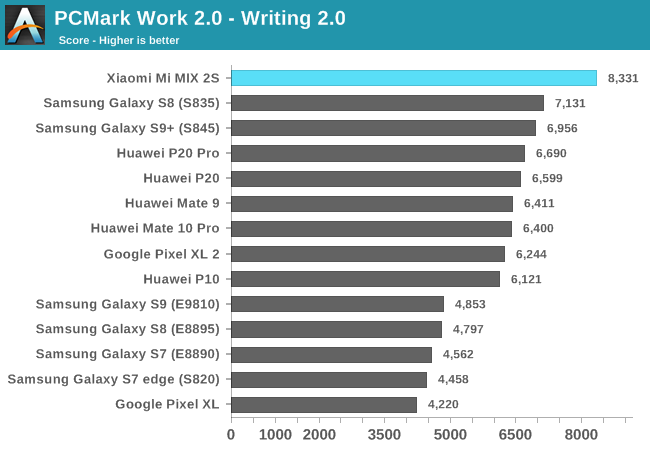
While the first two PCMark tests are reaching their limits in terms of performance scalability, the writing test is still insanely sensitive to both peak performance as well as performance latency. The test uses native Android APIs for text manipulation and also renders PDFs out of the resulting document. Here the Mi MIX 2S actually showcases a significant jump over the Galaxy S9+, and actually finally come near or even beats the scores of the QRD845 platform from Qualcomm that we previewed back in February.
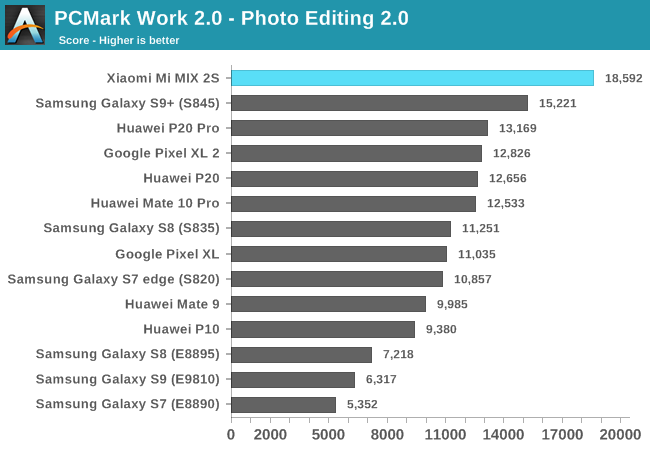
The Photo Editing test is also characterized by short but heavy enough bursts of work. Again the MIX 2S shows a significant improvement over the Galaxy S9 and leaves all other devices in its trail.
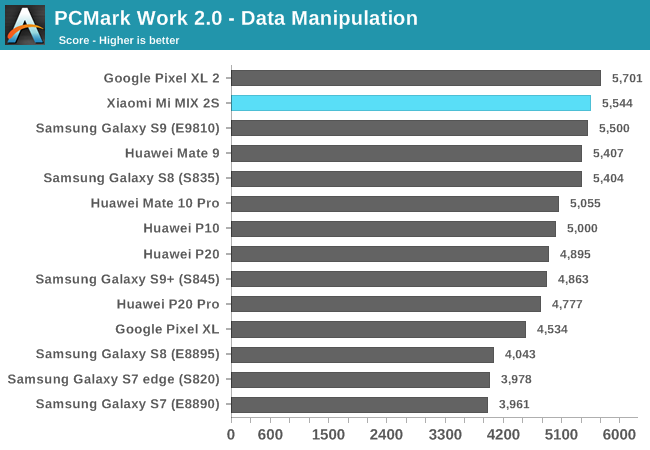
Finally the Data Manipulation test is a lot more evened out – this is mainly a single-thread bound workload, which also seems to be very memory latency sensitive as the Snapdragon 845 devices have trouble differentiating themselves from last year’s 835 units – a scenario that we also see in the Kirin 970 devices from Huawei.
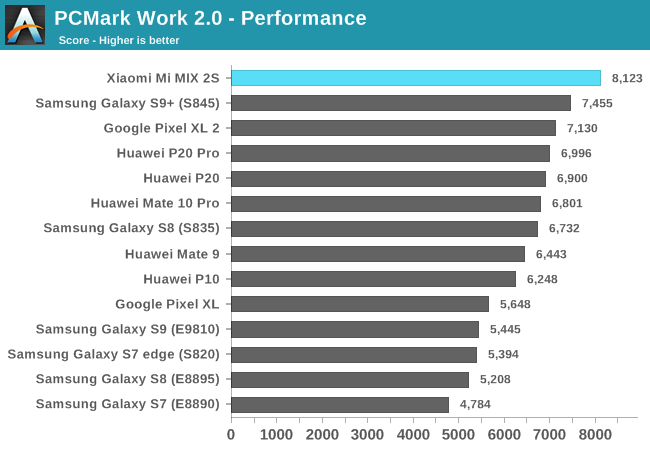
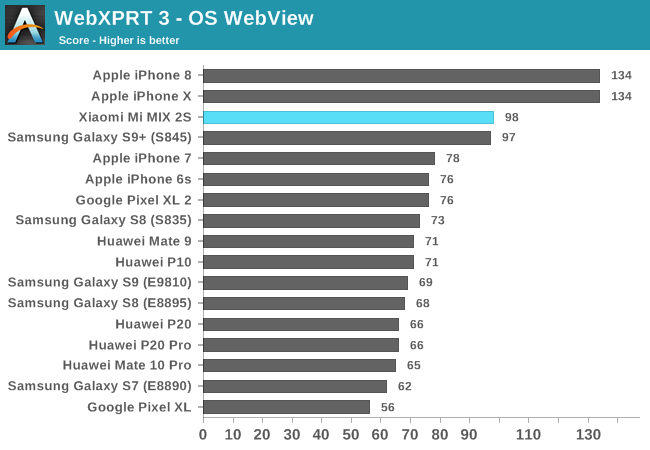
Overall, the MIX 2S trumps the Snapdragon Galaxy S9 as the fastest Android device. This also very much reflects in daily usage as the phone is incredibly fast in terms of subjective usage, and in my view, is to date by far the fastest device I’ve had the pleasure to use.
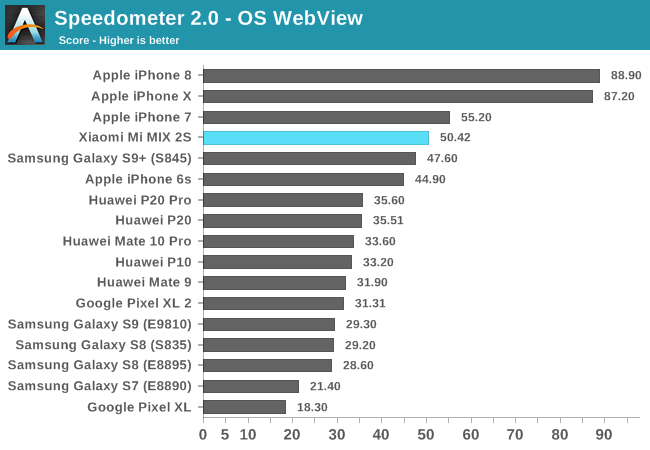
The web browsing tests show a similar improvement, pushing the further the scores that we’ve seen with the Galaxy S9+ and claiming the best Android performance among currently tested devices.
Applause to Qualcomm and Xiaomi
Over the last several months I had more opportunity to dive into the software of the Snapdragon 845 – in particular in the context of my efforts to try to improve the Exynos 9810 variant of the S9. What Qualcomm has done in terms of rewriting the kernel scheduler is pretty astounding, as the modifications are quite extensive and heavy. I’ve talked to both ARM and Google about this and generally I think the two are underplaying or are unaware of the magnitude of the improvements.
I actually would not be surprised that if a majority of the performance improvements we’re seeing across the new Snapdragon 845 devices are in a great part due to software enhancements in the kernel rather than raw microarchitectural advancements. Performance latency is an incredibly important characteristic of system performance – and vendors need to pay a lot more attention to it, as in the grand scale of things, the cost of writing good software just seems minuscule compared to the vast investments needed to design and manufacture faster silicon chips and to brute-force the issue.
It’s very unusual for me to go into a rant like this praising a vendor – the Mi MIX 2S made such a good impression in terms of performance that I just have to laud Xiaomi and Qualcomm for the efforts made here, and I have to reiterate that the MIX 2S has been the fastest device I’ve used to date.
GPU Performance
On the GPU performance side, I’m expecting again very good results as we’ve investigated the performance of the Snapdragon 845 and the Adreno 630 GPU in depth in our Galaxy S9 review. The Mi MIX 2S should not differ too much from the S9 – apart from maybe slight differences in thermal dissipation capabilities or maybe different thermal throttling configurations.
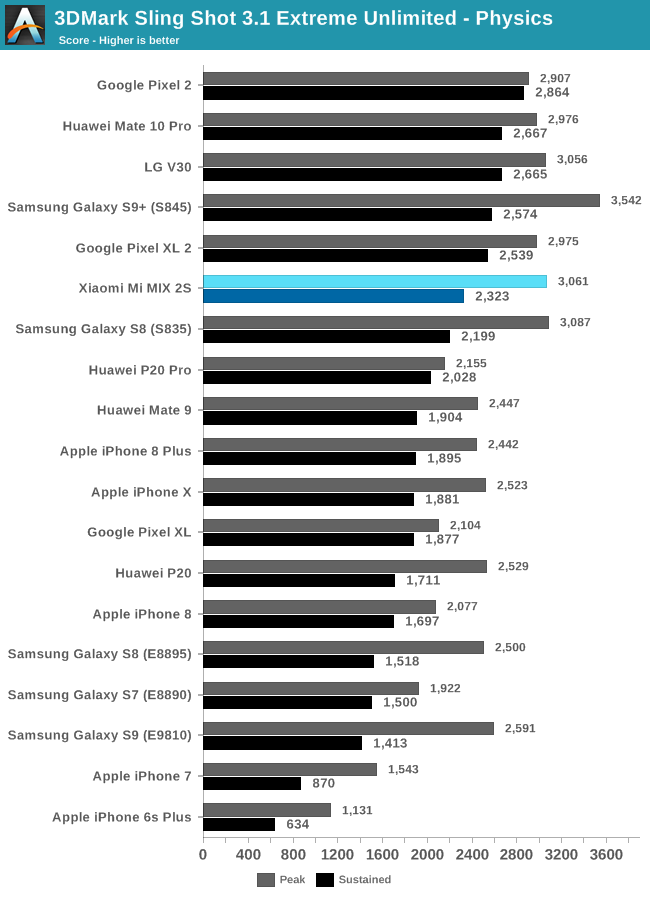
In Futuremark’s Sling Shot 3.1 Extreme Unlimited Physics test (I’m hoping for shorter benchmark names in the future), the Mi MIX 2S actually performed quite a bit less than the Galaxy S9+. This test is mostly CPU bound, and the only explanation I have here for the results is that Xiaomi must have had made changes to the thermal balance between CPU and GPU and limited the CPU performance more in 3D workloads.
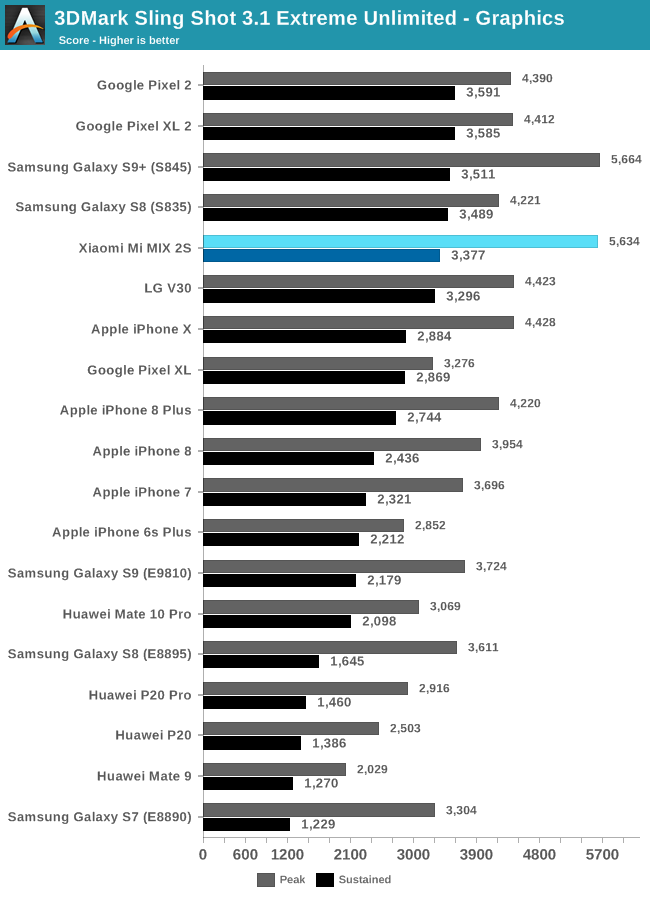
In the graphics score results of the test, the MIX 2S performed a lot closer to the Galaxy S9, posting identical peak performance figures while having only slightly slower sustained performance. Unfortunately we’ve verified both with a second Galaxy S9+ as well as now with the Mi MIX 2S that the sustained performance degradation of the Snapdragon 845 was not an isolated case. This makes sense given that the increased peak performance of the Adreno 630 seems to have come from increased power draw, exceeding the 5W figure in ALU heavy workloads. As naturally phone thermal envelopes can only sustain 3-3.5W SoC TDPs, performance has to go down over time to keep temperatures in check.
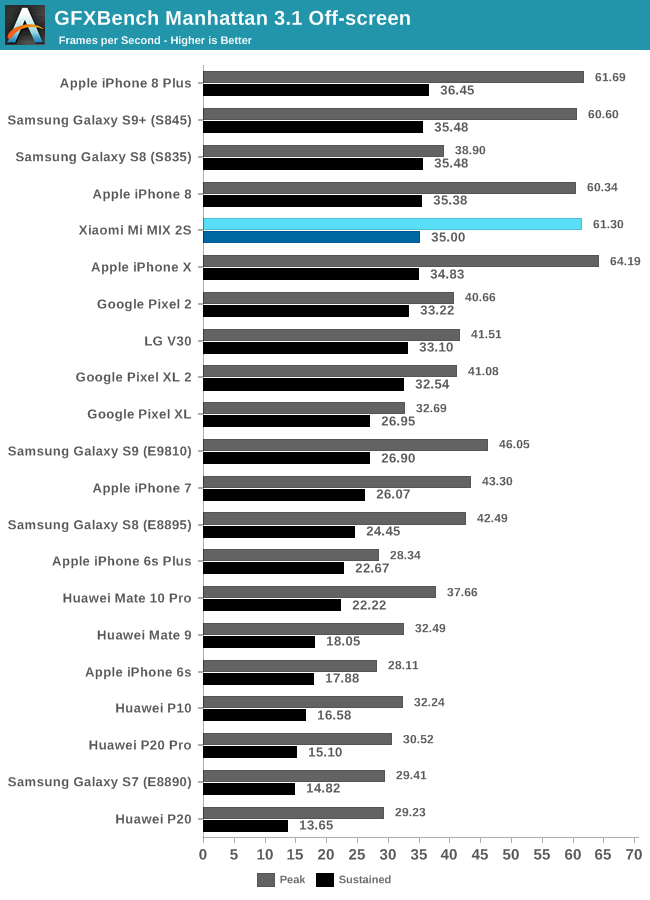
Manhattan 3.1 Off-screen performs again nearly identically to the Galaxy S9+, topping the benchmark scores.
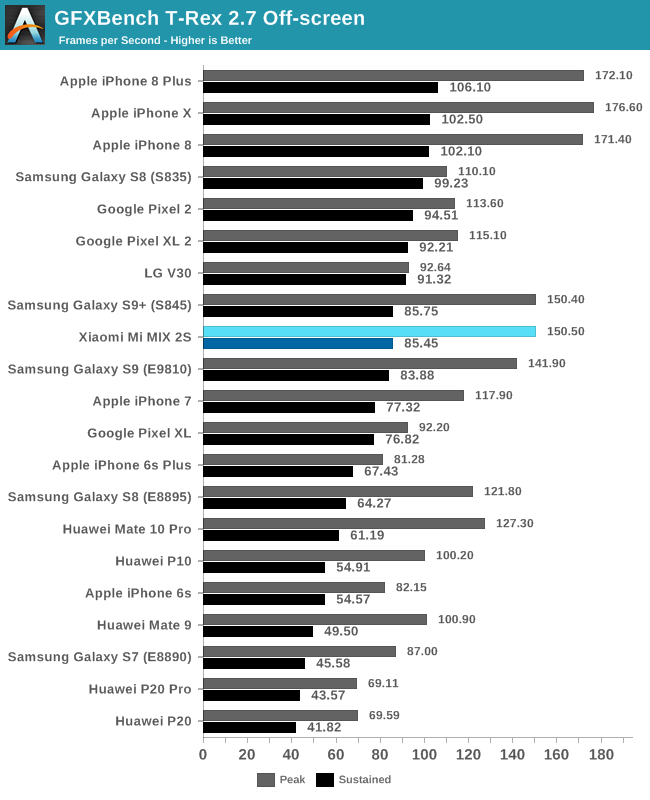
T-Rex also matches the Galaxy S9+. The performance of the S845 devices here seems to be lower as the benchmark is running at high fps figures and demanding a lot of memory bandwidth – it’s possible that the increased memory latency on the S845 chips is hindering the performance and efficiency of the chip compared to the S835 in this case.
Overall, in terms of 3D performance the Mi MIX 2S leaves little complain about. While the increased peak power is of a concern, I’ve only found few games and real scenarios where the higher GPU frequencies are actually currently needed. Over the coming months I’m also planning to expand the GPU testing methodology and among other things try to introduce a “real game” battery or power draw test that doesn’t actually require peak performance, but rather maximum efficiency for a given workload. We’ll also hoping to introduce Vulkan GPU tests from Kishonti as well as evaluating the recently announced Basemark GPU.
Display Measurement
The MIX 2S comes with an LCD IPS panel sourced from JDI alongside a Novatek NT35596S DDIC driving it. Notably there’s some concerns on the side of the display as I saw that it’s running in video mode instead of command mode – something that’s not beneficial to power consumption as the SoC has to continuously send display data to the DDIC over the MIPI interfaces. I’m not sure why Xiaomi chose to drive the display in this way – one reason could be cost cutting as it simplifies the implementation. Both the DDIC and the SoC obviously support command mode so it doesn’t seem to be a technical limitation.
There’s also concerns about the display panel itself – one of the things that immediately popped out to me was that the panel had some noticeably slow pixel response times and this resulted in ghosting and trailing. I found this quite annoying and it was one of the reasons why I didn’t like using the phone over prolonged times.
Viewing angles while being good in-axis, showcased some less spectacular performance off-axis, with noticeable reduced contrast from certain angles. It’s unfortunate to see that Xiaomi opted for a less than perfect display panel for what is essentially one of their flagship devices – as both the response time issue and the viewing angles alone make this a notably worse display than what we’re used from LCD screens from LG or Apple.
Nevertheless, we move on to the usual display characterisation.
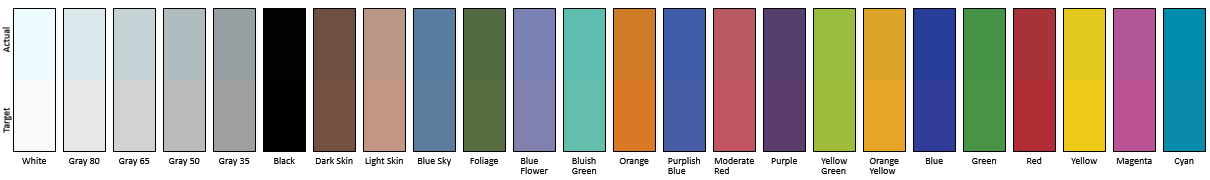
Yet another Android 8.0 phone, yet another new phone that doesn’t support Android’s new colour management. At this point I do ask myself if we’ll ever see any kind of wide-spread support – as far as I’m aware the Pixel devices are still the only phones who support it. Hopefully 2019 is the year where we’ll finally have vendors try to reconciliate their own colour profiles with actual true colour management.
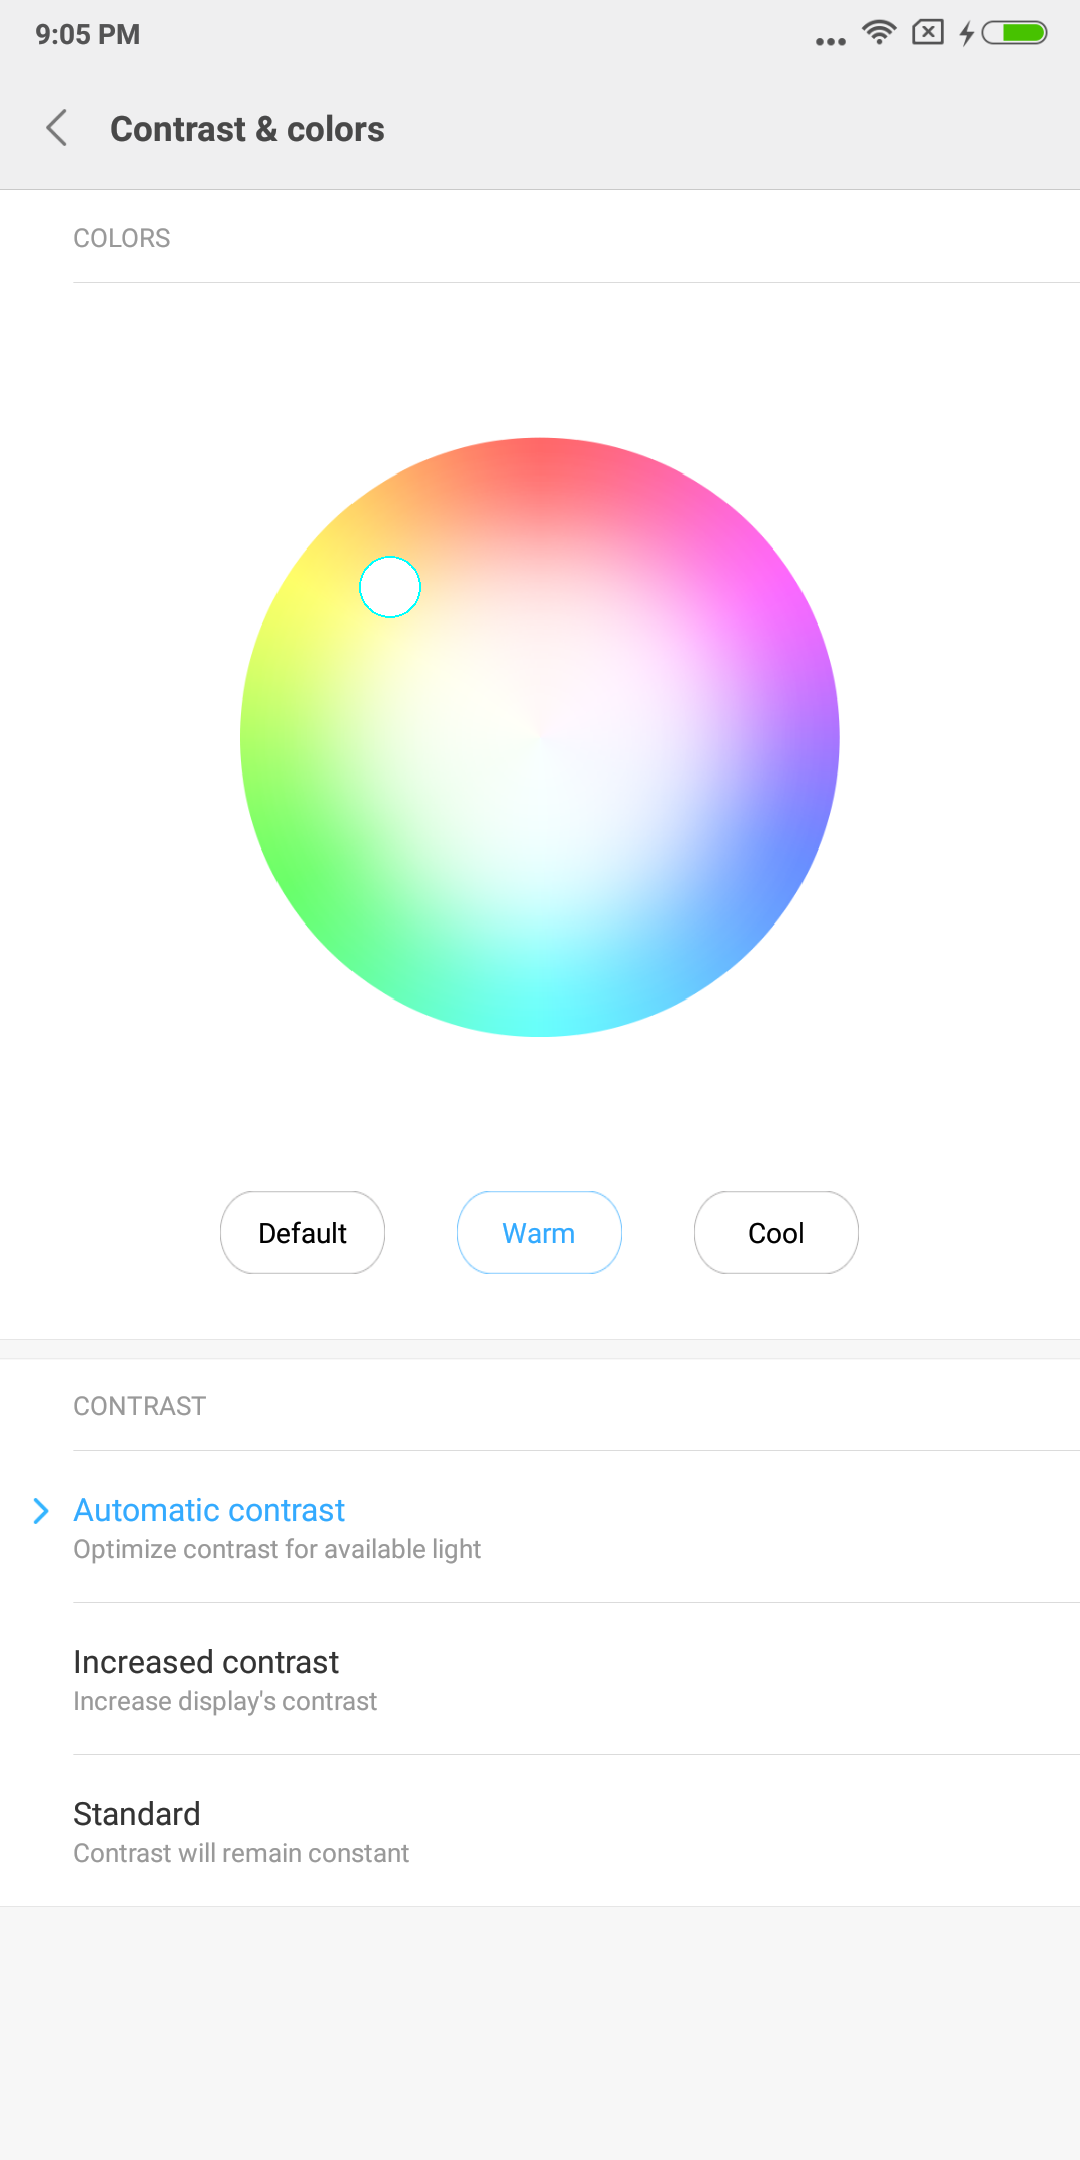
Xiaomi supports 3 colour profile modes: “Automatic contrast” with selectable default, warm or cool colour temperature presets; a custom mode that targets DCI-P3 but has some interesting quirks, “Increased contrast” which targets DCI-P3, and “Standard” which targets an accurate sRGB profile.
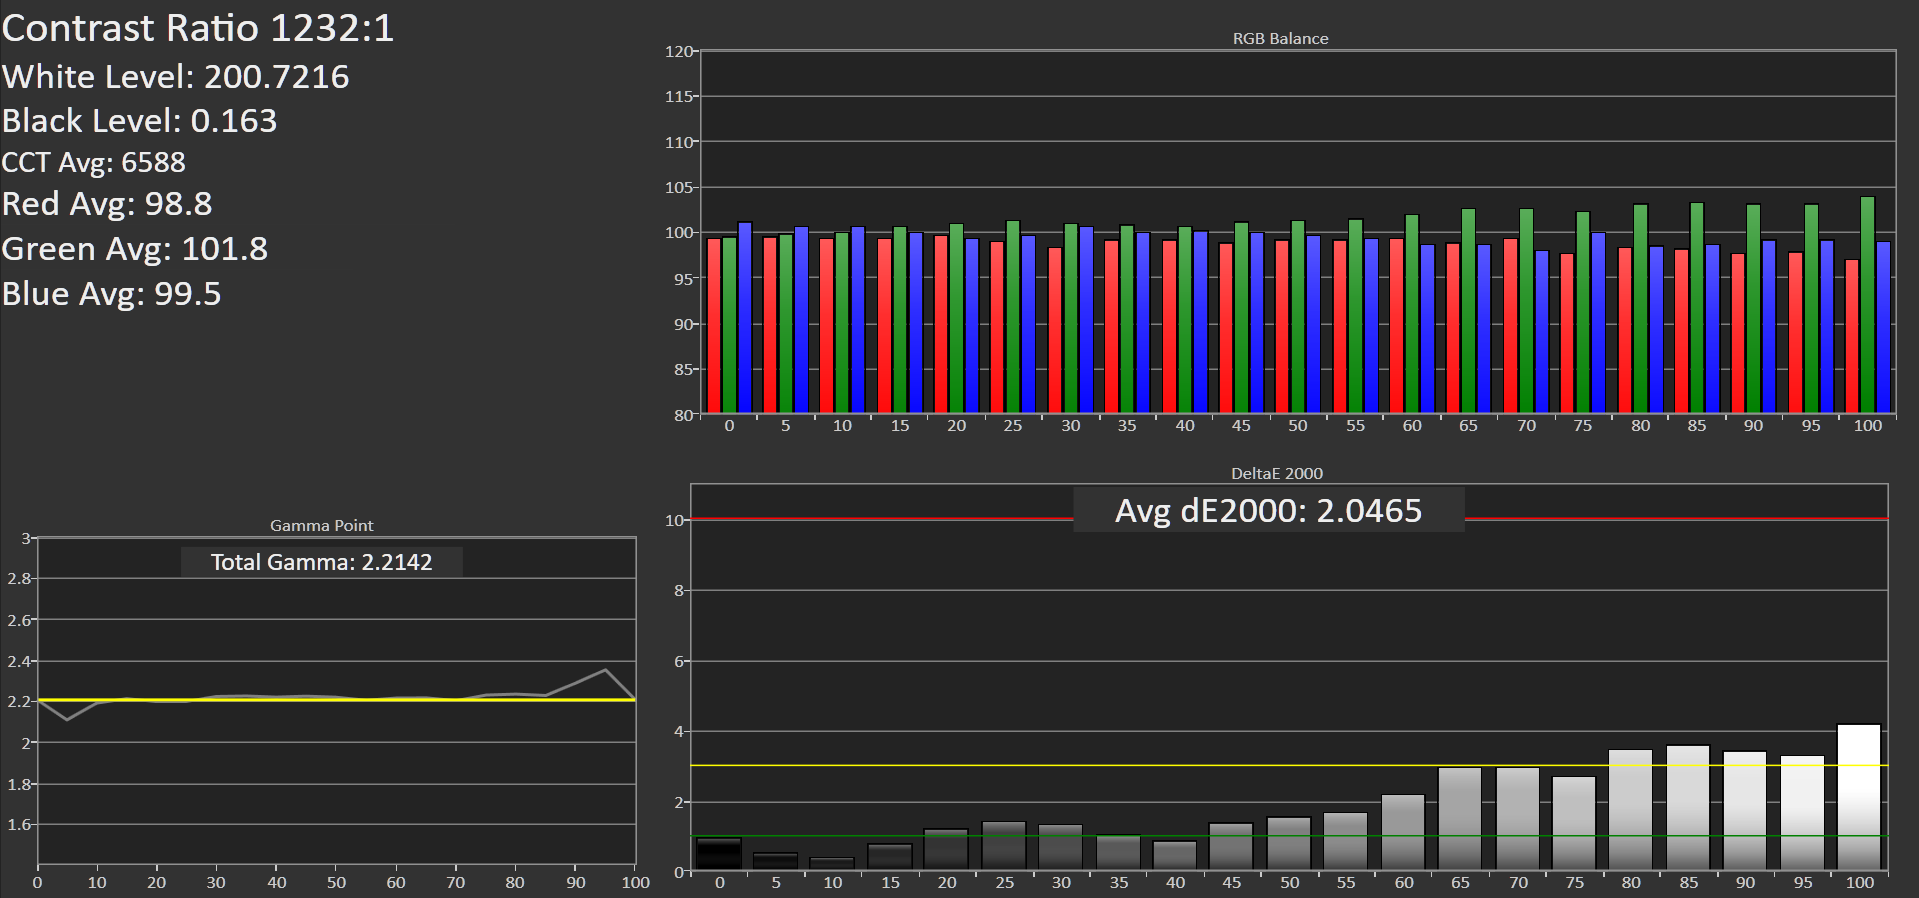
In terms of grayscale accuracy, the “Standard” sRGB mode is the most accurate with a colour temperature of 6588K. Maximum brightness comes in at 465cd/m² and there is no automatic brightness boost in brighter scenario conditions. Minimum brightness could go extremely low down to 0.94nits which offered some excellent night-time reading.
The “Automatic Contrast” mode by default targeted some very cool colour temperatures, and actually the “warm” pre-set still came in at 7290K so still not very accurately balanced. The interesting thing about the “Increased contrast” mode is that it actually offered an increase in contrast – while this might seem straightforward when taking into account its naming, as we’ll see later on it’s quite perplexing as in theory we shouldn’t be seeing a contrast change just due to a change in the colour space.
Direct sunlight vs indirect sunlight
In direct sunlight, the MIX 2S is notably weaker than competing phones in terms of offering good legibility – the 465-ish nits without any boost or increased contrast mode is still useable, but just doesn’t offer the same convenience as Samsung’s high-brightness modes or simply increased brightness boosts to >600nits.
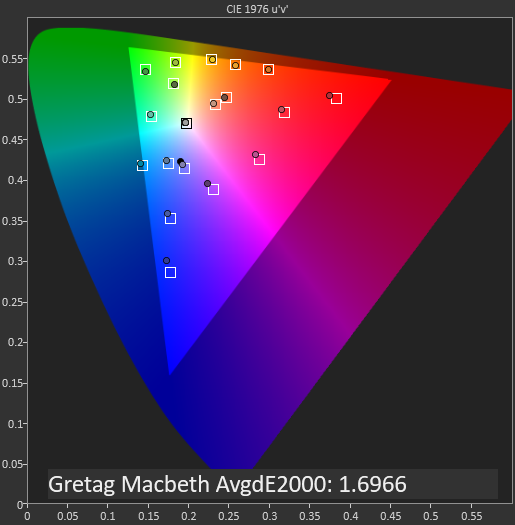
In the standard sRGB mode, the gamut and saturation accuracy is excellent with an overall deltaE2000 of 1.62. Only in the blue spectrum it looks like the calibration is slightly undershooting the target chromacity.
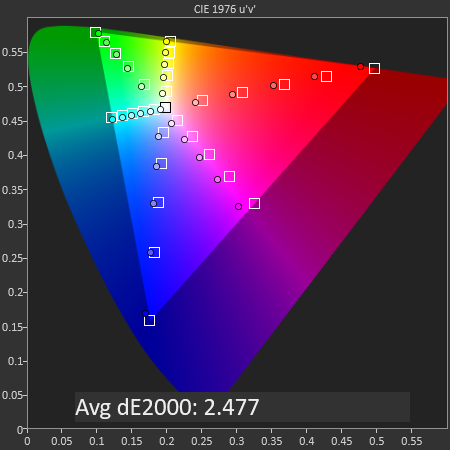
In the “Increased Contrast” and “Automatic Contrast” modes we see both targeting the DCI-P3 colour space. It’s actually unfortunate that the mode that is actually meant to be accurate to the profile ends up missing it due to the blue shift of the non-configurable colour temperature. It looks like Xiaomi’s is simply using a linear colour offset to achieve the target colour temperature – we’ve had far more accurate and sophisticated calibration mechanisms from vendors over the years. This issue actually makes the Automatic mode in the “Warm” preset the more accurate DCI-P3 profile in terms of saturations… but there’s more to the story.
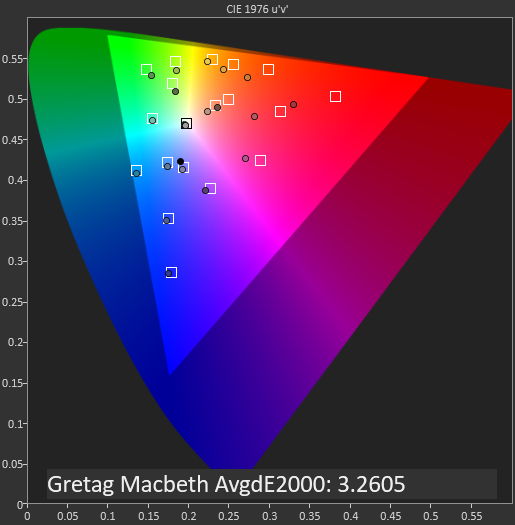
Switching over to the GMB charts, we see the sRGB mode again showcase very accurate results. The increased contrast DCI-P3 mode is again suffering from inaccuracies due to the blue shift in the spectrum, raising the error rate across all measurements.
Switching over to the automatic mode, we see some very odd results. I had expected the automatic mode in warm preset to be more accurate than the increased contrast DCI-P3 mode, as this didn’t suffer from the exaggerated blue shift. Instead the colours seem far more compressed, seemingly as if they’re targeting the sRGB colour space. I had triple-checked this several times and indeed this seems that’s actually what’s happening. Although the automatic mode operates in the full gamut of the DCI-P3 colour space, and the saturations measurements are quite accurate, the GMB colours are mapped in the sRGB colour space.
What Xiaomi seems to be doing here is they have a unique approach to wide-gamut displays without software content colour management. You get the benefit of “popping” and vivid colour, yet skin tones appear largely normal. The result isn’t really accurate by any standard, but it’s still a great compromise that reduces some of the more “off-putting” aspects of highly saturated display modes.
Overall the Mi MIX 2S’s screen is relatively average. It has very accurate sRGB colours if that’s what you value – but on the other hand there’s some large negatives in terms of maximum brightness, less than optimal viewing-angles, and most particularly for me the most negative point, the slow pixel response times of the panel. I might be nit-picking here, but as we’re comparing flagships to flagships, the MIX 2S’s screen just isn’t top-tier, especially in the context that its bezel-less design that is meant to make the display the centre-piece of the phone. Subjectively, it’s still a very good display – and given the price point of the device, it might not be that big of a draw-back, but buyers just shouldn’t have too high expectations.
Battery Life
The Mi MIX 2S comes with a 3400mAh battery – a relatively average size given that now we’re starting to see competitor devices with similar form-factors employ 4000mAh units, such as the Huawei P20 Pro. The larger concern for me was how the increased performance characteristics of the Snapdragon 845 as well as the JDI panel will fare in terms of overall device efficiency.
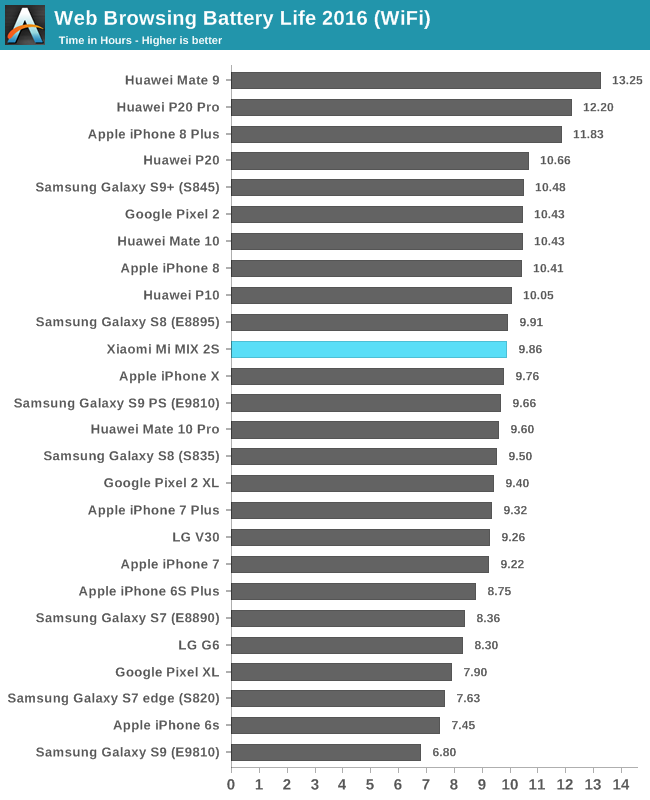
In the web browsing battery life test, the Mi MIX 2S lands with an average 9.86h runtime. This is slightly lower than the Galaxy S9+ - although the MIX 2S also shows slightly better performance. It’s interesting to see that although the MIS 2S only has a 1080p screen, it actually doesn’t really pull in any advantage in efficiency. I’m wondering if it’s in part due to the fact that this is a video-mode screen, or as I’ve simply strongly suspected over the last couple of years – the difference in screen resolution makes for very little difference in battery life, especially if you’re comparing it to a higher resolution OLED screen which doesn’t suffer from decreased light transmissivity at higher resolutions like LCDs do.
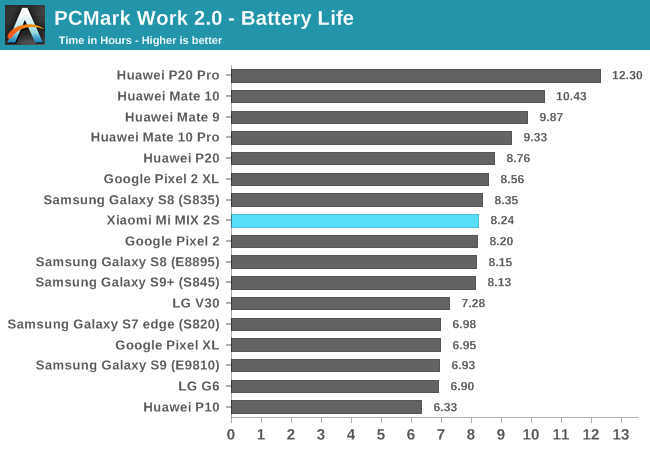
In the PCMark battery test we see a more interactive workload with varying picture levels and workload types. Here the MIX 2S also lands square in the middle of current devices; beating the Galaxy S9+ by a few minutes.
Overall the MIX 2S has very good battery life. It doesn’t quite compete with Huawei’s recent devices which are in a league of their own right now, but it more than matches anything else in the market. The only negative thing I’d say is that it’s a pity that it doesn’t really seem to distance itself from the Galaxy S9+ ; both devices have similar form-factors, the same SoC, and almost equal battery capacities. Yet the Mi MIX 2S’s has a lower resolution LCD screen, but that doesn’t really help it in terms of battery life. I’m sure that Xiaomi could have optimised the battery life through a better selection of display panel, as it seems that it’s one of the MIX 2S’s weak points.
Camera - Daylight Evaluation
The Mi MIX 2S’s sports a completely new camera system over the MIX 2. The rear camera migrates from its central position above the fingerprint sensor to the side corner of the device – adopting the same camera housing design as first introduced by the iPhone X and subsequently carried over to many other designs from other vendors. The main sensor remains at a 12MP resolution, but the sensor size from Sony increases as we move from 1.25µm pixel pitch to 1.4µm pixels. The aperture as well increases from F/2.0 to F/1.8. Alongside the standard module we now also see a zoom module – this is a small 12MP sensor from Samsung with only 1µm pixels as well as a comparatively small F/2.4 aperture.
Xiaomi’s camera application is no-nonsense and offers a very straightforward capturing experience. In contrast to my last review where I covered the Huawei P20 and P20 Pro this is a complete opposite design philosophy and Xiaomi embraces the KISS principle (Keep it simple, stupid), and essentially beyond a toggle for an “AI” button, you won’t ever have to mess around with capturing modes as the defaults will always give the best results, as it should be.
In the daylight shots we’re looking at an overcast day – although this scenario should be relatively easy for smartphone cameras as we have far less dynamic brightness in the scene, we still see that phones have had issues in terms of exposure and HDR processing for the correct target levels.
[ Mi MIX 2S ] [ P20 Pro ] [ P20 ] -[ P10 ] -[ Mate 10 Pro ] [ Galaxy S9+ ] -[ iPhone X ] -[ Pixel 2 XL ]
The MIX 2S captures were in my opinion among the best as it offered the most balanced exposure and HDR processing in terms of bringing out details in the greenery without overdoing it like many of the competing phones. While exposure and HDR processing was good – the MIX 2S did oversaturate it just a bit too much, with the real scene still being closer to the Galaxy S9’s good take.
The MIX 2S also surprises in terms of detail – it seems to be really competing with the Galaxy S9 and Pixel 2 in this shot, although the latter two have more detail contrast. Xiaomi seems to have a very light touch in terms of detail processing as I essentially don’t really see any sharpening at all – and there are hints of noise in the picture.
In the telephoto shot with the 2x zoom lens, Xiaomi manages to get the best exposure and colour reproduction result among the 2x devices, only Huawei’s 3x sensor seems to best it. In terms of detail on the zoom lens, it also competes favourably although there’s some blur. Here although the iPhone X produced the noisiest picture, it also retained the most detail. Huawei’s 3x zoom still obviously wins due to the optical magnification and also has very clean detail retention.
[ Mi MIX 2S ] [ P20 Pro ] [ P20 ] -[ P10 ] -[ Mate 10 Pro ] [ Galaxy S9+ ] -[ iPhone X ] -[ Pixel 2 XL ]
In this shot the MIX 2S does a great job at exposure and HDR – with again the same characteristic that it’s oversaturating a tad too much. Both Samsung and Apple’s picture are too dark, while the other phones all have different issues in terms of processing to deal with.
The MIX 2S also did fantastic in terms of detail retention as it manages to get most out of the whole picture, clock tower including foreground foliage.
In the telephoto shots, the 2S didn’t do quite as good in terms of exposure as it balanced too much for the foreground instead of the clock tower. This resulted on not too great exposure on the target object. The iPhone X had the best 2x zoom result, while the P20 Pro had the best maximum zoom result with best noise and detail retention.
[ Mi MIX 2S ] [ P20 Pro ] -[ P20 ] [ P10 ] -[ Mate 10 Pro ] [ Galaxy S9+ ] -[ iPhone X ] -[ Pixel 2 XL ]
The next scene again sees the MIX 2S do excellent exposure balance with seemingly again too much saturation. I could see why some people might prefer Xiaomi’s result, but that’s a subjective matter.
Detail retention again is outstanding on the MIX 2S, with essentially no really visible sharpening in the image, which is immensely helpful in maintaining the foliage throughout the whole scene, although the S9 does produce a much sharper image, even if it’s slightly more artificial.
The zoom shot in these scene seemed slightly underexposed for the MIX 2S, although colour rendition is excellent and doesn’t suffer from the oversaturation of the regular wide shot. In terms of detail retention the MIX 2S did better than the S9, but loses out to the iPhone X. Here we might see some of the limitations of the small 1µm sensor on the zoom module of the 2S as it has trouble with detail retention and noise. The P20 Pro’s 3x zoom module is still king in terms of telephoto quality.
[ Mi MIX 2S ] [ P20 Pro ] -[ P20 ] -[ P10 ] -[ Mate 10 Pro ] [ Galaxy S9+ ] -[ iPhone X ] -[ Pixel 2 XL ]
Exposure seems to be the MIX 2S’s camera forte, and the difference in processing choices is very visible in this shot. Xiaomi produces a much softer and natural image, while Samsung and Apple are trying to bring out more highlights. The iPhone X seems to overdo the HDR processing and thus loses dynamic range in the darker areas. Samsung opted for a higher exposure overall so the picture is brighter.
Detail wise the MIX 2S certainly isn’t the best as the S9 from Samsung just has more contrast over the whole scene, but the 2S still performs very respectably and produces a very natural look as it avoids any sharpening post-processing.
This is also an excellent scene to demonstrate the difference to the AI pictures – overall what the toggle seems to is to apply different colour and saturation levels depending what it detects in the scene. The exposure remains the same so overall the only change here is the post-processing, making the picture’s colours more saturated and pop a little more. I do think Xiaomi is taking a balanced approach here and the result can be subjectively more attractive to users if they so wish such a result.
[ Mi MIX 2S ] [ P20 Pro ] [ P20 ] -[ P10 ] -[ Mate 10 Pro ] [ Galaxy S9+ ] -[ iPhone X ] -[ Pixel 2 XL ]
This scene again we see good exposure balance from the MIX 2S, although it’s not as great as previous scenarios. Here the MIX 2S opts for a very short exposure, and the disadvantage can be seen in the shadows as it’s retaining less dynamic range than the competition. Colour-wise, it’s still on the saturated side. Funnily enough if you go through the shots from Apple to Samsung to Xiaomi you’ll see the increasing colour saturations.
Detail wise again, Xiaomi keeps it very natural and that works out in the brighter objects in the scene, but loses out in the shadows due to less dynamic range captured.
The telephoto shot had a much different exposure and avoid the lack of details in the shadows. The result did seem overall too flat though as it’s trying to capture more of the sky instead of the foreground, thus giving Samsung and Apple an advantage in terms of dynamic range in the highlights.
Detail wise the MIX 2S is neck-in-neck with the iPhone X and beating the S9’s telephoto result, so the better picture is solely judged on exposure results, which I would give it to the iPhone. Naturally the P20 Pro still wins by sheer quality of the increased magnification while retaining excellent exposure balance.
[ Mi MIX 2S ] [ P20 Pro ] -[ P20 ] -[ P10 ] -[ Mate 10 Pro ] [ Galaxy S9+ ] -[ iPhone X ] -[ Pixel 2 XL ]
In this alley shot the MIX 2S compares most closely to the Pixel 2 XL in terms of exposure balance, while being just a little brighter in the shadows. Overall it’s an excellent representation of the scene, even though Samsung and Apple have more contrast and brighter highlights.
Detail wise the MIX 2S doesn’t do as well here as it’s lacking definition and contrast to bring out details throughout the scene. It has the most similar processing to the iPhone X, but the latter just retains more detail overall.
[ Mi MIX 2S ] [ P20 Pro ] -[ P20 ] -[ P10 ] -[ Mate 10 Pro ] [ Galaxy S9+ ] -[ iPhone X ] -[ Pixel 2 XL ]
In the last scene, the MIX 2S again results in great exposure balance, although it’s not as bright as some of the competition. The AI feature again can help to bring out more colours by increasing saturation and contrast. Xiaomi’s choice of applying little noise reduction comes in favour of the MIX 2S as I feel it retains better details than the iPhone X, falling only short of the S9.
Overall in terms of daylight capture, I was very impressed by the Mi MIX 2S due to mainly one factor: it had one of the most consistent shooting experiences out of the range of current phones I’ve tested. Exposure balance and dynamic range retention was most of the time above that of other devices. Detail retention, while it does lose in some scenarios to the S9 and iPhone X, is still very good, and Xiaomi’s choice of staying with a softer, more natural look in the images can be beneficial as it doesn’t fall to the double-edged sword that is post-processed sharpening.
The telephoto lens on the MIX 2S is good – I think it does beat the S9’s in terms of consistency and balance between exposure and detail, and it also has more natural saturation compared to the wide camera. I still prefer the iPhone X’s telephoto, and naturally the P20 Pro’s zoom lens is a step above the competition.
Lastly, the AI feature, unlike Huawei’s implementation on the P20’s – is actually non-detrimental on the MIX 2S. It offers an alternative colour palette and more saturations without overdoing it, and I can see it being popular with certain users.
Camera Video Recording
The MIX 2S keeps it simple in terms of video recording modes, you have the option to shoot in 4K, 1080p, or 720p, all at 30fps with no 60fps option. High-frame-rate / slow-motion recording happens at up to 240fps at 1080p, and there’s a configurable time lapse mode with good settings ranging from 0.06s intervals up to 60s per frame. Xiaomi also offers the option to switch between H264/AVC and H265/HEVC in terms of video recording – notably the HEVC mode, while it does reduce file size by a bit, is seemingly used to actually increase the quality of the video more.
In terms of stabilisation, EIS, which is labelled as the “Stabiliser” function in the camera settings, is only active in 1080p and 720p modes. As is usual, while this mode produces a quite smooth stabilisation, it comes at a cost of reduced field of view as the sensor/ISP is reserving sufficient margins in the frame for the stabilisation window. This is a good quality EIS implementation as I’m having a hard time seeing any pixel scaling issues.
1080p and 4K recording without EIS is also adequate, although the OIS stabilisation isn’t as smooth as on Apple or Samsung devices and you can see the camera lens readjustment steps.
Image quality and exposure is excellent overall – the phone didn’t have any issues in terms of exposure adjustments between panning scenes, and auto-focus accuracy and speed was also virtually a non-issue. The 4K HEVC native capture was of excellent quality as it offered a 38Mbps stream in 5.1 High Profile – 10Mbps more than the Galaxy S9, the high bitrate in HEVC mode also comes at an overall increase quality over the AVC stream which came in at 42Mbps. I was also impressed with the clarity of the audio recorded, a big thumbs up.
One large issue that is notable in these samples is that the phone suffers from bad lens flare when facing the sun. It seems as though Xiaomi doesn’t have a good enough anti-reflective coating on the camera glass to reduce this.
No Video Recording on Zoom Module
I was curious how Xiaomi handled the transition on video recording between the camera modules when zooming. Unfortunately, there isn’t any transition and the telephoto camera is never used during video recording, and any zooming in is simply achieved through digital zoom on the main module.
Speaker Evaluation
Smartphone vendors seem to have put increased focus in trying to improve speaker audio quality in their designs, and this generation in particular we’ve seen some large improvements from Apple, Samsung and even LG put a great deal of focus on the speaker quality of the G7 (Review upcoming in the future).
I’ll be trying to improve our audio quality measurement methodology over the coming months, starting now with basic external speaker evaluations. The measurements are done on a calibrated flat response measurement microphone and I’m using REW as the supporting software.
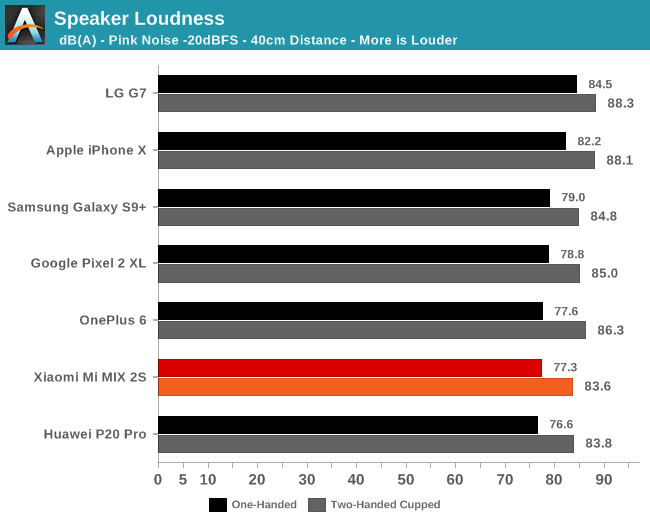
Starting off with maximum speaker loudness measurements, we’re using a pink noise signal as the source. I’m opting to not use any kind of anechoic setup here as I feel that’s not a realistic use-case for smartphones and what we really want to measure is the perceived audio quality – and this can greatly differ on depending how you hold a phone. The scenarios I opted were simply holding the phone one-handed while seated down, with the measurement microphone next to my head, facing the phone at a 40cm distance – hopefully a setup that represents how most people use their phones. Added to that I also hold the phones two-handed and cup my palms, also hopefully a common use-case for people when watching content.
Among current flagships, the Mi MIX 2S at maximum volume doesn’t get as loud as the competition, but it’s not to say it’s a disappointing result. What I found the be the most detrimental to the MIX 2S is that the main speaker is very much downward firing, and this volume difference is very noticeable when compared to the iPhone X or say the S9. Cupping the MIX 2S helps a lot in redirecting the sound from the main speaker. The earpiece also operates in general audio playback, but the volume is pretty whimsical compared to other stereo speaker implementations from all other vendors.
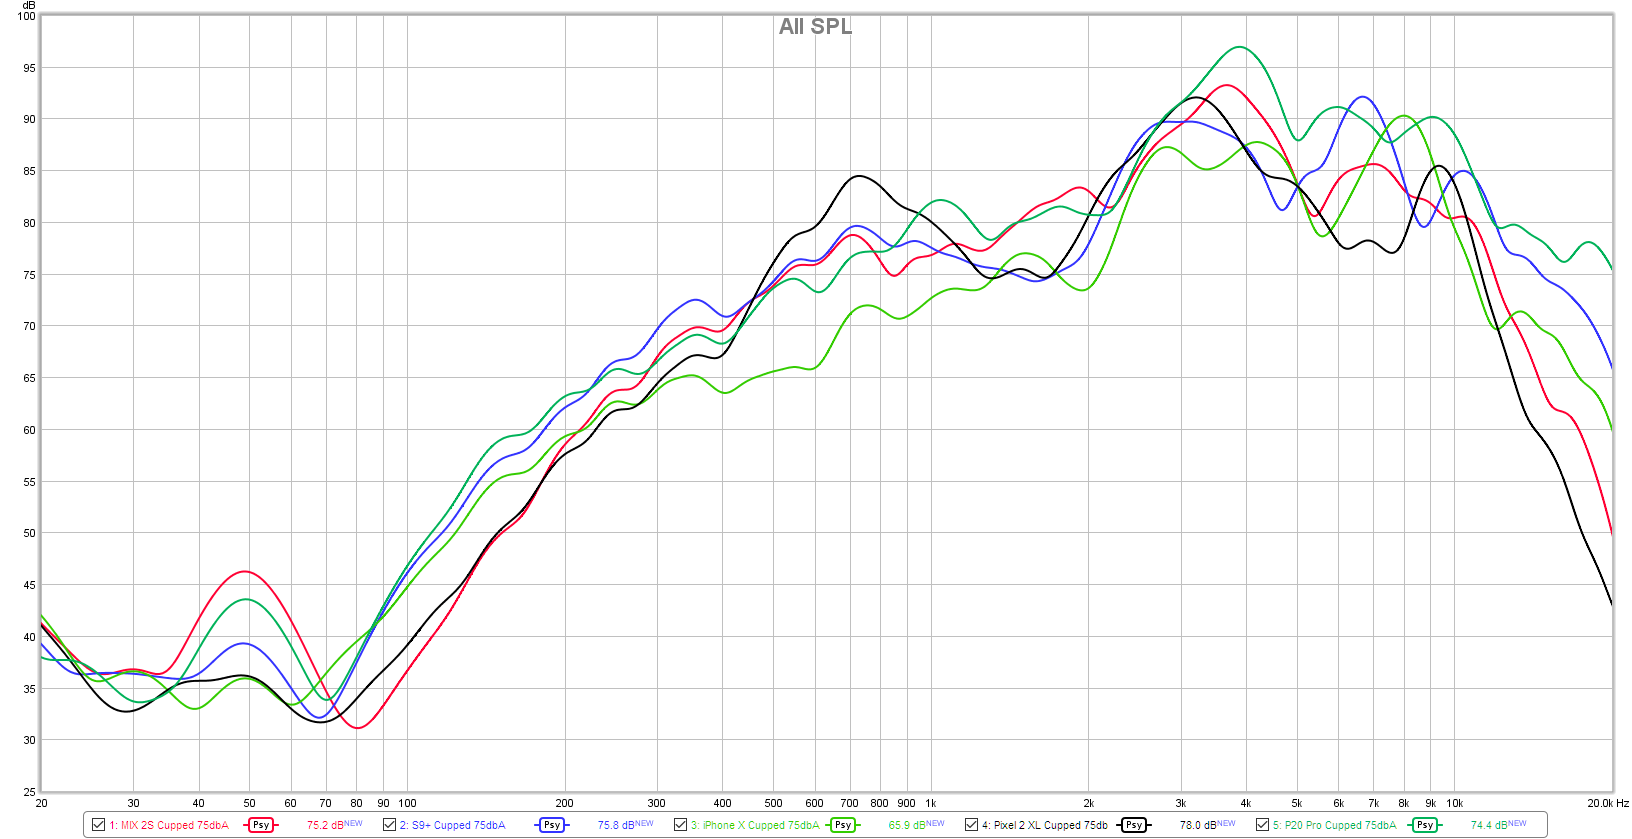
Although volume is one aspect, what really defines perceived audio quality is the frequency response curve. All the phones were calibrated via pink noise to 75dB(A) and then, in cupped hands, I measured a logarithmic measurement sweep with REW. To simplify the graph and to better represent the audible differences between the phones, the curves have a psychoacoustic averaging filter applied to them.
The MIX 2S does not fare very well in the bass range at along with the Pixel 2 XL showcases the worst responses. The phone does well in the sub-bass range and this can be felt in the back of the phone vibrating, however that doesn’t really serve us in terms of audible sound. The Galaxy S9 and P20 Pro do best in the bass.
The MIX 2S recovers in the lower mid-range – and these are the important frequencies which give sound “depth”. Here the 2S catches up, while the iPhone X really suffers. It’s only after 450Hz where the Pixel 2 XL really gains back in volume, but this seems unbalanced compared to the lower frequency response it has.
In the mid-range frequencies all the phones are quite close together, and the MIX 2S actually avoid a dip that we see in other phones, aside from the iPhone X.
Moving into the higher mid-ranges, we see the disadvantages of having to deal with small speakers as here is where most of the volume is coming from. All phones have a peak between 3 and 4KHz, and starting from here till around 6KHz is what gives sound its “presence”.
In the lower high range commonly called treble, we see various peaks cross the phones as that’s what the speakers are most optimised in reproducing – ringtones.
Finally the higher frequencies above 8-10KHz is what gives sound its brilliance. Unfortunately the MIX 2S doesn’t fare well here as volume really drops off.
In general, what makes audio sound good is having the flattest possible response. In this case the MIX 2S has a good response between 500 and 10KHz, but suffers badly below and above that, giving the impression that it’s lacking depth as well as brilliance. Among all the phones, the Galaxy S9 produces the best overall audio because it manages to produce a lot more bass and low-mids, and equally really tries to maintain more of the high-treble. The Huawei P20 Pro would have been an outstanding competitor here, however the very large peaks in the presence range / high mids to low highs from 3-6KHz makes the sound a lot harsher than the S9.
I’m still experimenting with audio measurements, so I appreciate any feedback or suggestions and the methodology is certainly going to evolve more in the future. In particular I’m curious to see comments about reported volumes in dB(A) and db(C) and what one feels is more important.
Conclusion & End Remarks
The Xiaomi MI MIX 2S overall seems to be a very well rounded phone. Before we’re going to compare it against other devices, we have to keep in mind one thing: pricing. Xiaomi’s main advantage over the years has always been its ability to undercut the competition while still providing cutting edge hardware. This is more important than ever as the company is expanding its presence in the big European markets. Currently, the MIX 2S can be found for 525€ for 64GB and 576€ for 128GB variants on German Amazon, with Prime delivery.
It’s clear that the nearest competitor to the MIX 2S is the Galaxy S9+ - and in this review I’ve mostly compared it against the Snapdragon variant of the S9+ which isn’t available in Europe, and one has to keep in mind the Exynos version performs worse and has worse battery life.
Keeping that in mind, we can contextualize the MIX 2S’s performances better.
In terms of overall device performance, I think I was very clear – as there’s no competition. This is currently the fastest smartphone available, at least certainly among Android devices. Xiaomi integrated the Snapdragon 845 without a hitch, and silicon and software both work tremendously well together. This is an important consideration, especially in the European market as I still don’t see the Exynos S9’s as viable purchases at the current full price of 677€.
Battery life is very good – the toughest competition here is from Huawei as its newest phones present a significant advantage over the competition.
What is probably the Mi MIX 2S’s biggest weak point is the screen. I was subjectively quite annoyed with the pixel response time as it very much results in visible ghosting and smearing, especially in scrolling text. While display accuracy was good and the MIX 2S offers a very accurate sRGB mode, the off-axis viewing angles of the screen aren’t top-notch. This is one of the aspects where paying a premium will actually give you a better product.
Camera wise the MIX 2S was extremely competitive, and actually I was unusually happy with the capture experience as it’s one of the most consistent shooters I’ve tested. While picture quality in every scenario might not be the best, being edged out by the S9 in daylight details and the P20 Pro in low-light scenarios, in terms of overall rounded experience and quality, the MIX 2S is of outstanding value in the camera department.
Overall Xiaomi offers a great product, while not perfect in every aspect, it also doesn’t have any immediate deal breakers that I would say would put it out of consideration for buyers. The screen is one thing that’s subjective and if you have the chance, it’s best to be experienced and evaluated it in person. Oh, and it doesn’t have a headphone jack, so that’s also a thing. All in all, it’s definitely priced where it should be.
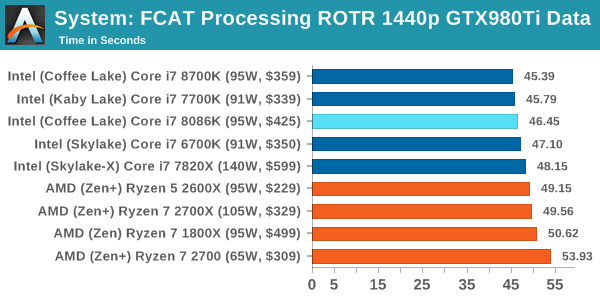
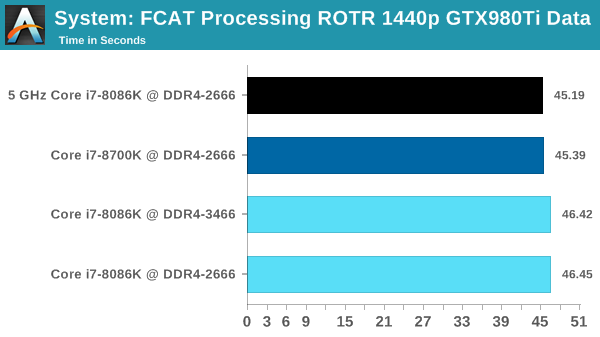
One of the more interesting workloads that has crossed our desks in recent quarters is FCAT - the tool we use to measure stuttering in gaming due to dropped or runt frames. The FCAT process requires enabling a color-based overlay onto a game, recording the gameplay, and then parsing the video file through the analysis software. The software is mostly single-threaded, however because the video is basically in a raw format, the file size is large and requires moving a lot of data around. For our test, we take a 90-second clip of the Rise of the Tomb Raider benchmark running on a GTX 980 Ti at 1440p, which comes in around 21 GB, and measure the time it takes to process through the visual analysis tool.
FCAT is single threaded, however in this test the full 5.0 GHz did not kick in.
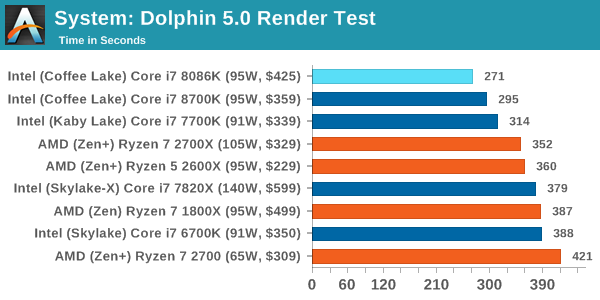
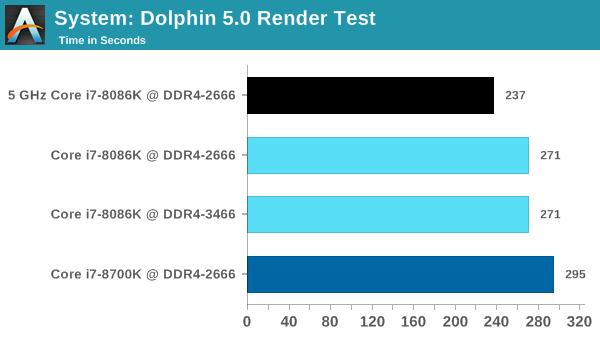
Many emulators are often bound by single thread CPU performance, and general reports tended to suggest that Haswell provided a significant boost to emulator performance. This benchmark runs a Wii program that ray traces a complex 3D scene inside the Dolphin Wii emulator. Performance on this benchmark is a good proxy of the speed of Dolphin CPU emulation, which is an intensive single core task using most aspects of a CPU. Results are given in minutes, where the Wii itself scores 17.53 minutes.
For a test that did have 5.0 GHz kick in, the 8086K takes the record in our Dolphin test.
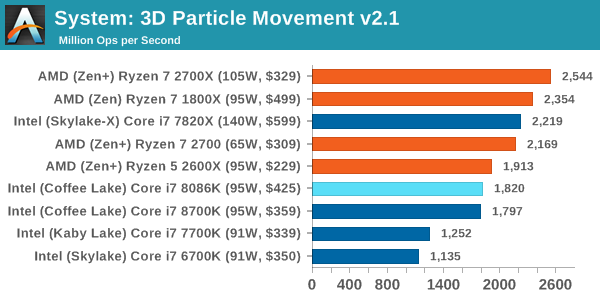
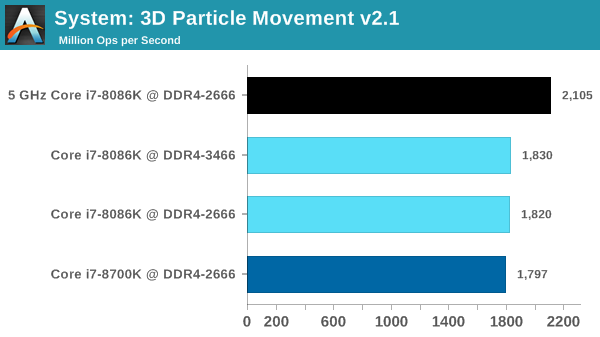
This is the latest version of the self-penned 3DPM benchmark. The goal of 3DPM is to simulate semi-optimized scientific algorithms taken directly from my doctorate thesis. Version 2.1 improves over 2.0 by passing the main particle structs by reference rather than by value, and decreasing the amount of double->float->double recasts the compiler was adding in. It affords a ~25% speed-up over v2.0, which means new data.
On 3DPM, the 8086K shows that the 4.3 GHz all-core is on par with the 8700K.
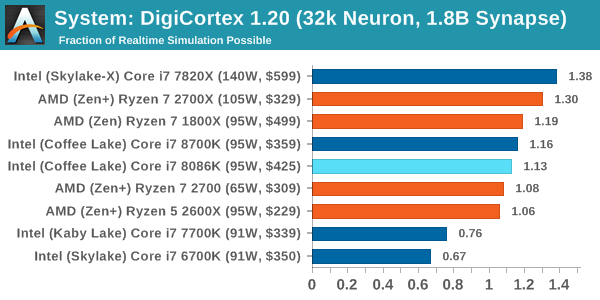
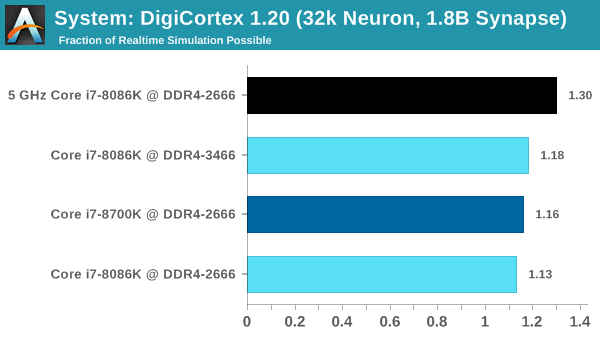
Despite being a couple of years old, the DigiCortex software is a pet project for the visualization of neuron and synapse activity in the brain. The software comes with a variety of benchmark modes, and we take the small benchmark which runs a 32k neuron/1.8B synapse simulation. The results on the output are given as a fraction of whether the system can simulate in real-time, so anything above a value of one is suitable for real-time work. The benchmark offers a 'no firing synapse' mode, which in essence detects DRAM and bus speed, however we take the firing mode which adds CPU work with every firing.
Despite the faster single core frequency, this DRAM-limited test seems to load up another core and stops the 8086K from reaching 5.0 GHz.
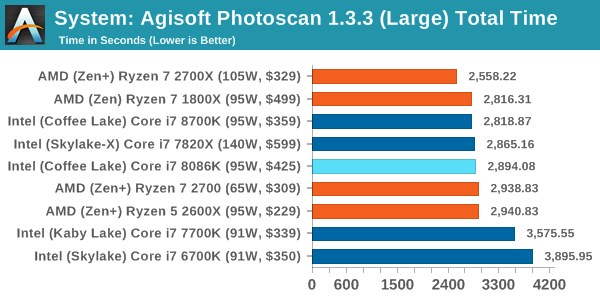
Photoscan stays in our benchmark suite from the previous version, however now we are running on Windows 10 so features such as Speed Shift on the latest processors come into play. The concept of Photoscan is translating many 2D images into a 3D model - so the more detailed the images, and the more you have, the better the model. The algorithm has four stages, some single threaded and some multi-threaded, along with some cache/memory dependency in there as well. For some of the more variable threaded workload, features such as Speed Shift and XFR will be able to take advantage of CPU stalls or downtime, giving sizeable speedups on newer microarchitectures.
Agisoft is variable threaded, but the 8086K is still a small stones throw from the 8700K.
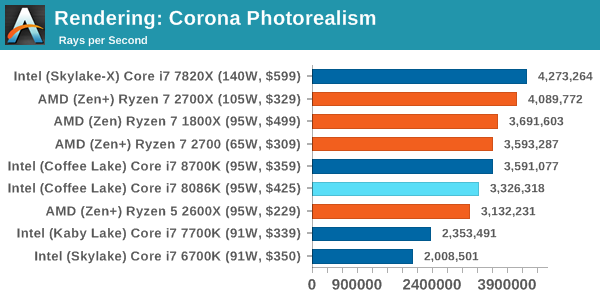
Corona is a standalone package designed to assist software like 3ds Max and Maya with photorealism via ray tracing. It's simple - shoot rays, get pixels. OK, it's more complicated than that, but the benchmark renders a fixed scene six times and offers results in terms of time and rays per second. The official benchmark tables list user submitted results in terms of time, however I feel rays per second is a better metric (in general, scores where higher is better seem to be easier to explain anyway). Corona likes to pile on the threads, so the results end up being very staggered based on thread count.
Corona is a fully multi-threaded test, so it is surprising to see the 8086K lag behind the 8700K here. This is likely a scenario where the fact that our borrowed testbed setup doesn't perfectly match our standard testbed is playing a factor.
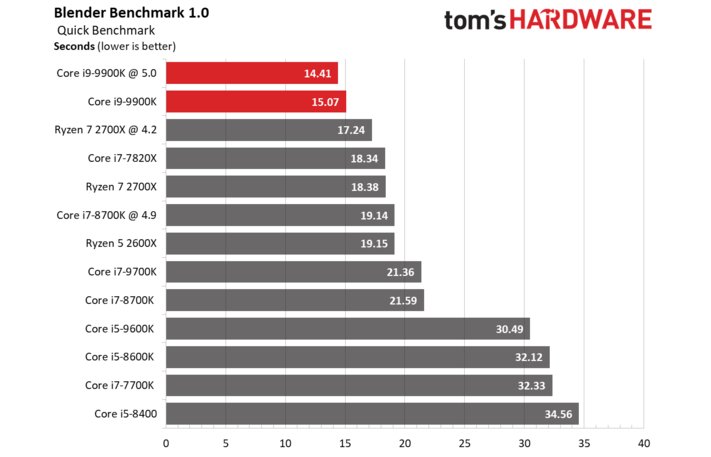
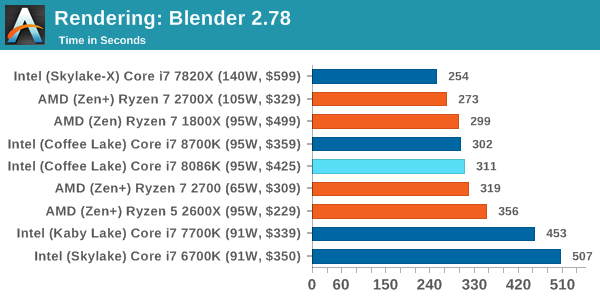
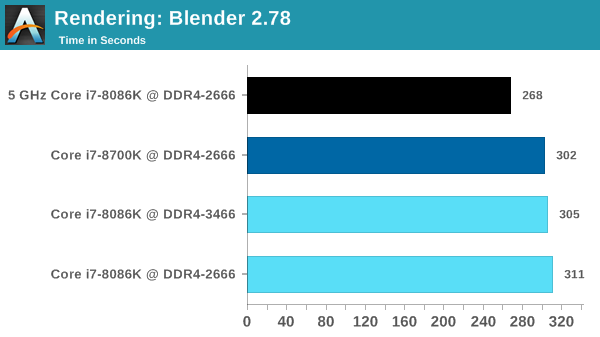
For a render that has been around for what seems like ages, Blender is still a highly popular tool. We managed to wrap up a standard workload into the February 5 nightly build of Blender and measure the time it takes to render the first frame of the scene. Being one of the bigger open source tools out there, it means both AMD and Intel work actively to help improve the codebase, for better or for worse on their own/each other's microarchitecture.
Blender also likes to load up the threads, and the 8086K is behind again.
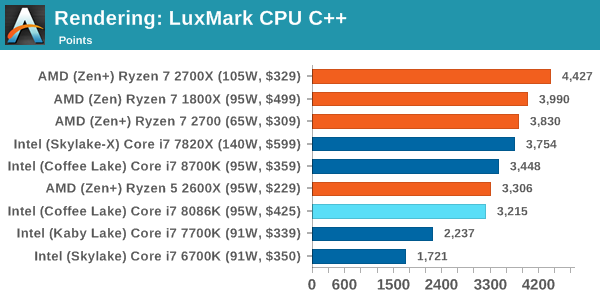
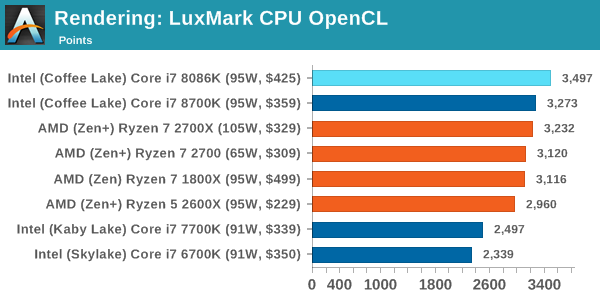
As a synthetic, LuxMark might come across as somewhat arbitrary as a renderer, given that it's mainly used to test GPUs, but it does offer both an OpenCL and a standard C++ mode. In this instance, aside from seeing the comparison in each coding mode for cores and IPC, we also get to see the difference in performance moving from a C++ based code-stack to an OpenCL one with a CPU as the main host.
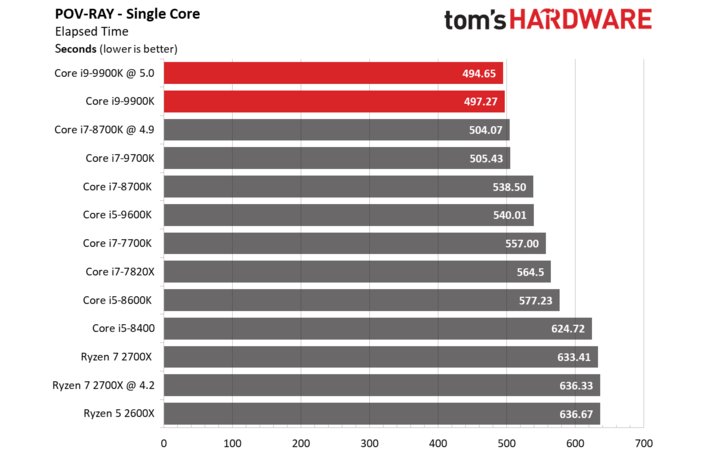
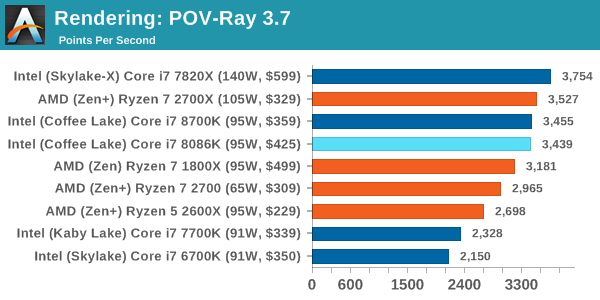
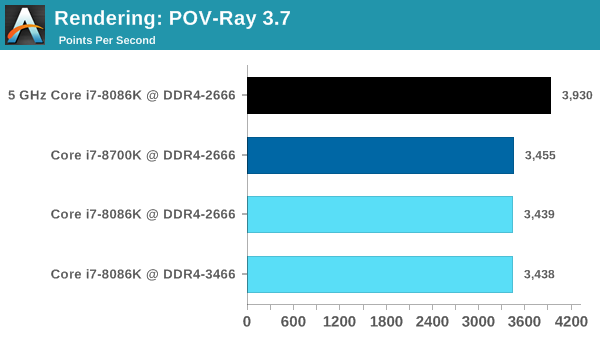
POV-Ray 3.7.1b4
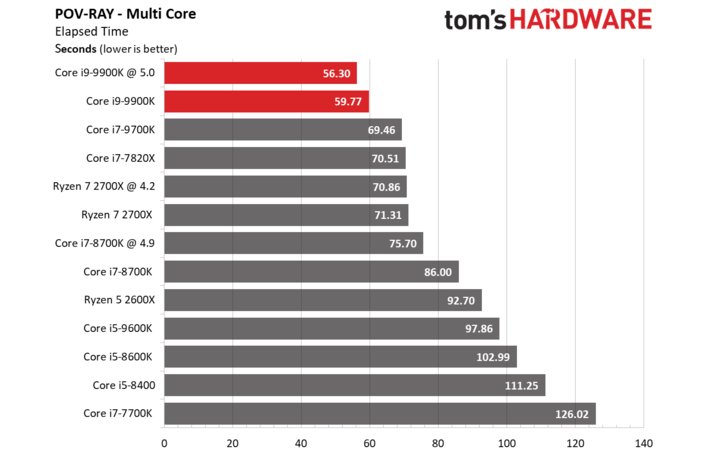
Another regular benchmark in most suites, POV-Ray is another ray-tracer but has been around for many years. It just so happens that during the run up to AMD's Ryzen launch, the code base started to get active again with developers making changes to the code and pushing out updates. Our version and benchmarking started just before that was happening, but given time we will see where the POV-Ray code ends up and adjust in due course.
Virtually identical scores between the 8086K and 8700K in POV-Ray.
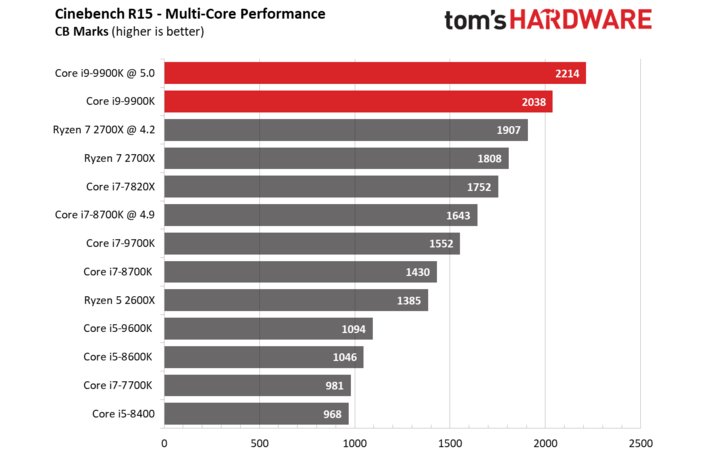
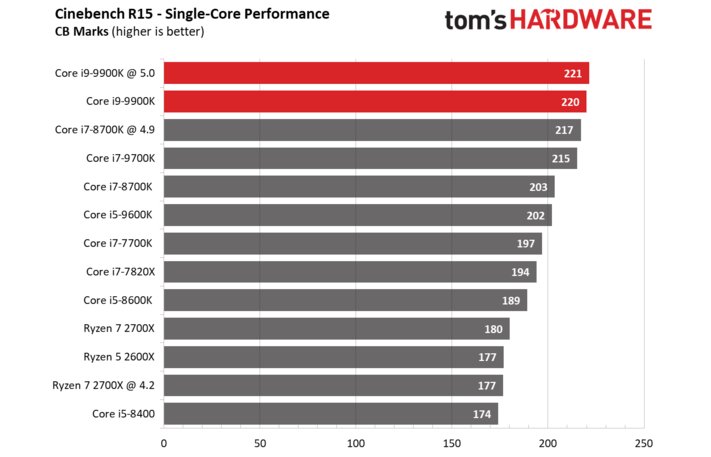
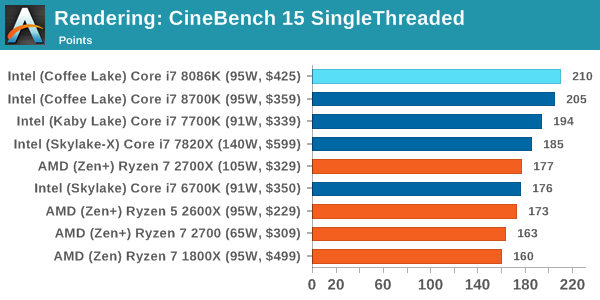
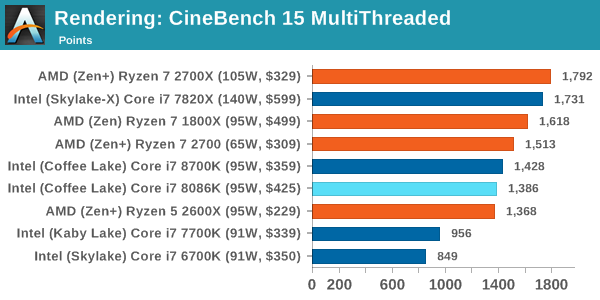
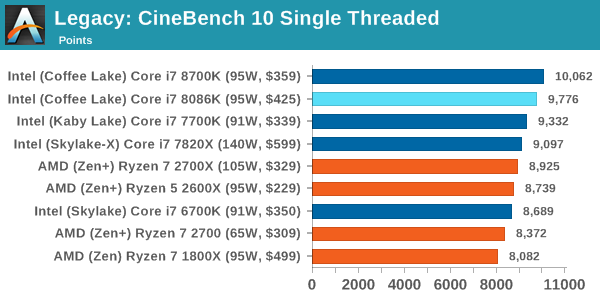
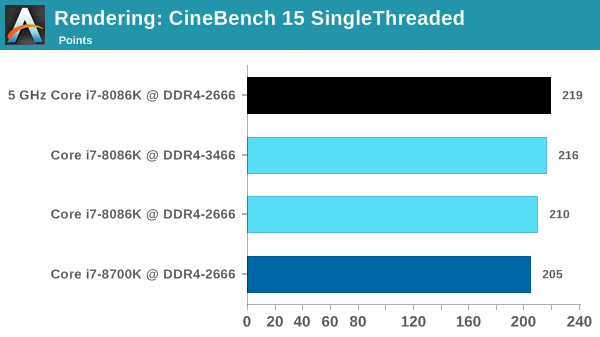
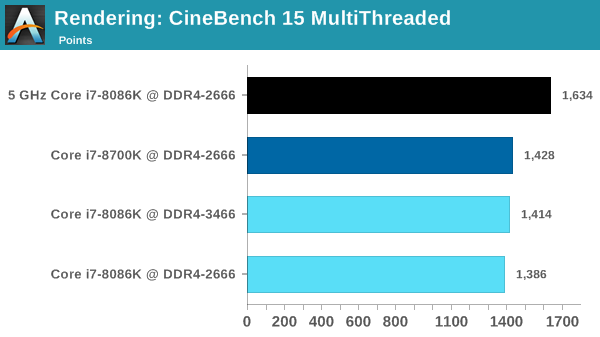
The latest version of CineBench has also become one of those 'used everywhere' benchmarks, particularly as an indicator of single thread performance. High IPC and high frequency gives performance in ST, whereas having good scaling and many cores is where the MT test wins out.
The 8086K gets a new fastest single core score in CineBench R15 ST, but falls slightly behind the 8700K in MT.
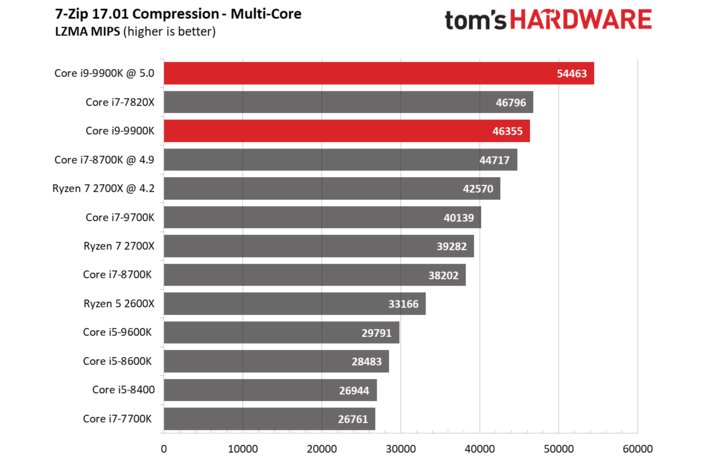
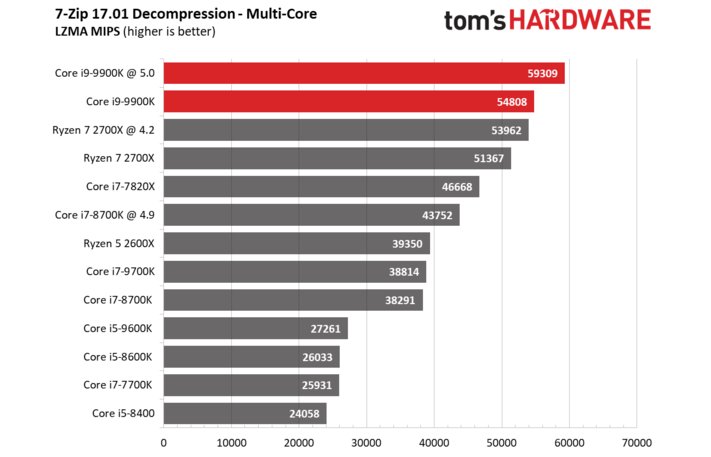
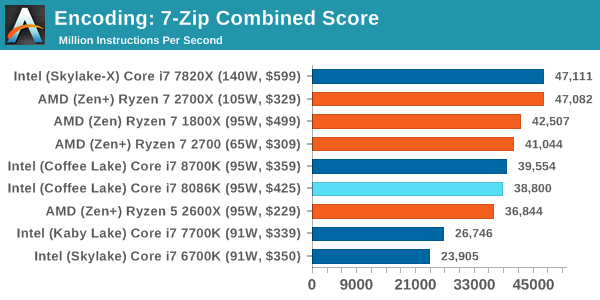
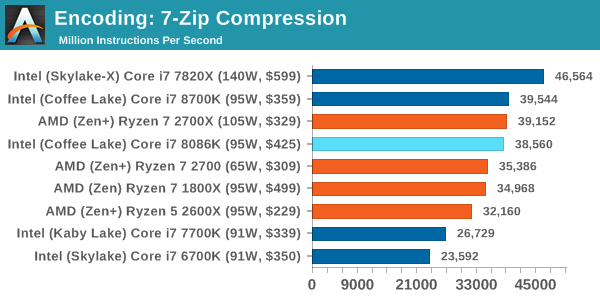
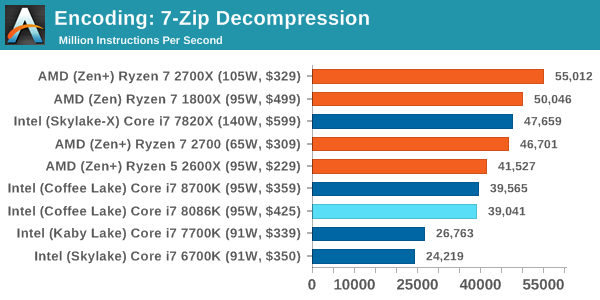
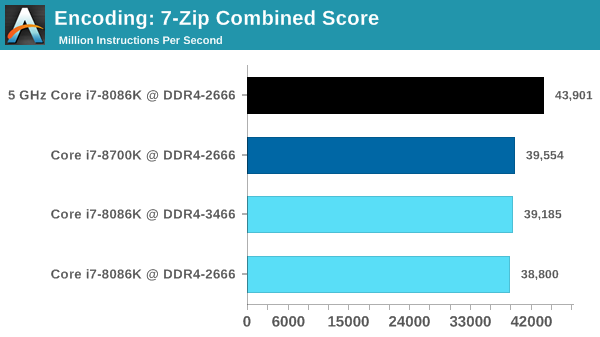
7-Zip 9.2
One of the freeware compression tools that offers good scaling performance between processors is 7-Zip. It runs under an open-source licence, is fast, and easy to use tool for power users. We run the benchmark mode via the command line for four loops and take the output score.
Again, trading blows with the 8700K, but falling behind a little bit.
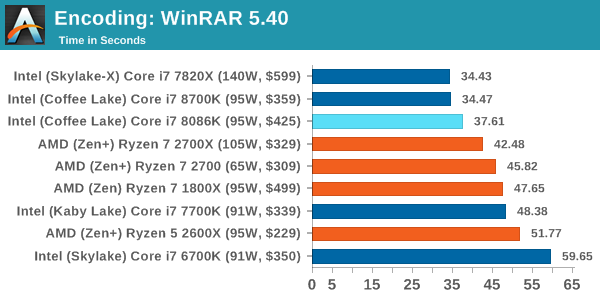
WinRAR 5.40
For the 2017 test suite, we move to the latest version of WinRAR in our compression test. WinRAR in some quarters is more user friendly that 7-Zip, hence its inclusion. Rather than use a benchmark mode as we did with 7-Zip, here we take a set of files representative of a generic stack (33 video files in 1.37 GB, 2834 smaller website files in 370 folders in 150 MB) of compressible and incompressible formats. The results shown are the time taken to encode the file. Due to DRAM caching, we run the test 10 times and take the average of the last five runs when the benchmark is in a steady state.
The 8086K takes another benchmark sitting behind the 8700K.
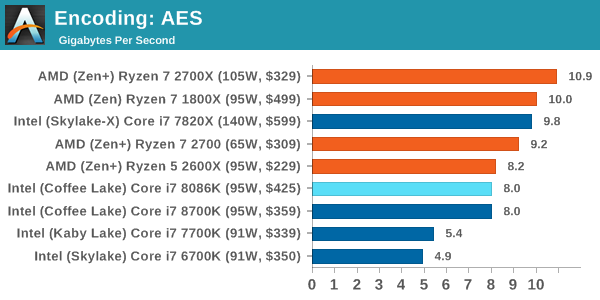
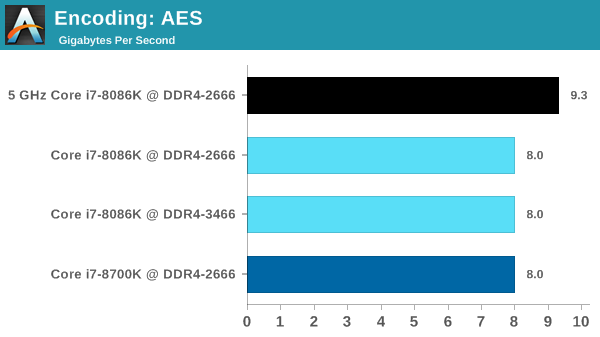
AES Encoding
Algorithms using AES coding have spread far and wide as a ubiquitous tool for encryption. Again, this is another CPU limited test, and modern CPUs have special AES pathways to accelerate their performance. We often see scaling in both frequency and cores with this benchmark. We use the latest version of TrueCrypt and run its benchmark mode over 1GB of in-DRAM data. Results shown are the GB/s average of encryption and decryption.
Under AES encoding we get literally identical results.
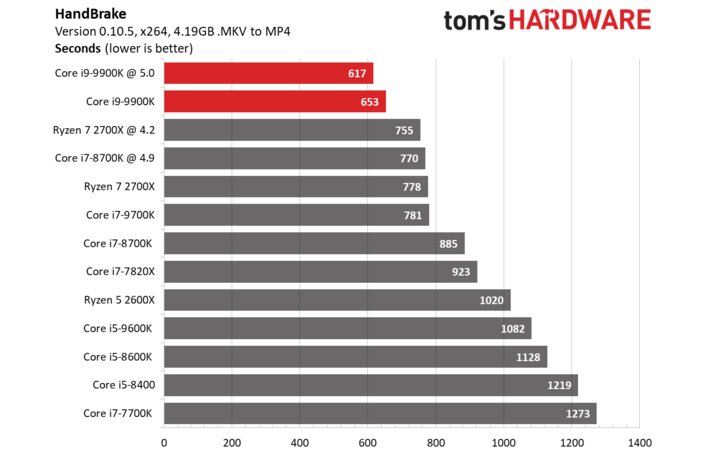
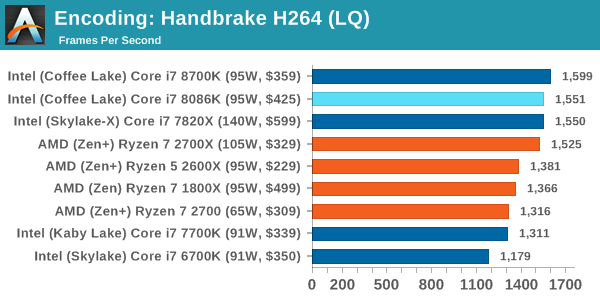
As mentioned above, video transcoding (both encode and decode) is a hot topic in performance metrics as more and more content is being created. First consideration is the standard in which the video is encoded, which can be lossless or lossy, trade performance for file-size, trade quality for file-size, or all of the above can increase encoding rates to help accelerate decoding rates. Alongside Google's favorite codec, VP9, there are two others that are taking hold: H264, the older codec, is practically everywhere and is designed to be optimized for 1080p video, and HEVC (or H265) that is aimed to provide the same quality as H264 but at a lower file-size (or better quality for the same size). HEVC is important as 4K is streamed over the air, meaning less bits need to be transferred for the same quality content.
Handbrake is a favored tool for transcoding, and so our test regime takes care of three areas.
Low Quality/Resolution H264: Here we transcode a 640x266 H264 rip of a 2 hour film, and change the encoding from Main profile to High profile, using the very-fast preset.
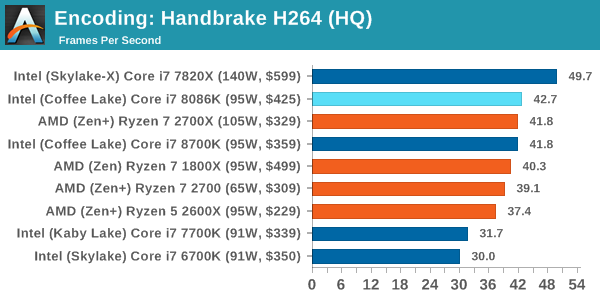
High Quality/Resolution H264: A similar test, but this time we take a ten-minute double 4K (3840x4320) file running at 60 Hz and transcode from Main to High, using the very-fast preset.
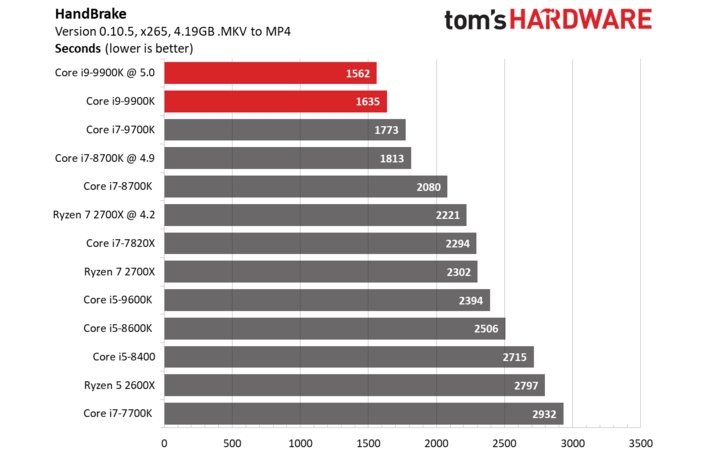
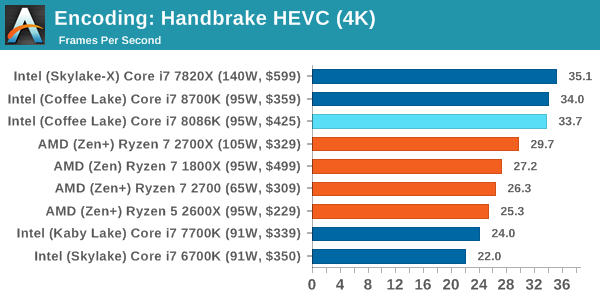
HEVC Test: Using the same video in HQ, we change the resolution and codec of the original video from 4K60 in H264 into 4K60 HEVC.
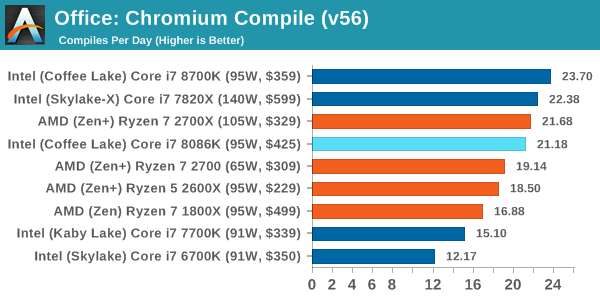
Chromium Compile (v56)
Our new compilation test uses Windows 10 Pro, VS Community 2015.3 with the Win10 SDK to combile a nightly build of Chromium. We've fixed the test for a build in late March 2017, and we run a fresh full compile in our test. Compilation is the typical example given of a variable threaded workload - some of the compile and linking is linear, whereas other parts are multithreaded.
This is another case where I think our improvised testbed is playing a bigger part, and I'd like to eventually re-run this on my standard testbed. Especially as compiling heavily hits more than just the CPU.
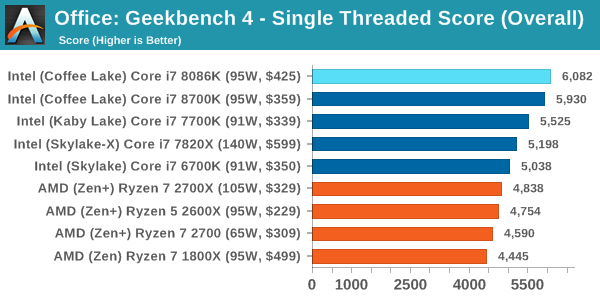
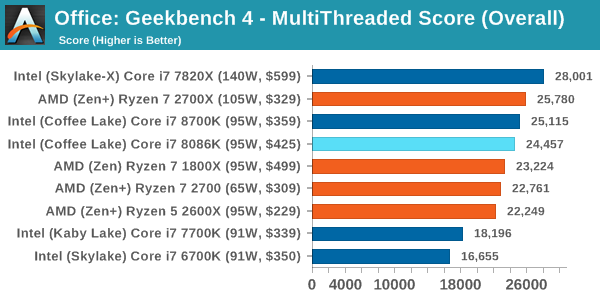
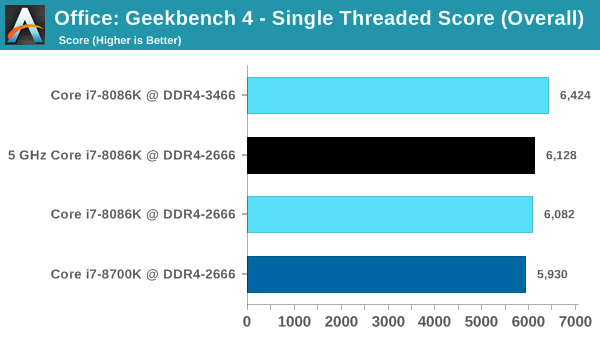
Due to numerous requests, GeekBench 4 is now part of our suite. GB4 is a synthetic test using algorithms often seen in high-performance workloads along with a series of memory focused tests. GB4’s biggest asset is a single-number output which its users seem to love, although it is not always easy to translate that number into real-world performance comparisons.
Like CineBench, the Core i7-8086K does will on the synthetic single threaded test.
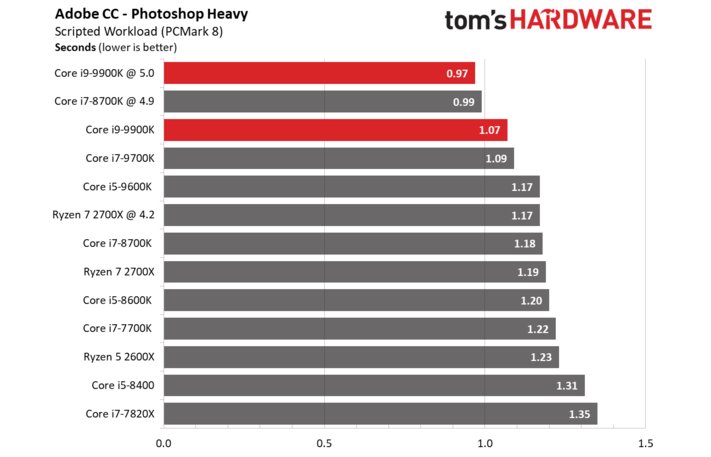
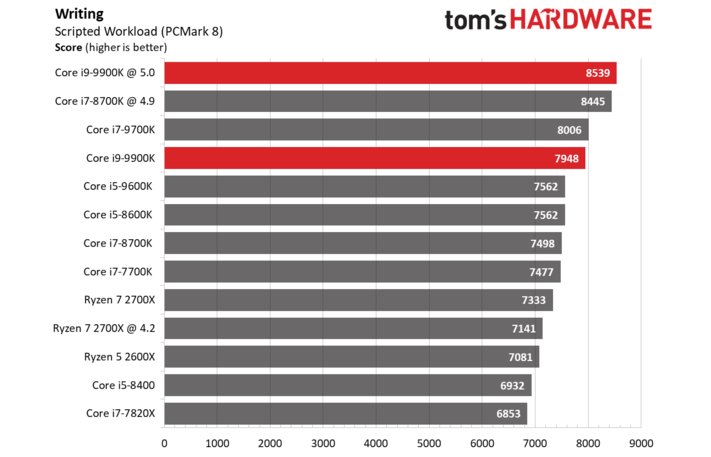
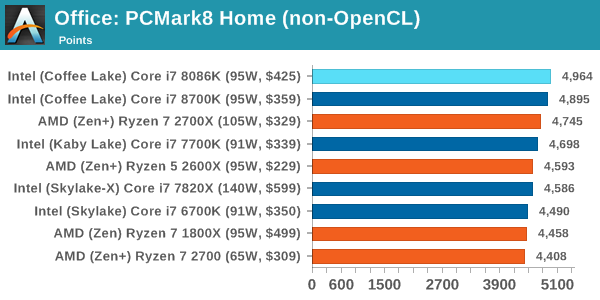
Despite originally coming out in 2008/2009, Futuremark has maintained PCMark8 to remain relevant in 2017. On the scale of complicated tasks, PCMark focuses more on the low-to-mid range of professional workloads, making it a good indicator for what people consider 'office' work. We run the benchmark from the commandline in 'conventional' mode, meaning C++ over OpenCL, to remove the graphics card from the equation and focus purely on the CPU. PCMark8 offers Home, Work and Creative workloads, with some software tests shared and others unique to each benchmark set.
Here the 8086K does eek out a win over the 8700K, although just barely.
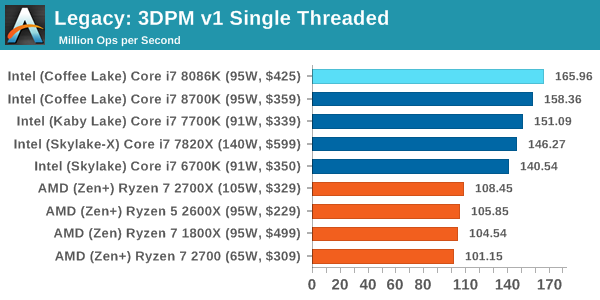
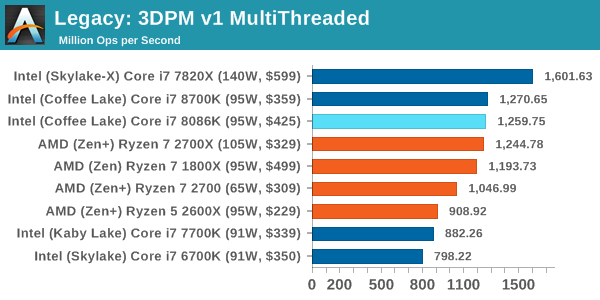
3D Particle Movement v1
3DPM is a self-penned benchmark, taking basic 3D movement algorithms used in Brownian Motion simulations and testing them for speed. High floating point performance, MHz and IPC wins in the single thread version, whereas the multithread version has to handle the threads and loves more cores. This is the original version, written in the style of a typical non-computer science student coding up an algorithm for their theoretical problem, and comes without any non-obvious optimizations not already performed by the compiler, such as false sharing.
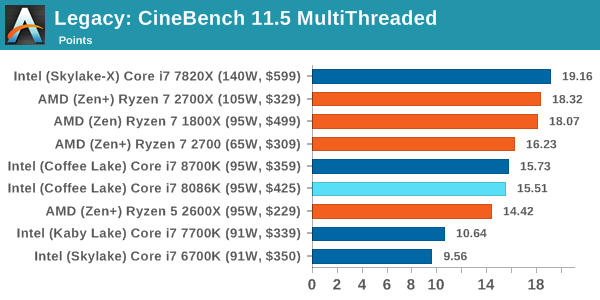
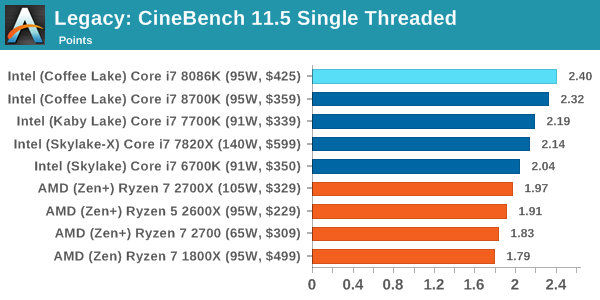
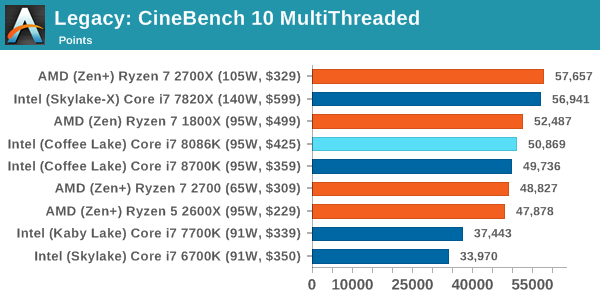
CineBench 11.5 and 10
Cinebench is a widely known benchmarking tool for measuring performance relative to MAXON's animation software Cinema 4D. Cinebench has been optimized over a decade and focuses on purely CPU horsepower, meaning if there is a discrepancy in pure throughput characteristics, Cinebench is likely to show that discrepancy. Arguably other software doesn't make use of all the tools available, so the real world relevance might purely be academic, but given our large database of data for Cinebench it seems difficult to ignore a small five minute test. We run the modern version 15 in this test, as well as the older 11.5 and 10 due to our back data.
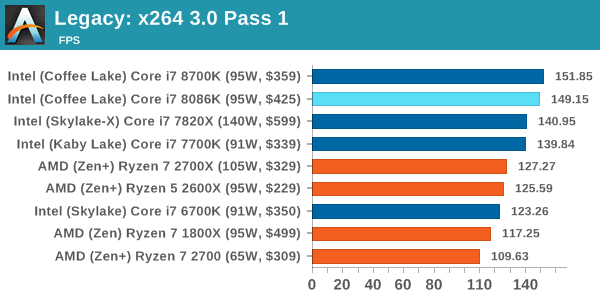
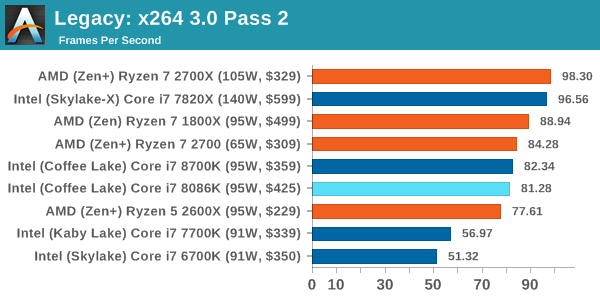
x264 HD 3.0
Similarly, the x264 HD 3.0 package we use here is also kept for historic regressional data. The latest version is 5.0.1, and encodes a 1080p video clip into a high quality x264 file. Version 3.0 only performs the same test on a 720p file, and in most circumstances the software performance hits its limit on high end processors, but still works well for mainstream and low-end. Also, this version only takes a few minutes, whereas the latest can take over 90 minutes to run.
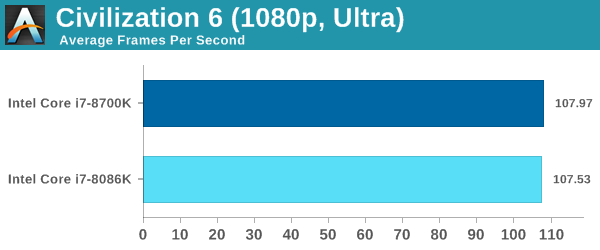
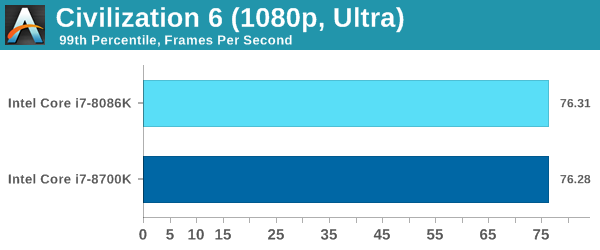
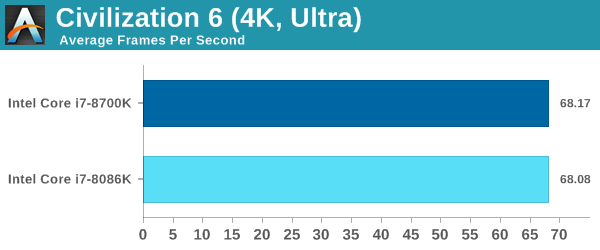
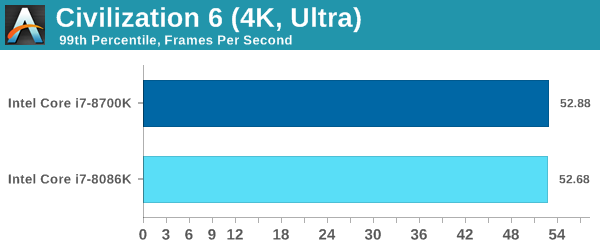
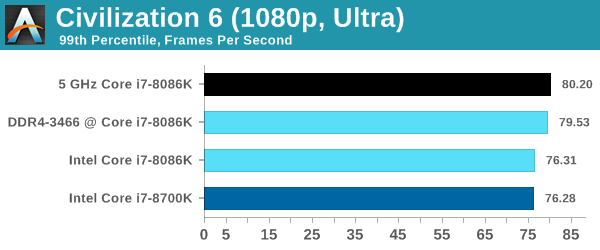
ASRock RX 580 Performance
Almost zero difference for Civilization between the two. The 8086K is never in a situation to fire up to 5.0 GHz.
ASRock RX 580 Performance
ASRock RX 580 Performance
ASRock RX 580 Performance
ASRock RX 580 Performance
Overclocking Performance: CPU Tests
In the third page of the review we showed our overclocking results, with our CPU managing to hit 5.1 GHz stable with a sizeable increase in voltage. Running at 5.1 GHz incurred rather high temperatures however, so for our benchmark suite we dialed back to 5.0 GHz and run a number of our tests again at this fast speed. We also ran some benchmarks at stock frequency but with increased DRAM frequencies. We ran the DRAM in our ASRock provided system at DDR4-3466, slightly overclocked beyond its DDR4-3200 sticker value.
For this page (and the next), we’ll show the overclocked results of the Core i7-8086K using the fast memory kits as well as the 5.0 GHz overclocked setting (at base memory). The Core i7-8700K numbers are also included for reference.
FCAT Processing
3DPM v2.1
Dolphin v5
DigiCortex v1.20
Blender
POV-Ray
Cinebench R15 ST
Cinebench R15 MT
7-zip
TrueCrypt
GeekBench 4 ST
GeekBench 4 MT
For everything except the most lightly threaded workloads, overclocking the 8086K to a flat-out 5GHz shows some reasonable gains. These results aren't you couldn't already extrapolate based on the clockspeeds, but it's nice to put theory to practice. It also highlights the unfortunate shortcoming of the CPU: being able to turbo one thread to 5GHz just isn't that useful, since you'll very rarely have a complete system workload that allows it, even if the heaviest workload is single-threaded. The 8086K simply begs to be run at a flat-out 5GHz to get the most out of its capabilities.
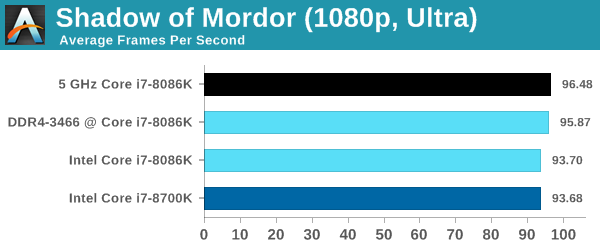
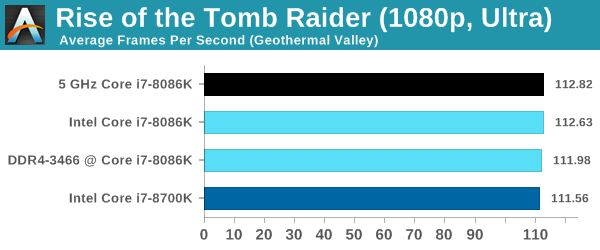
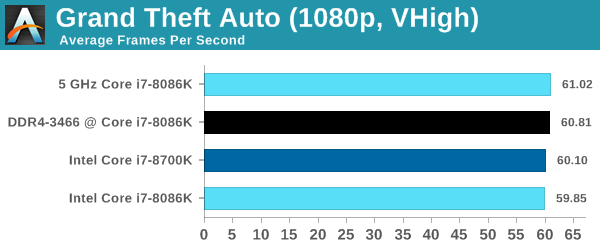
Overclocking Performance: GPU Tests
In the third page of the review we showed our overclocking results, with our CPU managing to hit 5.1 GHz stable with a sizeable increase in voltage. 5.1 GHz was also high in temperatures, so for our benchmark suite, we dialed back to 5.0 GHz and run a number of our tests again at this fast speed. We also ran some benchmarks at stock frequency but with increased DRAM frequencies. We initially ran the DRAM in our ASRock provided system at DDR4-3466, slightly overclocked beyond its DDR4-3200 sticker value.
For this page (and the next), we’ll show the overclocked results of the Core i7-8086K using the fast memory kits as well as the 5.0 GHz overclocked setting (at base memory). The Core i7-8700K numbers are also included for reference.
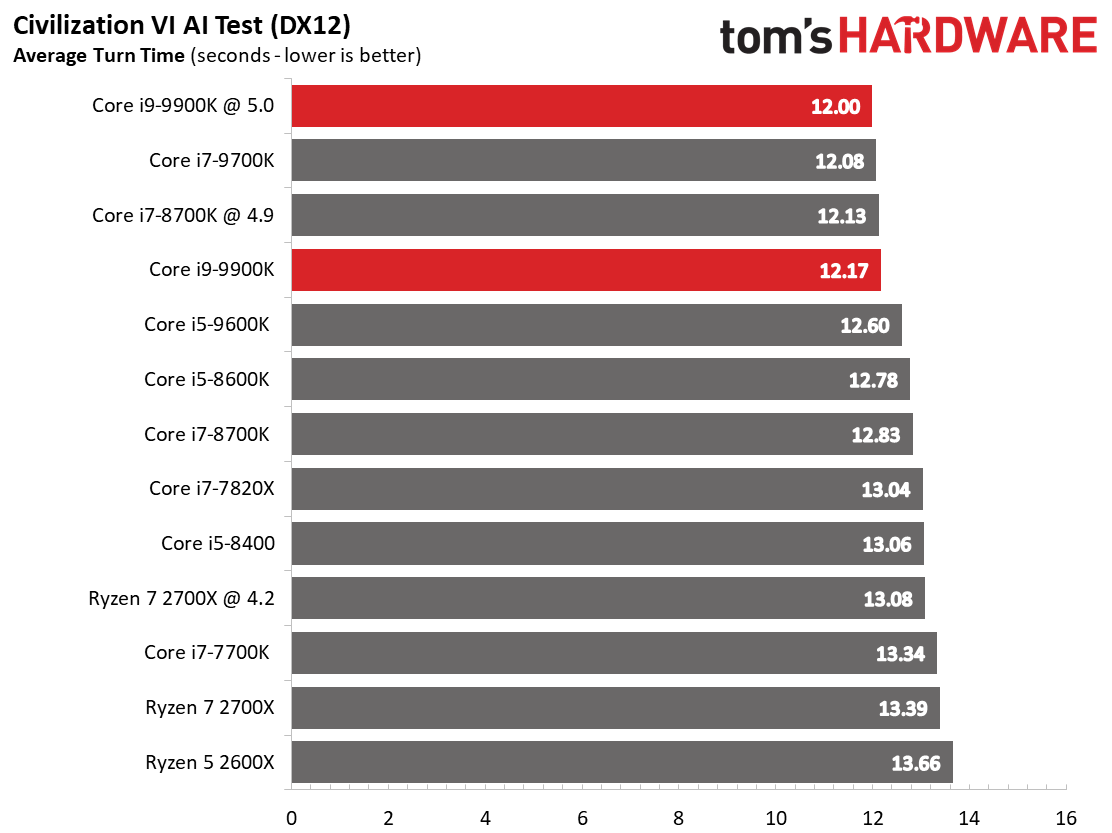
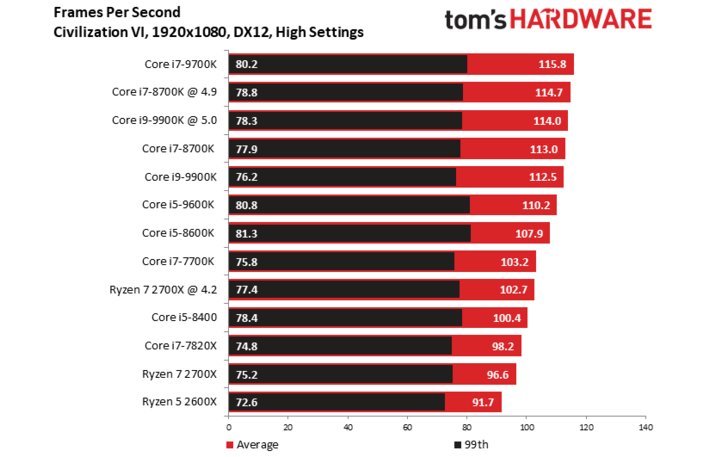
Civilization 6
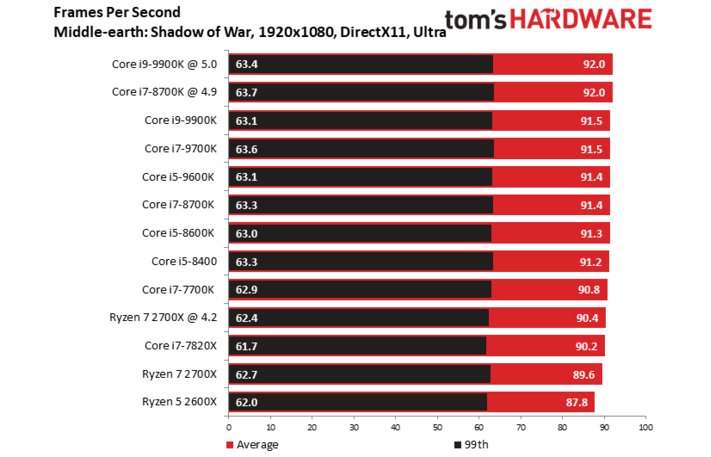
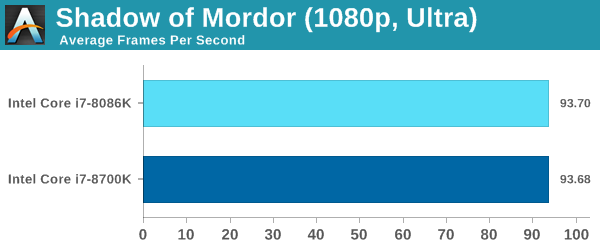
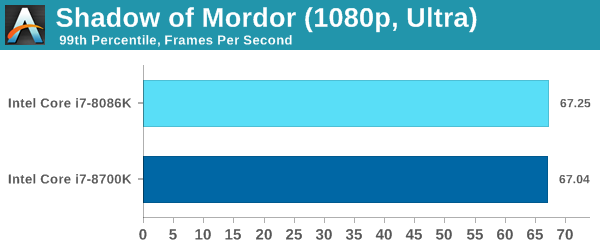
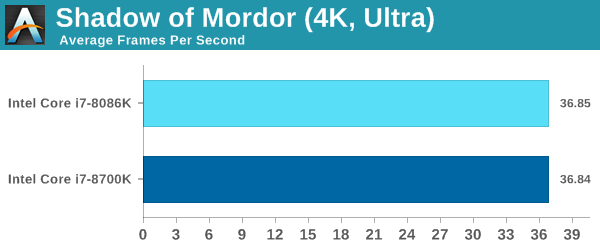
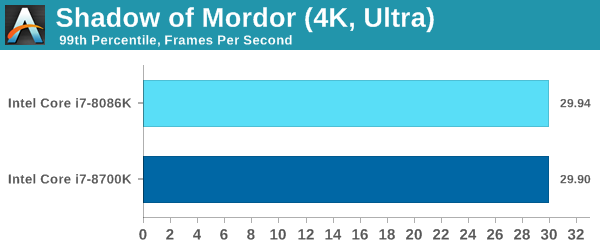
Shadow of Mordor
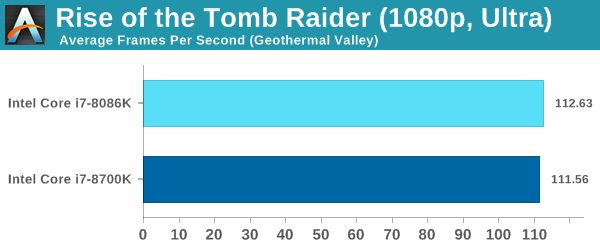
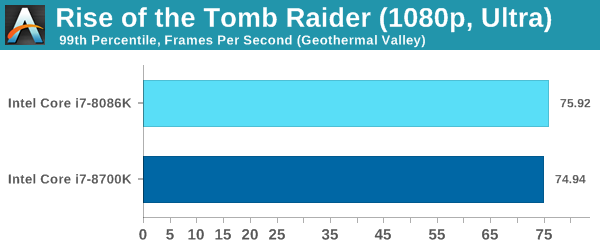
Rise of the Tomb Raider
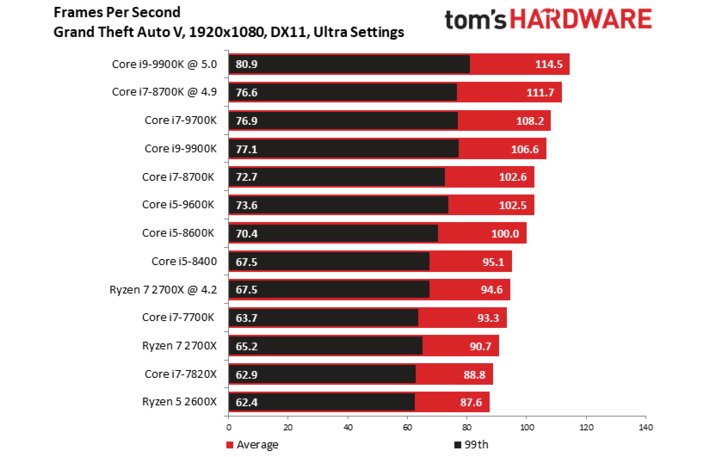
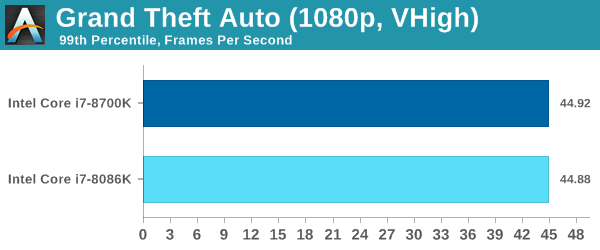
Grand Theft Auto V
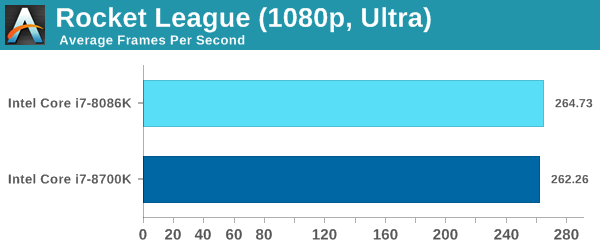
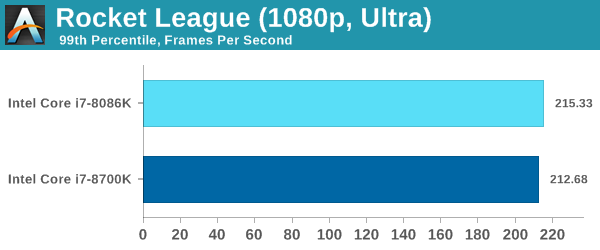
There's not much to say with our GPU testing since we ended up being GPU-bound most of the time against the Radeon RX 580. In a more CPU-limited scenario overclocking should help, but these aren't it. Though at some point I'd like to dig into Civilization 6 turn times with the 8086K, as that stands to prove more impactful.
All Systems GeForce GTX 1080 Founders Edition (Gaming) Nvidia Quadro P6000 (Workstation)
1x 1TB Toshiba OCZ RD400 (M.2, System) 2x 960GB Toshiba OCZ TR150 (Storage, Images) be quiet! Dark Power Pro 11, 850W Power Supply Windows 10 Pro (Creators Update)
Lian Li PC-T70 with Extension Kit and Mods Configurations: Open Benchtable, Closed Case
Power Consumption Measurement
Contact-free DC Measurement at PCIe Slot (Using a Riser Card) Contact-free DC Measurement at External Auxiliary Power Supply Cable Direct Voltage Measurement at Power Supply 2x Rohde & Schwarz HMO 3054, 500 MHz Digital Multi-Channel Oscilloscope with Storage Function 4x Rohde & Schwarz HZO50 Current Probe (1mA - 30A, 100 kHz, DC) 4x Rohde & Schwarz HZ355 (10:1 Probes, 500 MHz) 1x Rohde & Schwarz HMC 8012 Digital Multimeter with Storage Function
Thermal Measurement
1x Optris PI640 80 Hz Infrared Camera + PI Connect Real-Time Infrared Monitoring and Recording
Acoustic Measurement
NTI Audio M2211 (with Calibration File, Low Cut at 50Hz) Steinberg UR12 (with Phantom Power for Microphones) Creative X7, Smaart v.7 Custom-Made Proprietary Measurement Chamber, 3.5 x 1.8 x 2.2m (L x D x H) Perpendicular to Center of Noise Source(s), Measurement Distance of 50cm Noise Level in dB(A) (Slow), Real-time Frequency Analyzer (RTA) Graphical Frequency Spectrum of Noise
전력 소모
가격대비 게이밍 효율
AMD's Ryzen 7 2700X is another big step forward for AMD. The improved boost algorithms add to Ryzen's performance advantage in heavily-threaded applications, while the increased frequency and reduced memory latency provide a boost to a wide range of workloads. AMD delivered on the pricing front, too, and the bundled LED cooler and storage tiering software adds to the value.
AMD의 Ryzen 7 2700X는 AMD의 또 하나의 큰 진보입니다. 향상 된 부스트 알고리즘은 높은 빈도의 스레드 응용 프로그램에서 Ryzen의 성능 이점을 추가하고, 주파수 증가 및 메모리 대기 시간 감소는 광 범위한 작업 로드를 향상시킵니다. AMD는 가격 책정에서도 앞장서 왔으며 번들로 제공되는 LED 쿨러 및 스토리지 계층화 소프트웨어가 그 가치를 더욱 높여줍니다.


%20Founders%20Edition%20-%20The%20NVIDIA%20GeForce%20RTX%202060%206GB%20Founders%20Edition%20Review%3A%20Not%20Quite%20Mainstream&txt=%3Cimg%20alt%3D%22%22%20src%3D%22https%3A%2F%2Fimages.anandtech.com%2Fdoci%2F13762%2FGeForce_RTX_2060_3QTR_Front_Right_1546621157_575px.jpg%22%3E)
%20Founders%20Edition%20-%20The%20NVIDIA%20GeForce%20RTX%202060%206GB%20Founders%20Edition%20Review%3A%20Not%20Quite%20Mainstream&txt=%3Cimg%20alt%3D%22%22%20src%3D%22https%3A%2F%2Fimages.anandtech.com%2Fdoci%2F13762%2FGeForce_RTX_2060_Bracket_1546621177_575px.jpg%22%3E)