Cloud SQL sustains higher TPS (transactions per second) per thread than RDS for MySQL. It outperforms Aurora in configurations of up to 16 threads.
구글이 구글 클라우드 플랫폼(Google Cloud Platform)에서 제공하고 있는 Cloud SQL의 2세대 관리 서비스를 공개하고 일반 제공을 시작했다.
구글 Cloud SQL은 구글 클라우드 플랫폼 내의 구조화 된 질의 언어 서비스로 데이터가 모두 암호화되어 있고 네트워크 방화벽에서 인스턴스에 대한 엑세스 제어가 가능한 보안도 확보되어 있다.
구글이 공개한 2세대 Cloud SQL은 지난 2015년 12월부터 베타 버전으로 제공되어 1세대는 대응하지 않는 데이터베이스에 오류가 발생되기 이전 상태로 복구할 수 있는 PITR(Point-in-Time-Recovery) 스토리지 기능과 자동 리사이즈, 페일 오버 등의 기능이 추가되고 있다.
Cloud SQL의 사용 요금은 1시간 단위 과금 형태로 1세대 Cloud SQL과 달리 600MB Cloud SQL 인스턴스가 0.015달러부터, 스토리지는 1GB당 0.17달러, 최대 16개의 CPU 코어, 104GB RAM에 대한 스케일 업도 가능하다. 패키지 플랜은 하루 단위의 과금으로 0.36달러부터 제공된다.
구글은 공식 블로그에 아마존 웹 서비스(AWS)에서 제공되는 릴레이셔널 데이터베이스(RDS) 서비스인 Aurora와 sysbench에 대한 BMT를 게재하고 있다. 자료에 의하면 Cloud SQL의 트랜잭션 대기 시간은 Aurora의 약 절반으로 1초당 트랜잭션을 2배 처리할 수 있다고 밝혔다. 또 엔드 투 엔드 레이턴시도 AWS 대비 절반 이하로서 퍼포먼스를 어필하고 있다.
= 테스트 시스템
Google Cloud SQL v2, db-n1-highmem-16 (16 CPU, 104 GB RAM), MySQL 5.7.11, 1000 GB PD SSD + Failover Replica
Latency We measured average end-to-end latency with a single client thread (i.e., “pure” latency measurement).
The latency comparison changes as additional threads are added. Cloud SQL exhibits lower latency than RDS for MySQL across all tests. Compared to Aurora, Cloud SQL’s latency is lower until 32 or more threads are used to generate load.
구글은 2세대 Cloud SQL의 제공과 함께 Apache HBase 호환 NoSQL 데이터베이스 서비스 Cloud BigTable과 문서형 NoSQL 데이터베이스 서비스 Cloud Datastore의 2개 관리 데이터베이스 서비스에 대해서도 정식 버전 제공을 시작했다.
Cloud BigTable은 Spotify, Energyworx, FIS와 같은 웹 서비스 감시와 재무, 지리 공간 데이터 분석 애플리케이션의 구축에 이용되고 있다. Cloud Datastore는 높은 가용성과 확장성을 갖추는 것 외 SLA 99.95%의 높은 신뢰성으로부터 웹이나 모바일 애플리케이션 구축에 이용되고 있다.
그 외에도 Google Compute Engine(GCE)의 인스턴스에서 데이터베이스를 이용하는 유저 전용의 기능 강화도 추가되고 있다. GCE 내에서 Microsoft SQL Server의 이미지를 이용할 수 있도록 했고, SSD를 사용한 퍼시스턴트 디스크(Persistent Disk)의 IOPS가 1만 5000에서 2만 5000으로 상승했다. 또 데이터베이스의 백업시 암호화 키를 들여오는 Customer-Supplied Encryption Keys(CSEK) 옵션 추가, Google Cloud Storage Nearline의 산출량에서 객체에 대한 접근이 Google Cloud Storage의 Standard Storage에 근접한 수준까지 개선되고 있다.
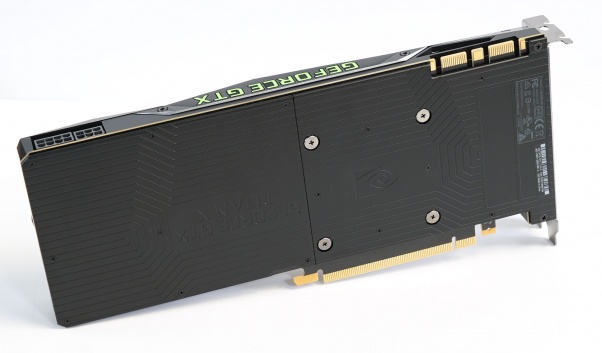
파스칼 타이탄X는 3584개의 쿠다코어와 224개의 텍스처 유닛, 96개의 ROP 유닛으로 구성됩니다. 비디오 메모리는 12GB, 메모리 인터페이스는 384-bit, TDP는 250watts, TSMC 16나노 공정으로 제조되며 가격은 1200달러 입니다.
타이탄X는 GP102 GPU 코어로 구성됩니다.
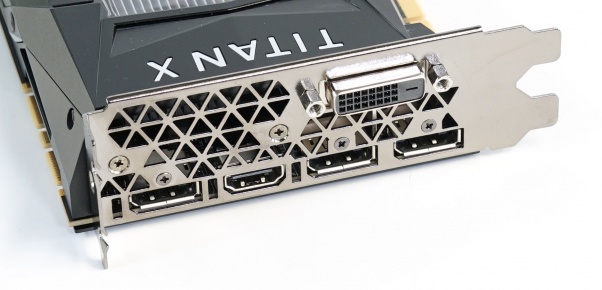
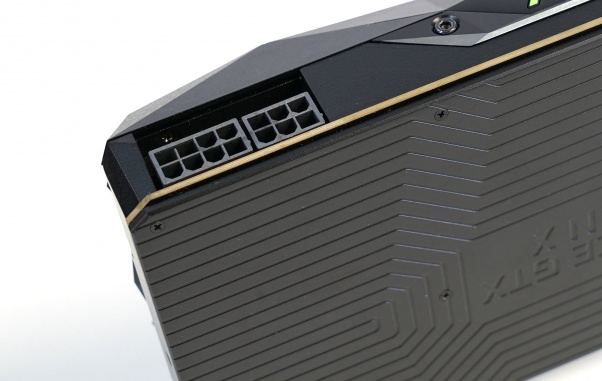
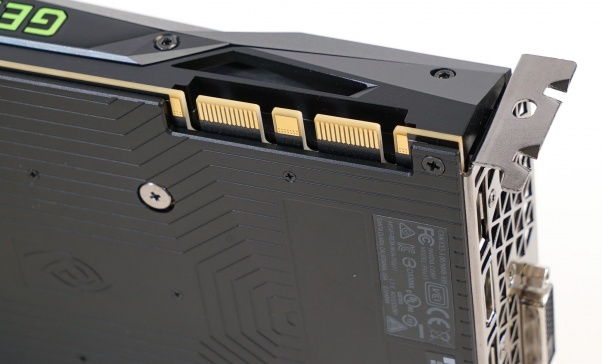
파스칼 타이탄X의 외형입니다. 엔비디아 특유의 디자인이 적용되었으며 인터페이스는 풀 사이즈 DisplayPort 커넥터가 3개, HDMI 2.0a 포트가 1개, dual-link DVI 포트 1개로 구성됩니다. 또한 보조 전원은 8+6핀 구조이며 강력한 SLI 구성도 지원됩니다.
파스탈 타이탄X의 GPU-Z 입니다. 베이스 클럭 1418MHz, 부스트 클럭 1531MHz가 확인되고 있습니다.
게이밍 성능테스트가 시작됩니다.
The PCPER FRAPS File
Previous example data
While the graphs above are produced by the default version of the scripts from NVIDIA, I have modified and added to them in a few ways to produce additional data for our readers. The first file shows a sub-set of the data from the RUN file above, the average frame rate over time as defined by FRAPS, though we are combining all of the GPUs we are comparing into a single graph. This will basically emulate the data we have been showing you for the past several years.
The PCPER Observed FPS File
Previous example data
This graph takes a different subset of data points and plots them similarly to the FRAPS file above, but this time we are look at the “observed” average frame rates, shown previously as the blue bars in the RUN file above. This takes out the dropped and runts frames, giving you the performance metrics that actually matter – how many frames are being shown to the gamer to improve the animation sequences.
As you’ll see in our full results on the coming pages, seeing a big difference between the FRAPS FPS graphic and the Observed FPS will indicate cases where it is likely the gamer is not getting the full benefit of the hardware investment in their PC.
The PLOT File
Previous example data
Previous example data
For tests that show no runts or drops, the data is pretty clean. This is the standard frame rate per second over a span of time graph that has become the standard for performance evaluation on graphics cards.
Previous example data
A test that does have runts and drops will look much different. The black bar labeled FRAPS indicates the average frame rate over time that traditional testing would show if you counted the drops and runts in the equation – as FRAPS FPS measurement does. Any area in red is a dropped frame – the wider the amount of red you see, the more colored bars from our overlay were missing in the captured video file, indicating the gamer never saw those frames in any form.
The wide yellow area is the representation of runts, the thin bands of color in our captured video, that we have determined do not add to the animation of the image on the screen. The larger the area of yellow the more often those runts are appearing.
Finally, the blue line is the measured FPS over each second after removing the runts and drops. We are going to be calling this metric the “observed frame rate” as it measures the actual speed of the animation that the gamer experiences.
The PERcentile File
Previous example data
Previous example data
NVIDIA Titan X (Pascal) 12GB, Average FPS Comparisons, Dirt Rally
GTX 1080
GTX 980 Ti
Fury X
GTX 980 SLI
2560x1440
+41%
+72%
+76%
+35%
3840x2160
+42%
+73%
+70%
+37%
파스칼 타이탄X는 더트랠리 테스트에서 4K 기준 지포스 1080 대비 42%, 980TI 대비 73%, 라데온 퓨리X 대비 70% 높은 성능으로 압도적인 성능을 나타내고 있습니다.
Fallout 4 doesn't see as dramatic of a performance delta at 2560x1440 as we saw in Dirt Rally, but the gap is still impressive. While the GTX 1080 averages less than 100 FPS, the Titan X pushes out 120+ FPS!
When running at 4K, a similar percentage improvement gets us over 60 FPS for the majority of our test run, better than both the GTX 1080 and the Fury X.
NVIDIA Titan X (Pascal) 12GB, Average FPS Comparisons, Fallout 4
GTX 1080
GTX 980 Ti
Fury X
GTX 980 SLI
2560x1440
+25%
+51%
+73%
+12%
3840x2160
+39%
+68%
+82%
+19%
파스칼 타이탄X는 폴아웃4 테스트에서 4K 기준 지포스 1080 대비 39%, 980TI 대비 68%, 라데온 퓨리X 대비 82% 높은 성능으로 압도적인 성능을 나타내고 있습니다.
At 2560x1440, the new Titan X is not any faster than the GTX 980 SLI configuration or the GeForce GTX 1080. It seems the game is CPU limited in this instance.
That definitely gets addressed at 4K - the new Titan X has room to spread its wings and pull away from the pair of GTX 980 cards in SLI as well as the GTX 1080!
NVIDIA Titan X (Pascal) 12GB, Average FPS Comparisons, Grand Theft Auto V
GTX 1080
GTX 980 Ti
Fury X
GTX 980 SLI
2560x1440
+4%
+30%
+74%
+4%
3840x2160
+34%
+73%
+102%
+21%
This table presents the above data in a more basic way, focusing only on the average FPS, so keep that in mind.
파스칼 타이탄X는 그랜드 테프트 오토5 테스트에서 4K 기준 지포스 1080 대비 34%, 980TI 대비 73%, 라데온 퓨리X 대비 102% 높은 성능으로 압도적인 성능을 나타내고 있습니다.
One of the "feathers" in the cap for AMD at the mainstream price point, Hitman running in DX12 mode runs nearly perfectly on the Titan X. Performance tops out over 100 FPS on average, beating out the GTX 1080 by 17% and the AMD Fury X by 37%. Compared to previous games, the Fury X is definitely more competitive, an indication that the DX12 performance advantages are at least helping.
At 4K things separate a bit; the Titan X is 25% faster than the GTX 1080 and 65% faster than the Fury X.
NVIDIA Titan X (Pascal) 12GB, Average FPS Comparisons, Hitman (2016)
GTX 1080
GTX 980 Ti
Fury X
GTX 980 SLI
2560x1440
+17%
+66%
+37%
+110%
3840x2160
+25%
+70%
+65%
+159%
This table presents the above data in a more basic way, focusing only on the average FPS, so keep that in mind.
파스칼 타이탄X는 히트맨 테스트에서 4K 기준 지포스 1080 대비 25%, 980TI 대비 70%, 라데온 퓨리X 대비 65% 높은 성능으로 압도적인 성능을 나타내고 있습니다.
In the Witcher 3, the Titan X is using as much power as the GTX 980 Ti in the early portion of our test run, and as much as the AMD Fury X on the later half. The waves still exist, but they don't seem to indicate any specific power issues. There are a couple of brief instances where the power draw is just over 250 watts.
How does the power distribution break down between the motherboard slot and 8-pin/6-pin power connection with the new Titan X?
파스칼 타이탄X의 전력소모는 압도적인 성능에도 불구하고 지포스 980TI 급의 전력소모를 나타냅니다.