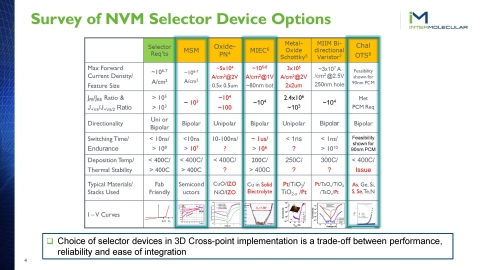
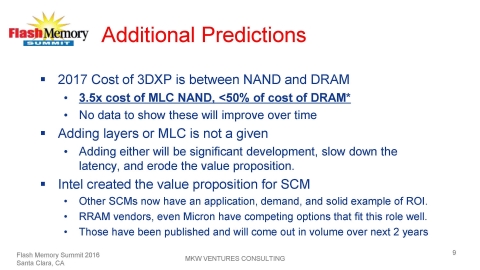
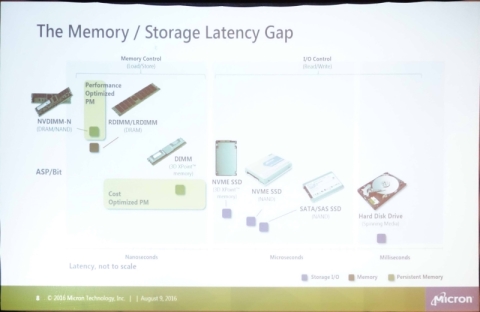
인텔 옵테인 SSD 900p 480GB 리뷰 : Diving Deeper Into 3D XPoint


인텔 옵테인 SSD 900p 480GB 스펙
컨트롤러 : 인텔 SLL3D
메모리 : 인텔 128Gb 3D XPoint 테크놀로지
인터페이스 : PCIe 3.0 x4
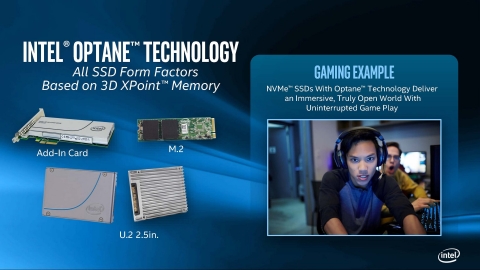
폼팩터 : HHHL Add-in card or 2.5" 15mm U.2 / HHHL Add-in card / HHHL Add-in card (U.2 unknown)
시퀀셜 읽기 : 2500MB/s
시퀀셜 쓰기 : 2000MB/s
랜덤 읽기 : 550k
랜덤 쓰기 : 500k
전력소모 : 읽기 : 8W / 쓰기 : 13W / 버스트 : 14W / 아이들 : 5W
워런티 : 5년
가격 : 280GB = 389달러 / 480GB = 599달러
테스트 시스템
| AnandTech 2017 SSD Testbed | |
| CPU | Intel Xeon E3 1240 v5 |
| Motherboard | ASRock Fatal1ty E3V5 Performance Gaming/OC |
| Chipset | Intel C232 |
| Memory | 4x 8GB G.SKILL Ripjaws DDR4-2400 CL15 |
| Graphics | AMD Radeon HD 5450, 1920x1200@60Hz |
| Software | Windows 10 x64, version 1703 |
| Linux kernel version 4.12, fio version 2.21 | |

The average data rate of the 480GB Optane SSD 900p on The Destroyer is a few percent higher than the 280GB model scored, further increasing the lead over the fastest flash-based SSDs.


The 480GB Optane SSD 900p shows a substantial drop in average latency relative to the 280GB model, allowing it to score better than any flash-based SSD. For 99th percentile latency the 480GB model scores slightly worse than the 280GB, but both are still far ahead of any competing drive.


The two capacities of Optane SSD 900p have essentially the same average read latency that is less than half that of any flash-based SSD. For average write latency, the 480GB model sets a new record while the 280GB performed worse than it did the first time around, but still faster than anything other than the Samsung 960 PRO.


The 99th percentile read and write latency scores for the Optane SSD 900p are all substantially better than any flash-based SSD, even though the 280GB's results again show some variation between this test run and our original review. The 99th percentile read latency scores are particularly good, with the Optane SSDs around 0.5ms while the best flash-based SSDs are in the 1-2ms range.

The Optane SSD 900p in either capacity delivers a much higher average data rate on the Heavy test than any flash-based SSD. As with the original review, the 280GB model is a bit faster when the drive is pre-filled than when the test is run on a freshly-erased drive; the opposite is almost always true of flash-based SSDs. The 480GB's results look more normal and fall in the same range as the 280GB's scores.


The average and 99th percentile latency scores of both Optane SSD capacities are slightly ahead of the fastest flash-based SSDs. Both models also show lower latency when the drive is filled than when it is freshly erased.


The average read latency of the Optane SSD 900p on the Heavy test is about the same for both capacities, and about half that of any flash-based SSD. The average write latencies are a bit worse than the Samsung 960 PRO but still clearly better than the 960 EVO or anything else.


The 99th percentile read latency scores for the Optane SSDs are a fraction of the latency of any other drive, and both capacities of the 900p score about the same. The 99th percentile write latency is barely faster than the Samsung 960 PRO.

The power consumption of the Optane SSDs fits their heritage as derivatives of an enterprise drive. The only other consumer SSD this power hungry is the Intel SSD 750, another enterprise derivative. Even the M.2 PCIe SSDs with relatively poor power management and low performance use much less energy over the course of the test.
The 480GB 900p uses about 10% more energy than the 280GB model while performing about the same.

The Light test shows much greater differences between full and empty drive performance, for both flash SSDs and for the rather variable 280GB Optane SSD 900p. The 480GB model shows less variation in its average data rater between the full and empty runs. Overall, the Optane SSDs outperform a full flash-based SSD but are unimpressive compared to a fresh out of the box flash-based SSD.


Aside from the different behavior of full vs empty, the average and 99th percentile latency scores of the Optane SSDs are not too interesting. The best-case performance is not quite as fast as the best from a flash based SSD, but once the flash drive is slowed down by being full, the Optane SSD shows a meaningful latency advantage.


The average read latency of the Optane SSDs on the Light test is not hurt by filling the drive, giving it much better latency in the worst case scenario than any flash-based SSD. When the Light test is run on freshly-erased drives, the Optane SSD's average read latency is about the same as the best flash-based drives. Neither Optane SSD sets a record for average write latency, and Samsung's fastest NVMe drives have a clear advantage.


As with the average read latency, the 99th percentile read latency of the Optane SSDs on the Light test only impresses when compared to the performance of flash-based SSDs in unfavorable conditions like being completely full. Otherwise, the Samsung PM981 performs just as well, and the 960 PRO isn't far behind. The 99th percentile write latency of the Optane SSDs is clearly worse than Samsung's top NVMe SSDs.

The Optane SSD 900p again requires much more energy than most NVMe SSDs, and the larger Optane drive requires significantly more power—three times as much as the most efficient NVMe SSD we've tested.

Random reads at queue depth 1 are where Intel's Optane products shine. Compared to the fastest NVMe SSDs using MLC NAND flash, the Optane SSDs aren't quite an order of magnitude faster, but only because the latency of the NVMe protocol over PCIe becomes the bottleneck. Intel's tiny Optane Memory M.2 cache drive is slightly faster in this one benchmark, but the difference hardly matters.
Our sustained random read performance is similar to the random read test from our 2015 test suite: queue depths from 1 to 32 are tested, and the average performance and power efficiency across QD1, QD2 and QD4 are reported as the primary scores. Each queue depth is tested for one minute or 32GB of data transferred, whichever is shorter. After each queue depth is tested, the drive is given up to one minute to cool off so that the higher queue depths are unlikely to be affected by accumulated heat build-up. The individual read operations are again 4kB, and cover a 64GB span of the drive.

Adding some higher queue depths to the average shows a small speed advantage for the 480GB Optane SSD over the 280GB model, and the Optane Memory M.2 starting to fall behind the larger Optane SSDs. The NAND flash-based SSDs also pick up speed as queue depths grow, but they need to go far beyond QD4 to catch up.

Given how thoroughly the Optane SSDs have shattered the record for random read performance, it's not too surprising to see them at the top of the charts for power efficiency when performing random reads. The 480GB Optane SSD is a bit less efficient than the smaller model because it has to power significantly more 3D XPoint memory chips with only a small performance boost to show for it. Compared to the flash-based SSDs, the Optane SSDs are only about 2.5 times more efficient, despite being about 7 times faster. The performance doesn't come for free.
At low queue depths the two Optane SSDs offer nearly the same random read performance. When they both reach saturation at QD8, the 480GB model has slightly higher performance, and is drawing about 0.85W more power—a 13% power increase for a 7% performance boost.
Random Write Performance
Our test of random write burst performance is structured similarly to the random read burst test, but each burst is only 4MB and the total test length is 128MB. The 4kB random write operations are distributed over a 16GB span of the drive, and the operations are issued one at a time with no queuing.

The random write performance at queue depth 1 of the Optane SSDs is great, but not record-setting. Flash-based SSDs can cache write operations in their DRAM and report the command as complete before the data has actually made it to the flash memory. This means that for most flash-based SSDs the burst random write speed is more of a controller benchmark than a test of the storage itself. The Optane SSDs don't have large DRAM caches on the drive and are actually writing to the 3D XPoint memory almost as quickly as the Intel SSD 750 can stash the writes in its DRAM.
As with the sustained random read test, our sustained 4kB random write test runs for up to one minute or 32GB per queue depth, covering a 64GB span of the drive and giving the drive up to 1 minute of idle time between queue depths to allow for write caches to be flushed and for the drive to cool down.

With larger queue depths and test durations long enough to defeat any DRAM-based write caching and many SLC write caches, the Optane SSDs rise to the top. With this second round of testing, the 280GB Optane SSD performed slightly worse than the first run, but it's still essentially tied with the fastest flash-based SSDs. The 480GB model is a tiny bit faster than even the previous record from the 280GB model, putting it about 8% faster than the Samsung 960 PRO.

Without a huge performance lead, the high power consumption of the Optane SSDs takes a toll on their efficiency scores for random writes. They are ahead of early NVMe SSDs and on par with the fastest SATA SSDs, but the best current flash-based NVMe SSDs are substantially more efficient. The Toshiba XG5 prioritized efficiency over peak performance and ends up offering more than twice the power efficiency of the Optane SSDs, while the Samsung 960 EVO has a mere 77% efficiency advantage at essentially the same level of performance.
As with random reads, the performance and power consumption gap between the two Optane SSD 900p capacities widens at higher queue depths. With power consumption starting at 5W and climbing to over 10W for the larger model, the Optane SSDs are in a completely different league from M.2 NVMe SSDs, which mostly top out around 4.5W.

Despite having incredibly low access latency, the Optane SSD 900p doesn't beat the fastest flash-based SSDs in our burst sequential read test. The fastest flash SSDs make up for their slower initial response time through a combination of higher channel counts, prefetching and most likely larger native block sizes. The Optane SSD 900p still has a great score here, but it fails to stand out from the much cheaper flash-based drives.
Our test of sustained sequential reads uses queue depths from 1 to 32, with the performance and power scores computed as the average of QD1, QD2 and QD4. Each queue depth is tested for up to one minute or 32GB transferred, from a drive containing 64GB of data.

With the test of higher queue depths and longer run times, the Optane SSDs are back on top with a substantial performance lead. Unlike the burst test, this test shows almost no performance difference between the two capacities of the Optane SSD 900p.

The performance lead of the Optane SSD 900p isn't enough to make up for its higher power consumption, so the 900p ends up in the second tier of drives for sequential read power efficiency, alongside Samsung's 960 generation and the Toshiba XG5.
The 480GB Optane SSD 900p draws about 0.6–0.75W more than the 280GB model during the sequential read test, putting it just over 8W total when operating at full speed. Even the smaller 900p is still over 6W at QD1, while the flash-based SSDs are mostly in the 4-5W range. (The Intel SSD 750 breaks 9W at higher queue depths.)
Sequential Write Performance
Our test of sequential write burst performance is structured identically to the sequential read burst performance test save for the direction of the data transfer. Each burst writes 128MB as 128kB operations issued at QD1, for a total of 1GB of data written to a drive containing 16GB of data.

The burst sequential write performance of the Intel Optane SSD 900p is on par with some of Samsung's older NVMe SSDs, but is exceeded by the 960 generation and the PM981.
Our test of sustained sequential writes is structured identically to our sustained sequential read test, save for the direction of the data transfers. Queue depths range from 1 to 32 and each queue depth is tested for up to one minute or 32GB, followed by up to one minute of idle time for the drive to cool off and perform garbage collection. The test is confined to a 64GB span of the drive.

On the longer sequential write test, the Samsung PM981 falls out of first place and ends up substantially slower than the Optane SSD 900p, but the Samsung 960 PRO and EVO are still faster than the 900p.

The power efficiency of the Optane SSD 900p during sequential writes is worse than most M.2 NVMe SSDs, though not as bad as the extremely power-hungry Intel SSD 750.
The two capacities of the Optane SSD 900p offer essentially identical sequential write performance. As with sequential reads, the difference in power consumption between the two capacities is about 0.75W, but the writes require about than 2W more than the reads.

Since this mixed random I/O test is conducted at the relatively low queue depth of four, the Optane SSDs have a large performance advantage, and even the tiny Optane Memory M.2 does well (though it has to run a slightly modified version of the test due to its low capacity). The Optane SSDs are more than three times faster overall than the highest-scoring flash-based SSD.

The Optane SSDs have a substantial power efficiency lead on the mixed random I/O test, but it is small enough that flash-based SSDs could conceivably catch up with a generation or two of improvements. As usual, the 480GB model has clearly lower efficiency because its minor performance advantage doesn't outweigh the power cost the extra 3D XPoint memory chips.
Both capacities of the Intel Optane SSD 900p show a modest decline in performance as the workload becomes more write-heavy, and a fairly linear increase in power consumption. The 480GB model's power consumption grows slightly faster than the 280GB model, leading to a 0.9W gap at the end of the test.
Even the Intel SSD 750 draws substantially less power for most of the test, though it catches up at the very end. The flash-based M.2 NVMe SSDs are mostly drawing a fraction of what the Optane SSDs require. In terms of performance, none of the flash-based SSDs come at all close to the Optane SSDs until the very end of the test, where many are able to deliver good random write speed.
Mixed Sequential Performance
Our test of mixed sequential reads and writes differs from the mixed random I/O test by performing 128kB sequential accesses rather than 4kB accesses at random locations, and the sequential test is conducted at queue depth 1. The range of mixes tested is the same, and the timing and limits on data transfers are also the same as above.

The Intel Optane SSD 900p is much faster on the mixed sequential I/O test than any consumer flash-based SSD. Samsung's best drives are slower by a third, and it's downhill from there for NAND flash. The 480GB model actually performed slightly worse on this test than the 280GB model, but the difference is small enough it may simply be due to variation between runs.

The power efficiency of the Optane SSD 900p on the mixed sequential I/O test is good but not quite at the top of the charts. Instead, it is on par with the Samsung 960 EVO, which sacrificed a bit of efficiency to improve performance relative to the Samsung 950 PRO.
The 280GB Optane SSD 900p was a bit faster than the 480GB overall but a bit less steady over the course of the test. The scaling of the Optane SSDs is quite similar to the results from the mixed random test: a gradual decline in performance as the proportion of writes increases, and a linear increase in power consumption. The overall performance level is significantly higher than for the random I/O test.
The flash-based SSDs can get much closer to competing with the Optane SSDs on this mixed sequential test than on the mixed random test. Several drives have sequential read speeds that approach that of the Optane SSDs, and a few have higher sequential write performance. But through the middle portions of the test, the flash-based SSDs all lose a lot of their performance for at least a few phases of the test, while the Optane SSD has no acute performance weakness.


(idle power)

(idle wake-up)
'월드 벤치마크' 카테고리의 다른 글
| 배틀그라운드를 통한 인텔 vs AMD CPU 성능 비교 (0) | 2017.12.30 |
|---|---|
| 삼성 PM981 SSD 리뷰 : Next Generation Controller And 3D NAND (0) | 2017.12.25 |
| 엔비디아 타이탄 V 리뷰 - Titanomachy: War of the Titans (0) | 2017.12.23 |
| 애플 아이폰X vs 안드로이드 스마트폰 성능비교 (0) | 2017.11.18 |
| 커피레이크 i5 8600k, 8400, i3 8350K, 8100 vs AMD 라이젠 승부 (0) | 2017.10.22 |


